IMF Highlights “New Mediocre” Risks To Australian Economy

The IMF concluding statement says Australia is transitioning from the mining boom with strong growth and relatively low unemployment, but has not been immune to symptoms of the “new mediocre”. Wage and price pressures are weak, underemployment has risen, and non-mining investment is yet to fully recover. Ensuring the return to full employment under weak global conditions will need continued accommodative monetary policy and quality infrastructure spending, which will also boost long term growth potential. A coordinated fiscal and monetary policy response may also be needed if large downside risks were to materialize. Prudential policies have helped reduce housing related risks, and efforts to strengthen financial sector resilience should continue.

Money-Puzzle-Pic

Context

Australia’s economic performance has remained remarkably robust in comparison to other advanced economies despite lower commodity prices and the end of the mining investment boom. The resilience to the large shocks since 2011 reflects a flexible exchange rate acting as a shock absorber, an accommodative monetary policy stance, export orientation to the dynamic Asia region, flexible labor markets, relatively high population growth, and strong institutions.

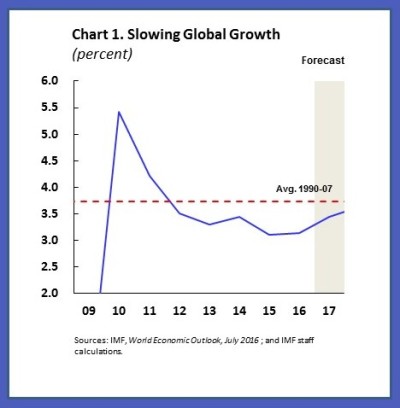
Still, Australia has been confronted with symptoms of the “new mediocre,” albeit to a lesser extent than in almost all other advanced economies. Growth has been lower since the global financial crisis (GFC), with much of the related decline in potential growth because of moderating population growth. As elsewhere, the recovery has fallen short of expectations in 2014-15, because of external and internal factors, including in non-mining business investment. While unemployment has remained relatively low, underemployment and longer-term unemployment have risen, and nominal wage growth and inflation have been weak.

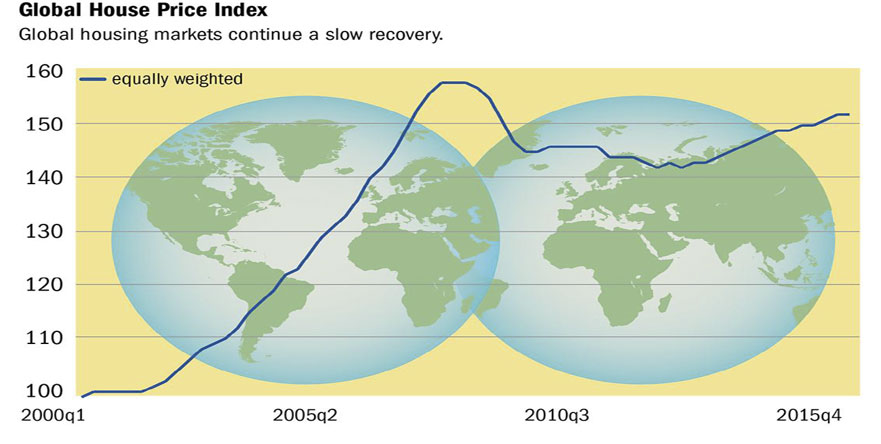
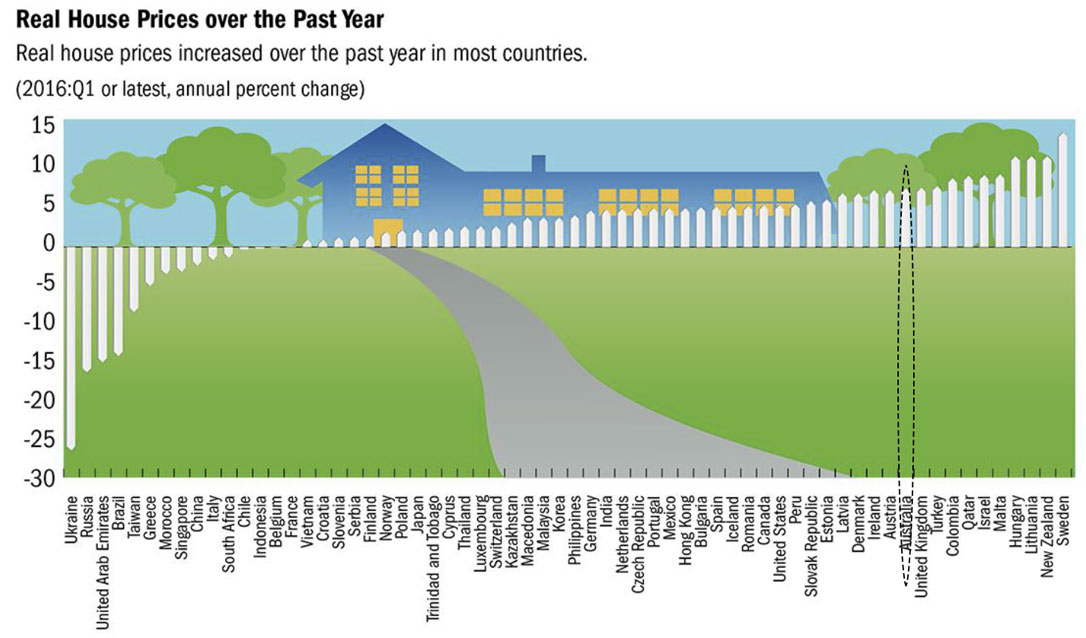
House prices and household debt ratios have risen further in the low-interest environment post-GFC, up from already high pre-crisis levels. Other macro-financial vulnerabilities relate to the perennial, sizeable net external liabilities, intermediated in part through the banking sector.

Recent Developments, Outlook and Risks

After a pickup in economic activity from mid-2015, Australia has advanced markedly in its recovery but experienced a downshift in inflation in early 2016. Annual growth has increased to over 3 percent, partly on account of temporary factors. Both headline and core inflation are now below the RBA’s 2 to 3 percent target range.

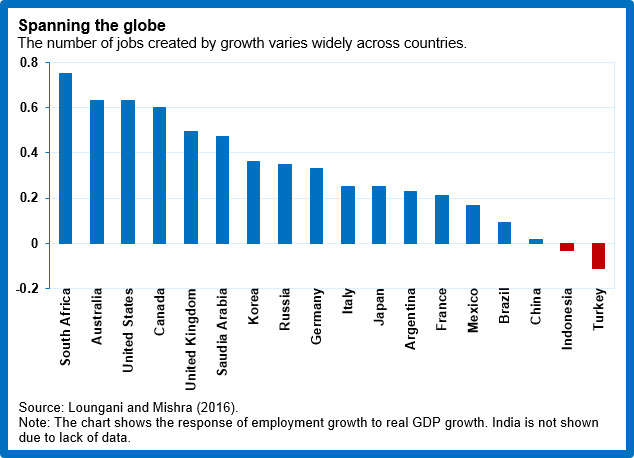
Economic slack has started to moderate, although the fall in the unemployment rate has likely overstated the improvement in labor markets. The underemployment rate—defined as the proportion of employed persons in the labor force seeking to work more hours—has risen, as some 80 percent of jobs created over the past year have been part-time jobs.

On the macro-financial side, prudential policies have resulted in a tentative stabilization of housing-related vulnerabilities. APRA’s prudential measures introduced in late 2014, including tighter lending standards focusing on debt serviceability, have improved the risk profile of new loans. Overall housing credit growth and market turnover have remained lower than last year. But with the declines in longer-term interest rates and continued strong demand, including from nonresidents, upward pressure on house prices has remained strong in some cities. While household debt has continued to be high, risks to banks and to household balance sheets are mitigated by the ongoing strong growth in deposits in mortgage offset accounts.

Banks’ balance sheets have become more resilient . APRA’s analysis suggests that, after raising capital, CET-1 capital ratios of Australian banks have, on a comparable basis, narrowly moved into the upper quartile of international peers (broadly in line with the Financial System Inquiry recommendation that banks’ capital positions be “unquestionably strong”). As banks prepare to meet net stable funding ratio requirements by 2018, the share of stable funding in their liabilities has already increased, including higher shares of domestic deposits and longer-term debt.

The baseline outlook is for a continued gradual recovery. After strong momentum, growth is expected to moderate somewhat over the next two years. The disinflation experienced in 2015-16 is expected to start reversing. On the macro-financial side, house price inflation is expected to realign with broader measures of nominal income. The accumulation of net external liabilities should slow in the absence of valuation effects.

The balance of risks has improved but is still tilted to the downside. On the upside, the momentum of the recovery could be stronger, as recent strong growth and terms-of-trade improvements could boost business confidence and unlock stronger business investment. On the downside, investment could be more subdued, as corporate profits could remain under pressure for longer. Consumption growth could turn lackluster if wage growth stayed low. On the external side, there are risks to global trade from rising populism and nationalism in large economies and from tighter and more volatile global financial conditions. A major concern is that external risks with a large impact, including a sharp growth slowdown in China, could interact with or even trigger domestic risks, especially a housing correction.

Policy Discussion

Australia’s transition following the end of the mining investment boom is well advanced but adequate policy support remains critical to secure the return to full employment in a fragile global environment and longer-term growth. The lack of significant price and wage pressures suggests persistent slack, which, if prolonged, risks hurting medium-term supply potential.

Monetary Policy

The monetary policy stance should remain accommodative in a still disinflationary global environment. While Australia’s low inflation is more recent than in most other advanced economies, policy decisions should remain predicated on the possibility that inflation may return into the target range later than expected, given international experience. In this regard, the RBA’s prompt monetary policy response to the lower-than-expected inflation in early 2016 has reinforced its commitment to the inflation targeting framework. Prudential measures to address housing-related risks have mitigated concerns about the impact on balance sheets and financial stability from lowering policy rates further. With the expected very gradual return of inflation into the target range, lengthening the forecast horizon in monetary policy statements could clarify the RBA’s expectations about the inflation path.

Fiscal Policy

Australia has fiscal space even though recent budget targets have been missed and debt has risen. Metrics such as the debt-to-GDP ratio suggest that there is fiscal space under both the baseline and economic stress scenarios. In IMF staff’s view, the worse-than-planned budget outcomes over the past few years have reflected the weaker-than-expected growth rather than policy easing. Forging ahead with consolidation would most likely have resulted in lower growth over that period.

The government appropriately plans to balance the budget over a 5-year horizon while making the expenditure composition more growth-friendly. The change in the expenditure composition focuses on supporting longer-term growth through spending on infrastructure and other measures supporting longer-term and inclusive growth, including measures to boost innovation and address youth unemployment.

In IMF staff’s view, the pace of targeted fiscal consolidation under the baseline should be more gradual and some of the growth-friendly spending should be ramped up.

  • The May 2016 budget targets front-loaded fiscal consolidation, especially in FY2017/18 where the adjustment is penciled in at roughly 3/4 of a percentage point of GDP. Such an ambitious pace could be counterproductive in the current phase of the recovery. Australia has the fiscal space for undertaking more gradual consolidation to a balanced budget by FY2020/21, the target in the budget.
  • While general government spending on infrastructure has increased in FY2016/17, this increase primarily reflects higher spending by states, not the Commonwealth. Indeed, capital spending is expected to increase by ½ of a percentage point of GDP in the current budget year, but these efforts are not expected to be sustained as spending is projected to level off in the next fiscal year and to decline thereafter. A more sustained, multi-year increase in spending on efficient infrastructure also at the Commonwealth level would be desirable, considering that Australia has infrastructure needs and fiscal space, the funding environment is favorable, and that the expected return to full employment is gradual. The boost to growth under these conditions should largely contain the impact of more gradual consolidation with higher infrastructure spending on the public debt-to-GDP ratio, provided that discipline in recurrent spending is maintained. If high-impact downside risks were to materialize, fiscal policy should support aggregate demand, as monetary policy could be constrained. Unlike in previous downturns, monetary policy may soon be constrained by the lower bound on nominal policy rates. Contingency plans and a pipeline of infrastructure projects would help in reducing the implementation lags involved in undertaking fiscal stimulus.

    A long-term debt anchor could strengthen the current fiscal framework. It is a strength of the framework that it requires the Commonwealth government to report against a medium-term fiscal strategy based on “principles of sound fiscal management.” IMF staff recommends to consider augmenting the current medium-term budget balance anchor with a longer-term debt anchor. The latter would provide certainty about debt and fiscal policy in the future and, if implemented over a 5- to 10-year horizon, would be sufficiently flexible to allow for countercyclical support if needed.

Managing Macro-Financial Vulnerabilities

With more acute risks concentrated in a few specific housing market segments, policies should focus on further strengthening resilience to housing market and other shocks with macro-financial implications.

  • With continued upside risk to house prices, APRA should stand ready to intensify targeted prudential measures, if investor and other risky lending or house price growth were to re-accelerate. However, the scope and extent of tightening need to be carefully calibrated, so as not to trigger a sharp correction.
  • APRA should continue to actively encourage banks’ efforts to robustly anchor their capital position in “unquestionably strong” territory, given a highly concentrated banking sector where banks have similar business models.
  • Treasury’s preparation of new legislation to further the regulatory reform agenda should continue to complete the implementation of the recommendations of the Financial System Inquiry, including on the crisis management toolkit and bank resolution. APRA should continue in its effort to implement prudential steps to strengthen the loss absorbing and recapitalization capacity of banks and introduce leverage ratios, in line with the international agenda.

The macro-financial resilience of the economy to housing market shocks could be enhanced through tax reform . The tax system provides households with incentives for leveraged real estate investment that likely amplifies housing cycles.

Keeping Up Productivity Growth

Maintaining high productivity growth rates may be challenging. Overall labor productivity growth in Australia has remained broadly stable over the 2000s. However, in some of the services sectors with a growing employment share, labor productivity growth has been weak, as has multifactor productivity growth more generally.

The government’s reform agenda appropriately focuses on fostering innovation and strengthening competition . It includes the government’s National Innovation and Science Agenda, which allocates $1.1 billion over four years to boost innovation and entrepreneurship in the high tech sector. We encourage its envisaged continuation and, if effective, its expansion. On competition, the measures recommended by the Harper Review would strengthen services sector competition and ultimately productivity. The process of implementation is underway, but will require extensive collaboration between the Commonwealth government and the governments of the States and Territories.

We welcome Australia’s intention to continue efforts toward further trade liberalization, both in regional and multilateral fora. Expanding access to service export markets could also strengthen services sector productivity in Australia and elsewhere, while the social safety net and active labor market policies would mitigate the cost to those who shoulder the burden of adjustment.

Fixing the Great Distortion: How to Undo the Tax Bias Toward Debt Finance

From the IMF Blog.

“The Great Distortion.” That’s what The Economist, in its cover story of May 2015¸ called the systematic tax advantage of debt over equity that is found in almost every tax system.

This “debt bias” is now widely recognized as a real risk to economic stability. A new IMF study argues that it needs to feature more prominently on tax reform agendas; it also sets out options for how to do that.

Debt bias: Why we should (still) worry

The IMF’s recent Fiscal Monitor shows that global debt levels have risen to a record 225 percent of world GDP. And high corporate debt poses significant economic stability risks—especially in the financial sector: no one needs any reminder of the enormous damage from distress and failure of large financial institutions.

Since the global financial crisis, many governments have strengthened policies to mitigate excessive corporate borrowing, notably by tightening regulatory capital requirements for financial institutions.

That’s good. But most tax systems continue to do exactly the opposite: they allow interest to be deductible, but not the costs of equity finance, and so encourage corporations to finance themselves through debt rather than equity. Chart 1 clearly shows that this tax discrimination in favor of debt is still widespread.

fad-taxdebt-chart1

In advanced economies, the tax bias has increased debt ratios in nonfinancial corporations by, on average, 7 percent of total assets (about 15 percent of GDP). Our new results find that, despite their special status, financial institutions show a very similar response. Debt bias thus amplifies financial and macroeconomic stability risks—and the effect is too big to keep ignoring.

What can be done?

There are two broad ways to mitigate debt bias: limit the tax deductibility of interest, or provide a deduction for equity costs. There is now plenty of experience with both.

Limiting interest deductions

Some 60 countries have some form of limitation on interest deductibility. The details of the rules on these limitations vary greatly—and those details matter.

  • 39 countries apply the limitations only to “related-party” debt (between affiliates within a multinational group). New analysis reported in our paper finds that (as one might expect) these rules have no discernable impact on firms’ borrowing from unrelated parties—which is what gives rise to stability concerns.
  • 21 countries have rules applicable to all debt, related party or not. On average, these rules do reduce the external debt-to-asset ratio by around 5 percentage points—a significant effect.

Limitations on interest deductibility thus can work, but only if they cover all forms of debt.

Allowing a deduction for equity

Several countries—Belgium, Cyprus, Italy, and Turkey—have introduced an allowance for corporate equity (ACE). This retains the deduction for interest but adds a similar deduction for the normal return on equity.

Economists tend to like the ACE: it neutralizes debt bias and also eliminates tax distortions to investment. And the allowance continues to win over policymakers: Switzerland will soon introduce it, the Danish government has recently proposed its adoption, and the European Commission included it in its recent proposal for a common corporate tax base in the European Union.

And the ACE works. Chart 2 reports new evidence on the effect of the Belgian allowance on corporate debt ratios in nonfinancial firms (left) and banks (right), relative to a synthetic control group of companies in other countries.

The impact is significant and large: the debt ratio in Belgium is almost 20 percentage points lower than in the control group for nonfinancial firms and almost 14 percentage points lower than in the control group for banks.

fad-taxdebt-chart2

The main hesitation about the ACE is the potential revenue loss. We find that if the allowance were given to all equity, corporate income tax revenue would fall by 5-12 percent (Chart 3, left panel).

But governments can reduce the revenue cost while preserving the efficiency gains from the ACE by giving it only in respect to equity added after some base year—as is done in Italy and Switzerland and has been proposed in Denmark and by the European Commission.

This reduces the first-year revenue cost to about 1 percent of corporate income tax revenue (Chart 3, right panel). In the financial sector, moreover, the allowance might be granted only for equity above what is already required due to minimum regulatory capital requirements, which would further reduce the fiscal costs.

FAD.TaxDebt.chart3.jpg

No better moment

Since the global crisis, debt bias has become much more widely recognized as a real macroeconomic concern. Governments have taken some steps to fix the distortions it creates.

But the issue has not gone away, and in the financial sector, tax policies (which encourage debt finance) and regulatory policies (which do the opposite) continue to be fundamentally misaligned. In our view, debt bias needs to figure more prominently in countries’ corporate tax reform agendas. The approaches discussed here have proven effective, and they can be tailored to countries’ circumstances. The revenue impact is currently muted by low interest rates. There will be no better moment than now to address the “Great Distortion” once and for all.

Does Growth Create Jobs?

From the IMF Blog.

The link between jobs and economic growth is not always a straight line for countries, but that doesn’t mean it’s broken.

Economists track the relationship between jobs and growth using Okun’s Law, which says that higher growth leads to lower unemployment.

New research from the IMF looks at Okun’s Law and asks, based on the evidence, will growth create jobs? The findings show a striking variation across countries in how employment responds to GDP growth over the course of a year.

res-jobsgrowth-chart

In some countries, when growth picks up, employment goes up and unemployment falls; in other countries the response is quite muted. A pick-up in growth—through a stimulus to the demand side of the economy, for instance increased government spending on infrastructure—will result in more jobs.

Some countries generate more jobs from growth than others

The extent of job creation in the short run varies across countries. This chart shows how much employment increases when growth picks for the Group of Twenty advanced and emerging economies, which together account for the lion’s share of global GDP and employment.

While Okun’s Law holds overall for the United States, the relationship between unemployment and growth since 2011 did deviate from the historical pattern because the depth and duration of the great recession—the period following the global crisis in 2008—led to so many more people losing their jobs.

In South Africa, Australia, and Canada, a 1 percent increase in GDP is matched by an increase in employment of 0.6 percent or higher. In contrast, there is virtually no response of employment to growth in China, Indonesia, and Turkey.

The extent to which changes in growth account for changes in unemployment and employment also varies across countries. GDP growth accounts for over 70 percent of the variation in employment in Canada and the United States, about 40 percent in Russia, the United Kingdom, and Australia, and very little in many other countries.

For the majority of countries around the world, taking account of growth is an important part of understanding short-run changes in unemployment. For other countries, there are several possible explanations for the weakness of the jobs-growth link. In some cases, reported unemployment rates may not fully reflect the true unemployment rate. Some countries are going through rapid structural change and unemployment may be driven by this longer-run trend rather than short-run fluctuations.

You can’t have one without the other

This then begs the questions: Where will growth come from? Global growth has been too low, for too long, and for too few. The answer is found on both the demand and supply side of the economy.

For example, if companies do not see their sales improving, they will not increase their capacity to produce more, so it is essential to ensure that the demand is there to sustain supply. But without supply measures, gains in output based solely on a stimulus to demand will prove temporary. The range of supply measures varies, from removing bottlenecks in the power sector to reforms in labor and product markets. In many countries, there is a strong case to increase spending on public infrastructure, which would provide a much-needed boost to demand in the short term and would also help supply.

All this means countries need to use all policies—monetary, fiscal, and structural—to maximize growth within countries and amplify the impact though coordination across countries.

This “three-pronged” approach would free up more policy space—more room to actthan is commonly assumed.

More On The Problem Of Home Price Indices

We need measures of residential property price inflation. They need to identify bubbles, the factors that drive them, instruments that contain them, and analyse their relation to recessions. Such measures are also needed for the System of National Accounts and may be needed as part of the measurement of owner-occupied housing in a consumer price index. So, timely, comparable, proper measurement is a prerequisite for all of this, driven by concomitant data.

House-and-ArrowRecent developments in Australia have highlighted the fact that there are issues with the metrics here. The RBA has switched from CoreLogic because they suggested this index overstated home price growth, now preferring other index providers. CoreLogic recently discussed their approach.

So the latest IMF working paper – “How to better measure hedonic residential property price indexes” makes interesting reading.

The problem of quality-mix adjustment

Critical to price index measurement is the need to compare, in successive periods, transaction prices of like-with-like representative goods and services. Price index measurement for consumer, producer, and export and import price indexes (CPI, PPI and XMPIs) largely rely on the matched-models method. The detailed specification of one or more representative brand is selected as a high-volume seller in an outlet, for example a single 330 ml. can of regular Coca Cola, and its price recorded. The outlet is then revisited in subsequent months and the price of the self-same item recorded and a geometric average of its price and those of similar such specifications in other outlets form the building blocks of a price index such as the CPI. There may be problems of temporarily missing prices, quality change, say size of can or sold as a bundled part of an offer if bought in bulk, but essentially the price of like is compared with like every month. RPPIs are much harder to measure.

First, there are no transaction prices every month/quarter on the same property. RPPIs have to be compiled from infrequent transactions on heterogeneous properties. A higher (lower) proportion of more expensive houses sold in one quarter should not manifest itself as a measured price increase (decrease). There is a need in measurement to control for changes in the quality of houses sold, a non-trivial task.

The main methods of quality adjustment are (i) hedonic regressions; (ii) use of repeat sales data only; (iii) mix-adjustment by weighting detailed relatively homogeneous strata; and (iv) the sales price appraisal ratio (SPAR). The method selected depends on the database used. There needs to be details of salient price-determining characteristics for hedonic regressions, a relatively large sample of transactions for repeat sales, and good quality appraisal information for SPAR. In the US, for example, price comparisons of repeat sales are mainly used, akin to the like-with-like comparisons of the matched models method, Shiller (1991). There may be bias from not taking full account of depreciation and refurbishment between sales and selectivity bias in only using repeat sales and excluding new home purchases and homes purchased only once. However, the use of repeat sales does not require data on quality characteristics and controls for some immeasurable characteristics that are difficult to effectively include in hedonic regressions, such as a desirable or otherwise view from the property.

The problem of source data

Second, the data sources are generally secondary sources that are not tailor-made by the national statistical offices (NSIs), but collected by third parties, including the land registry/notaries, lenders, realtors (estate agents), and builders. The adequacy of these sources to a large extent depends on a country’s institutional and financial arrangements for purchasing a house and varies between countries in terms of timeliness, coverage (type, vintage, and geographical), price (asking, completion, transaction), method of quality-mix adjustment (repeat sales, hedonic regression, SPAR, square meter) and reliability; pros and cons will vary within and between countries. In the short-medium run users may be dependent on series that have grown up to publicize institutions, such as lenders and realtors, as well as to inform users. Metadata from private organizations may be far from satisfactory.

We stress that our concern here is with measuring RPPIs for FSIs and macroeconomic analysis where the transaction price, that includes structures and land, is of interest. However, for the purpose of national accounts and analysis based thereon, such as productivity, there is a need to both separate the price changes of land from structures and undertake adjustments to price changes due to any quality change on the structures, including depreciation. This is far more complex since separate data on land and structures is not available when a transaction of a property takes place. Diewert, de Haan, and Hendriks (2011) and Diewert and Shimizu (2013a) tackle this difficult problem.

Figure 1 shows alternative data sources in its center and coverage, methods for adjusting for quality mix, nature of the price, and reliability in the four quadrants. Land registry data, for example, may have an excellent coverage of transaction prices, but have relatively few quality characteristics for an effective use of hedonic regressions, not be timely, and have a poor reputation. Lender data may have a biased coverage to certain regions, types of loans, exclude cash sales, have “completion” (of loan) price that may differ from transaction price, but have data on characteristics for hedonic quality adjustment. Realtor data may have good coverage, aside from new houses, data on characteristics for hedonic quality adjustment, but use asking prices rather than transaction prices.

The importance of distinguishing between asking and transaction prices will vary between countries as the length of time between asking and transaction varies with the institutional arrangements for buying and selling a house and the economic cycle of a country.

Whether measurement matters

A natural question is whether the differences in source data and methodologies used matters to the overall outcome of the index. Silver (2015) undertook an extensive formal analysis based on the RPPIs and, as explanatory variables, the associated methodological and source data for 157 RPPIs from 2005:Q1 to 2010:Q1 from 24 countries. The resulting panel data had fixed-time and fixed-country effects; the estimated coefficients on the explanatory measurement variables were first held fixed and then relaxed to be time varying. Subsequently, the explanatory variables were interacted with the country dummies.

imf-indicesThe rest of the paper examines, consolidates, and provides improved practical methods for the timely estimation of hedonic RPPIs, though, as noted earlier, the proposed methods apply equally to CPPIs. Hedonic regressions are the main mechanism recommended for and used by countries for a crucial aspect of RPPI estimation—preventing changes in the quality-mix of properties transacted translating to price changes.

RPPIs and CPPIs are hard to measure. Houses, never mind commercial properties, are infrequently traded and heterogeneous. Average house prices may increase over time, but this may in part be due to a change in the quality-mix of the houses transacted; for example, more 4-bedroom houses in a better (more expensive) post-code transacted in the current period compared with the previous or some distant reference period would bias upwards a measure of change in average prices. A purpose and crucial challenge of RPPIs and CPPIs is to prevent changes in the quality-mix of properties transacted translating to measured price changes. The need is to measure constant-quality property price changes and while there are alternative approaches, the concern of this paper is with the hedonic approach as a recommended widely used methodology for this.


Note: IMF Working Papers describe research in progress by the author(s) and are published to elicit comments and to encourage debate. The views expressed in IMF Working Papers are those of the author(s) and do not necessarily represent the views of the IMF, its Executive Board, or IMF management.

The Low Growth Trap

Low growth, high inequality, and slow progress on structural reforms are important issues for the global economy. The political pendulum threatens to swing against economic openness, and without forceful policy actions, the world could suffer from disappointing growth for a long time. The IMF’s Christine Lagarde argues that forceful policy actions are needed to avoid a low-growth trap in the IMF Blog.

2016 will be the fifth consecutive year with global GDP growth below its long-term average of 3.7 percent (1990-2007), and 2017 may well be the sixth (Chart 1). Not since the early 1990s—when ripple effects from economic transition caused growth to slow—has the world economy been so weak for such a long time. What has happened?

Chart 1 with background

In advanced economies, real growth is running almost a full percentage point below the average of 1990-2007.

  • Many are still plagued by crisis legacies, such as private and public sector debt overhangs, and impaired balance sheets of financial institutions. The result has been stubbornly weak demand.
  • The longer demand weakness lasts, the more it threatens to harm long-term growth as firms reduce production capacity and unemployed workers are leaving the labor force and critical skills are eroding. Weak demand also depresses trade, which adds to disappointing productivity growth.
  • On the supply side, slowing productivity and adverse demographic trends are weighing on potential growth—a trend that started before the global financial crisis. And with little expectation of stronger growth tomorrow, firms have even less incentive to invest, which hurts both productivity and short-term growth prospects.

Emerging economies have also been slowing—but from an exceptionally fast pace of growth in the past decade. Their slowdown is therefore more a return to the historical norm. Developments within emerging economies are quite diverse. In 2015, for example, GDP in two of the four largest economies—China and India—grew between 7-7½ percent, while GDP contracted by close to 4 percent in the other two—Russia and Brazil. But there are important common factors:

  • One is the rebalancing of the Chinese economy from investment to consumption, and from external demand to domestic demand. While a stable Chinese economy growing at sustainable rates is ultimately good for the world economy, the transition is costly for trading partners that rely on Chinese demand for their exports. It can also trigger bouts of financial volatility along the way.
  • The second, related, development is the large decline in commodity prices, which has taken a toll on disposable income for many commodity exporters. The adjustment of commodity exporters to this new reality will be difficult and protracted. In some cases, it calls for a change in their growth model.

Weak global growth that interacts with rising inequality is feeding a political climate in which reforms stall and countries resort to inward-looking policies. In a broad cross-section of advanced economies, incomes for the top 10 percent increased by about 40 percent in the past 20 years, while growing only very modestly at the bottom (Chart 2). Inequality has also increased in many emerging economies, although the impact on the poor has sometimes been offset by strong general income growth.

Chart 2 with Background

Forceful policy actions are needed to avoid what I fear could become a low-growth trap. Here are the key elements of a global growth agenda as I see them:

  • The first element is demand support in economies that operate below capacity. In recent years, this task has been delegated mostly to central banks. But monetary policy is increasingly stretched, as several central banks are operating at or close to the effective lower bound for policy rates. This means fiscal policy has a larger role to play. Where there is fiscal space, record-low interest rates make for an excellent time to boost public investment and upgrade infrastructure.
  • The second element is structural reforms. Countries are not doing nearly enough in this area. Two years ago, the members of the G20 pledged reforms that would lift their collective GDP by an additional two percent over 5 years. But in the most recent assessment, the measures implemented to date are worth at most half this amount—so more reforms are urgent. IMF research shows that reforms are most effective when they are prioritized along countries’ reform gaps and take into account the level of development and position in the business cycle.
  • The third element is reinvigorating trade by reducing trade costs and rolling back temporary trade barriers. It is easy to blame trade for all the ills afflicting a country—but curbing free trade would be stalling an engine that has brought unprecedented welfare gains around the world over many decades. However, to make trade work for all, policymakers should help those who are adversely affected through re-training, skill building, and assisting occupational and geographic mobility.
  • Finally, policies need to ensure that growth is shared more broadly. Taxes and benefits should bolster incomes at the low end and reward work. In many emerging economies, stronger social safety nets are needed. Investments in education can raise both productivity and the prospects of low-wage earners.

It takes political courage to implement this agenda. But inaction risks reversing global economic integration, and therefore stalling an engine that, for decades, has created and spread wealth around the globe. This risk is, in my view, too large to take.


Drowning In Debt

The latest IMF Fiscal Monitor is called – Debt, Use it Wisely. It is salutary reading though nothing very new – readers of this blog will be aware we have been banging on about high debt for several years.

Bank-LensBut the latest report says that globally, the total of public and private debt is around $US152 trillion ($199 trillion). They conclude that some advanced economies face greater risks now in the event of crisis mirroring that seen in 2008. We are, they say, highly exposed. You can look at the global debt clock here.

Vitor Gaspar, the IMF’s head of fiscal affairs said “At $US152 trillion, global debt is at record highs and constitutes one of the most important headwinds against growth in the global economy.”

“When there’s a build-up of private debt, the likelihood of a financial crisis is higher and financial recessions are more costly and prolonged than normal recessions.”

Looking at the country specific material, the IMF warns about debt in China. “If the corporate debt problem in China is left unaddressed it will have significant consequences in China and increases the risks of a hard landing”.

Australia also gets a specific mention with a focus on the rise of private sector debt alongside Canada and Singapore

The IMF has suggested that government guarantees and tax incentives like negative gearing, especially those introduced to firewall banks during the global financial crisis, should be reviewed.

They also warn that “Financial institutions in advanced economies face a
number of cyclical and structural challenges and need to adapt to this new era of low growth and low interest rates, as well as to an evolving market and regulatory environment. These are significant challenges that affect
large parts of the financial system, and if unaddressed could undermine financial soundness”.

“Over 25 percent of banks in advanced economies (about $11.7 trillion in assets) would remain weak and face significant structural challenges. More deep-rooted reforms and systemic management are needed,
especially for European banks. Japanese banks also face significant business model challenges. These banks are expanding abroad to offset thin margins and weak domestic demand, but this exposes them to greater dollar funding risks. A disruption of dollar funding sources could force Japanese banks to curtail their offshore lending and investment”.

Not Pretty.


BIS, FSB and IMF publish elements of effective macroprudential policies

The International Monetary Fund (IMF), Financial Stability Board (FSB) and Bank for International Settlements (BIS) released today a new publication on Elements of effective macroprudential policies. The document, which responds to a G20 request, takes stock of the international experience since the financial crisis in developing and implementing macroprudential policies and will be presented to the G20 Leaders’ Summit in Hangzhou.

Money-Puzzle-Pic

Following the global financial crisis, many countries have introduced frameworks and tools aimed at limiting systemic risks that could otherwise disrupt the provision of financial services and damage the real economy. Such risks may build-up over time or arise from close linkages and the distribution of risk within the financial system.

Experience with macroprudential policy is growing, complemented by an increasing body of empirical research on the effectiveness of macroprudential tools. However, since the experience does not yet span a full financial cycle, the evidence remains tentative. “The wide range of institutional arrangements and policies being adopted across countries suggest that there is no ‘one-size-fits-all’. Nonetheless, accumulated experience highlights – and this paper documents – a number of elements that have been found useful for macroprudential policy making,” the publication says. These include:

  • A clear mandate that forms the basis for assigning responsibility for taking macroprudential policy decisions.
  • Adequate institutional foundations for macroprudential policy frameworks. Many of the observed designs give the main mandate to an influential body with a broad view of the entire financial system.
  • Well-defined objectives and powers that can foster the ability and willingness to act.
  • Transparency and accountability mechanisms to establish legitimacy and create commitment to take action.
  • Measures to promote cooperation and information-sharing between domestic authorities.
  • A comprehensive framework for analysing and monitoring systemic risk as well as efforts to close information gaps.
  • A broad range of policy tools to address systemic risk over time and from across the financial system.
  • The ability to calibrate policy responses to risks, including by considering the costs and benefits, addressing any leakages, and evaluating responses. In financially integrated economies, this includes assessing potential cross-border effects.

The document includes some data on the use of macroprudential tools; illustrative examples of institutional models for macroprudential policymaking; and a brief summary of some of the empirical literature on the effectiveness of macroprudential tools.

“Usage” counts the number of countries using the various instruments that comprise each group. Assuming that once a country introduces an instrument, it continues using it, the charts show usage of the various groups of instruments.

MacroPruCountsInstitutional arrangements adopted by a country are shaped by country-specific circumstances, such as political and legal traditions, as well as prior choices on the regulatory architecture. While there can therefore be no “one size fits all” approach, in practice, there has been an increasing prevalence of models that assign the main macroprudential mandate to a well-identified authority, committee, or interagency body, generally with an important role of the central bank. While each of these models has pros and cons, any one model can be buttressed with additional safeguards and mechanisms.

  • Model 1: The main macroprudential mandate is assigned to the central bank, with its Board or Governor making macroprudential decisions (as in the Czech Republic, Ireland, New Zealand and Singapore). This model is the prevalent choice where the central bank already concentrates the relevant regulatory and supervisory powers. Where regulatory and supervisory authorities are established outside the central bank, the assignment of the mandate to the central bank can be complemented by coordination mechanisms, such as a committee chaired by the central bank (as in Estonia and Portugal), information sharing agreements, or explicit powers assigned to the central bank to make recommendations to other bodies (as in Norway and Switzerland).
  • Model 2: The main macroprudential mandate is assigned to a dedicated committee within the central bank structure (as in Malaysia and the UK). This setup creates dedicated objectives and decision-making structures for monetary and macroprudential policy where both policy functions are under the roof of the central bank, and can help counter the potential risks of dual mandates for the central bank (see further IMF 2013a). It also allows for separate regulatory and supervisory authorities and external experts to participate in the decision-making committee. This can foster an open discussion of trade-offs that brings to bear a range of perspectives and helps discipline the powers assigned to the central bank.
  • Model 3: The main macroprudential mandate is assigned to an interagency committee outside the central bank, in order to coordinate policy action and facilitate information sharing and discussion of system-wide risk, with the central bank participating on the committee (as in France, Germany, Mexico, and the US). This model can accommodate a stronger role of the Ministry of Finance (MoF). Participation of the MoF can be useful to create political legitimacy and enable decision makers to consider policy choices in other fields, e.g. when cooperation of the fiscal authority is needed to mitigate systemic risk.

IMF On China

The Executive Board of the International Monetary Fund (IMF) concluded the Article IV consultation with China.

China-Pic

China continues its transition to sustainable growth, with progress on many fronts yet also many challenges. Growth slowed to 6.9 percent in 2015 and is projected to moderate to 6.6 percent this year owing to slower private investment and weak external demand. The economy is advancing on many dimensions of rebalancing, particularly switching from industry to services and from investment to consumption. But other aspects are lagging, such as strengthening SOE and financial governance and containing rapid credit growth.

Inflation dipped below 1.5 percent in 2015 and is expected to pick up to around 2 percent this year, reflecting the rebound in commodity prices and the exchange rate depreciation since mid-2015.

Infrastructure spending picked up and credit growth accelerated in the second half of 2015. Accommodative macro policies are projected to continue supporting activity over the remainder of 2016.

The current account surplus is projected to decline to 2.5 percent of GDP this year (from 3 percent of GDP in 2015) as imports increase and the services deficit widens with continued outbound tourism. The balance of payments came under pressure in 2015 due to large capital outflows, mainly related to repayment of external debt. The volume of outflows is expected to moderate this year. After appreciating 10 percent in real effective terms through mid-2015, the renminbi has depreciated some 4.5 percent since then and remains broadly in line with fundamentals.

Executive Board Assessment

Executive Directors commended the Chinese authorities for their strong determination to achieve more balanced, sustainable growth. They noted that economic growth continues to moderate and is driven increasingly by services and consumption. Directors welcomed the impressive progress on structural reforms in many areas, notably interest rate liberalization, internationalization of the renminbi, and urbanization. They also welcomed the 13th Five‑Year Plan, with its ambitious goals centered on economic rebalancing.

Directors noted that China’s economic transition will continue to be complex, challenging, and potentially bumpy, against the backdrop of heightened downside risks and eroding buffers. They stressed the need for decisive action to tackle rising vulnerabilities; reduce the reliance on credit‑financed, state‑led investment; and improve governance, risk pricing, and resource allocation in the state‑owned enterprise (SOE) and financial sectors. Directors emphasized that consistent, well‑coordinated, and clearly‑communicated policies are key to a smooth, successful transition, which will eventually benefit the global economy.

Directors highlighted the urgency of addressing the corporate debt problem through a comprehensive approach. They encouraged the authorities to harden budget constraints on SOEs; triage and restructure or liquidate over‑indebted firms; and recognize losses and share them among relevant parties, including the government if necessary. Piloting a few SOEs would make a strong start to the process. Directors recommended that the authorities complement these measures with targeted social assistance for displaced workers, and initiatives to facilitate entry of new, dynamic private firms.

Directors concurred that macroeconomic policies should be geared at lowering vulnerabilities, which would likely entail somewhat slower growth in the short term. They welcomed the authorities’ intention to rely on fiscal support if growth falls sharply in the near term. To this end, they saw merit in using on‑budget, pro‑consumption measures, which would help promote internal and external rebalancing. Measures could include raising pensions; increasing social, education and health spending; providing restructuring funds; and cutting minimum social security contributions. Continued efforts are also needed to ensure full implementation of the new budget law, improve fiscal transparency, and modernize the tax system.

Directors underscored the importance of further enhancing financial stability. Priorities include encouraging banks to proactively recognize loan losses and strengthen capital ratios; enhancing supervisory focus on liquidity risk management and funding stability risks; and addressing vulnerabilities in shadow products. Directors also recommended a major upgrade of the supervisory framework to foster cross‑agency information sharing and policy coordination, reduce the scope for regulatory arbitrage, and enhance crisis management capabilities. They looked forward to the forthcoming Financial Sector Assessment Program Update.

Directors noted the staff’s assessment that the renminbi is broadly in line with fundamentals, although the external position in 2015 was moderately stronger than consistent with fundamentals. They welcomed steps toward an effectively floating exchange rate regime and encouraged the authorities to build on this progress while carefully managing the transition, and with the support of a more market‑based monetary framework. Directors supported a cautious approach to capital account liberalization that is carefully sequenced with the progress on exchange rate flexibility and financial sector reforms.

Directors encouraged the authorities to continue to improve data quality and policy communications, which would help reduce uncertainty, align expectations, and guard against market turbulence.

What Is The Key To Curing Endemic Deflation?

Given the RBA rate cut, concerns about poor growth, flat-lining income, structural deficits and little business investment, it is worth thinking about unconventional policies to turn the economy round. Just cutting rates does not deliver. What is needed is a longer term, properly developed structural plan.

KeysSo, a timely working paper from the IMF is worth reading. Relating Japan: Time to Get Unconventional? discusses such an approach.

Since the bubble burst in the early 1990s, Japan has experienced deficient nominal and real GDP growth and repeated deflationary episodes. Monetary policy has been unable to get the economy out of the liquidity trap, given the Effective Lower Bound (ELB) on monetary policy rates. These factors together with repeated fiscal stimulus have led to rapid increases in the public debt to GDP ratio. Public gross debt to GDP has reached levels without precedent in peace time.

Slow wage-price dynamics amount to a missing link in the transmission of rising corporate earnings to inflation (actual and expected). Wage setting tends to be backward looking, based on recent actual inflation rather than the 2 percent target of monetary policy. Without strong efforts to resolve this market coordination blockage, attempts to raise nominal GDP growth will remain elusive.

The paper argues for a comprehensive policy package to get the Japanese economy to a higher sustainable growth path and end deflation. They call it Three Arrows “Plus”.

Prime Minister Abe’s administration came to power in December 2012 to end this economic malaise with a policy package (the so-called Abenomics) consisting of three arrows: bold monetary policy, flexible fiscal policy, and a growth strategy that promotes private investment. The objective was to jolt the economy to higher sustainable growth, positive inflation, and, through flexible policy, public debt sustainability.

First monetary policy in Japan needs to be cast in a credible and transparent framework that is able to anchor inflation expectations over the medium term. We recommend that the BoJ moves to an inflation-forecast-targeting (IFT) framework, where monetary policy responds to deviations of the inflation forecast from the 2 percent target.

Second, Japan’s fiscal policy would benefit from a transparent framework to manage public sector balance sheet risks over the long term, while maintaining the flexibility to support monetary policy as appropriate. The challenge for fiscal policy is to preserve debt sustainability, given the large debt burden. This ultimately depends on exiting deflation, and thereby reducing long-term real interest rates as well as increasing growth. This requires a skillful fiscal policy mix that supports BoJ inflation targeting through higher public wages and transfers, while increasing VAT rates in small steps over a very extended time period to bring debt on a sustainable path. The advantage of committing to a path of small, rather than less frequent, larger-step, consumption tax hikes would be to avoid the volatility and uncertainty from large intertemporal substitution effects, and to minimize the ultimately negative effects on spending.

Third, to implement structural policies to reduce labor market duality, increase the labor force through foreign workers, and boost potential output. Essential to higher long-term growth is a set of structural reforms that reverses the trend in product offshoring and makes Japan an attractive place to invest again by raising future demand expectations.

Plus, the new arrow of the proposed policy package is an incomes policy for Japan to put an end to low wage growth and induce inflation (through cost-push pressures) to move in line with the BoJ target. It would build on recent measures taken by the authorities, including tax incentives for firms that raise wages, higher minimum wage increases, and moral suasion to encourage wage growth. This would be done through the wage policy of the public sector (see fiscal policy section above) and a “comply or explain” policy for the private sector. The “comply or explain” policy would be similar to the regulatory approach used in Japan, Germany, the Netherlands, and the UK in the field of corporate governance and financial supervision. The government would announce a wage inflation guideline, which companies would then either need to comply with, or explain publicly why they cannot. The wage inflation target would not be a binding law as the purpose of this policy is to reject a “one-size fits all” policy, given differences in productivity and relative prices across the economy. It should be noted that the objective of the incomes policy is not to induce changes in relative prices, higher real wages, or a reduction in competiveness but rather to move all nominal variables in line with the BoJ’s inflation target.

The U.S. incomes policy during the Great Depression was effective in ending deflation. As part of the New Deal, President Roosevelt established the National Recovery Administration (NRA) in early 1933 to help combat deflation. It established collective bargaining rights, a system of codes to set minimum wages, and to allow collusive pricing. By 1935, over half of all employees were covered by NRA codes (Lyon and others, 1935). Other anti-deflationary policies included an exit from the Gold Standard, and a large fiscal stimulus under the Public Works Administration. The US Supreme Court struck down the NRA codes as unconstitutional in 1935. The results of the NRA are difficult to evaluate, amidst all the other developments, but under the program deflation did end, and industrial production rebounded, with a 55 percent expansion, 1933–35

IMF-orkingGenerating wage-push inflation is not without risks and success is not guaranteed. For example, firms might increase hiring of non-regular workers, if there are timing and coordination problems, if “comply-or-explain” policies do not deliver sufficient compliance, or if there is the perception by firms or households that policies can be reversed. Possible declines in competitiveness and profitability—especially for labor intensive SMEs and export-oriented companies— could have an adverse impact on employment and growth in the near term. Finally, proposals to increase public wages are likely to encounter political resistance in light of ongoing fiscal consolidation plans.

Since it reinforces the three arrows of Abenomics, we call it Three Arrows Plus. An unorthodox component of the package is an incomes policy aimed directly at sluggish wage-price dynamics. We build on the authorities’ current policies by emphasizing the need for more credible and transparent monetary and fiscal frameworks that reinforce each other to reduce policy uncertainty and raise policy effectiveness. We emphasize structural reforms to end labor market duality, raise female participation, increase the labor force through foreign workers, and reform certain sectors of the economy. Although their short-term effects are uncertain, over time such reforms would raise the growth rate of potential output. The Three-Arrows-Plus package (monetary, fiscal, structural, and incomes policies) is coordinated to exploit synergies, and have the maximum chance of success.

Note: IMF Working Papers describe research in progress by the author(s) and are published to elicit comments and to encourage debate. The views expressed in IMF Working Papers are those of the author(s) and do not necessarily represent the views of the IMF, its Executive Board, or IMF management.


Global Home Prices, On Average Back to 2007 Levels

The latest data from the IMF Global Housing Watch says shows that, on average, prices are almost back up to where they were at the start of 2007. That said Australia and a number of other countries have had much stronger growth over this period.

IMF-GP-JulyThere is a fair bit of cross-country variation, however. While house prices have increased over the past year in most countries in the sample, the pace of increase varies quite a bit. And there are still a dozen or so countries where house prices have fallen over the past year, including Brazil, China and Russia.

IMF-GP-July1 Both real house prices and real GDP growth in the 2007-2015 period were well below the boom experienced during 2000-2006. In the earlier period, global real GDP grew by over 4% per year while real house prices surged by about 9% on average. In the more recent period, these grew by just 2% and 1% per year, respectively. The simple correlation between real growth in house prices and GDP growth was very similar in the two periods at about 0.6.

The pace of credit creation also fell sharply between the pre- and post-crisis periods from 17% to 6%. The correlation between growth in house prices and credit expansion fell substantially from 0.8 to 0.3. Given that many countries sharply eased monetary policy during the post-crisis period, it seems reasonable to posit that slow credit growth was a result of diminished investment opportunities, reduced risk appetites on the part of lenders, and the adoption of macroprudential policies designed to reduce the probability of boom/bust cycles in the future. Moreover, the decline in the correlation between house prices and credit expansion suggests that other country-specific factors may have played a role in determining house prices.

One such factor is fiscal policy. We use as our indicator the change in the cyclically-adjusted primary fiscal balance as a percentage of GDP during each sub-period. The correlation between the change in the policy stance and home prices went from nearly zero to almost -0.5, suggesting that country-specific policy developments have played a role in determining the development of real estate prices.

Over the last quarter, there have been discussions of housing sector developments in IMF staff reports in over a dozen cases. One feature of the discussions has been a growing emphasis on the role of supply constraints in driving house price increases—this was flagged for instance in the case of Denmark and Germany. Another is the continued active use of macroprudential policies in several countries, among them Canada and the United Arab Emirates. Concerns about the extent of house price growth were flagged in the cases of the Czech Republic (“a strong housing market is becoming a potential source of risk”), Denmark (“rapid house price increases call for early policy action”) and Norway (“high and rising house prices and household debt in Norway pose important macro-financial stability risks”).