The Case For “Inclusive Growth”

From the IMF Blog.

Four years ago, at the World Economic Forum in Davos, IMF Managing Director Christine Lagarde warned of the dangers of rising inequality, a topic that has now risen to the very top of the global policy agenda.

While the IMF’s work on inequality has attracted the most attention, it is one of several new areas into which the institution has branched out in recent years. A unifying framework for all this work can be summarized in two words: Inclusive growth

We want growth, but we also want to make sure:

  • that people have jobs—this is the basis for people to feel included in society and to have a sense of dignity;
  • that women and men have equal opportunities to participate in the economy—hence our focus on gender;
  • that the poor and the middle class share in the prosperity of a country—hence the work on inequality and shared prosperity;
  • that, as happens, for instance when countries discover natural resources, wealth is not captured by a few—this is why we worry about corruption and governance;
  • that there is financial inclusion—which makes a difference in investment, food security and health outcomes; and
  • that growth is shared just not among this generation but with future generations—hence our work on building resilience to climate change and natural disasters.

In short, a common thread through all our initiatives is that they seek to promote inclusion—an opportunity for everyone to make a better life for themselves.

These are not just fancy words; a click on any of the links above shows how the IMF is making work on inclusion a part of its daily operations.

Inclusion is important, but so of course is growth. “A larger slice of the pie for everyone calls for a bigger pie” (Lipton, 2016). So when we push for inclusive growth, we are not advocating as role models either the former Soviet Union or present day North Korea—those are examples of ‘inclusive misery,’ not inclusive growth. Understanding the sources of productivity and long-run growth—and the structural policies needed to deliver growth—thus remains an important part of the IMF’s agenda.

Globalization and inclusion

The IMF was set up to foster international cooperation. Hence, to us, inclusion refers not just to the sharing of prosperity within a country, but to the sharing of prosperity among all the countries of the world. International trade, capital flows, and migration are the channels through which this can come about. This is why we stand firmly in favor of globalization, while recognizing that there is discontent with some of its effects and that much more could be done to share the prosperity it generates.

Higher growth should help address some of the discontent, as argued by Harvard economist Benjamin Friedman in his book, The Moral Consequences of Economic Growth. Friedman shows that, over the long sweep of history, strong growth by “the broad bulk” of a society’s citizens is associated with greater tolerance in attitudes towards immigrants, better provision for the disadvantaged in society, and strengthening of democratic institutions.

However, designing policies so they deliver inclusive growth in the first place will be a more durable response than leaving matters to the trickle-down effects of growth.

Policies for inclusive growth

♦  Trampolines and safety nets: “More inclusive economic growth demands policies that address the needs of those who lose out … Otherwise our political problems will only deepen” (Lipton, 2016). Trampoline policies such as job counseling and retraining allow workers to bounce back from job loss: they help people adjust faster when economic shocks occur, reduce long unemployment spells and hence keep the skills of workers from depreciating. While such programs which already exist in many advanced economies, they deserve further study so that all can benefit from best practice. Safety net programs have a role to play too. Governments can offer wage insurance for workers displaced into lower-paying jobs and offer employers wage subsidies for hiring displaced workers. Programs such as the U.S. earned income tax credit should be extended to further narrow income gaps while encouraging people to work (Obstfeld, 2016).

♦  Broader sharing of the benefits of the financial sector and financial globalization: We need “a financial system that is both more ethical and oriented more to the needs of the real economy—a financial system that serves society and not the other way round” (Lagarde, 2015). Policies that broaden access to finance for the poor and middle class are needed to help them garner the benefits of foreign flows of capital. Increased capital mobility across borders has often fueled international tax competition and deprived governments of revenues (a “race to the bottom leaves everyone at the bottom,” (Lagarde, 2014). The lower revenue makes it harder for governments to finance trampoline policies and safety nets without inordinately high taxes on labor or regressive consumption taxes. Hence, we need international coordination against tax avoidance to prevent the bulk of globalization gains from accruing disproportionately to capital (Obstfeld, 2016).

♦  ‘Pre-distribution’ and redistribution: Over the long haul, polices that improve access to good education and health care for all classes of society are needed to provide better equality of opportunity. However, this is neither very easy nor an overnight fix. Hence, in the short run, ‘pre-distribution’ policies need to be complemented by redistribution: “more progressive tax and transfer policies must play a role in spreading globalization’s economic benefits more broadly” (Obstfeld, 2016).

Are Small Business Bearing Some Of The Bank’s Interest Rate Risk?

An interesting working paper from the IMF was released today. Why Do Bank-Dependent Firms Bear Interest-Rate Risk? looks at the link between bank funding, floating rates and how this is transmitted to firms who borrow on variable rate terms. The paper concludes that banks do indeed transfer interest rate risks to firms, and this is especially so when banking regulation tightens.

Here is the summary:

I document that floating-rate loans from banks (particularly important for bank-dependent firms) drive most variation in firms’ exposure to interest rates. I argue that banks lend to firms at floating rates because they themselves have floating-rate liabilities, supporting this with three key findings. Banks with more floating-rate liabilities, first, make more floating-rate loans, second, hold more floating-rate securities, and third, quote lower prices for floating-rate loans. My results establish an important link between intermediaries’ funding structure and the types of contracts used by non-financial firms. They also highlight a role for banks in the balance-sheet channel of monetary policy.

Here is the full conclusion from the report:

Bank lending is in large part funded with floating-rate deposits. As hedging is costly, banks avoid mismatch with the interest-rate exposure of their liabilities, in part, by making floating-rate loans to firms. To establish this link between the structure of bank liabilities and the floating-rate nature of bank lending, I examine the cross section of banks. Banks with greater interest rate pass-through on their deposits hold more floating-rate assets: both loans and securities. In the cross section, these floating fractions are positively correlated with each other. I show that if banks were responding to demand for floating-rate debt from firms instead of their own liabilities, this correlation would be negative.

Moreover, while banks with more deposit pass-through hold more floating-rate loans, they quote lower interest rates for ARMs relative to FRMs. The combination of higher quantities and lower prices points to variation in supply rather than demand. I also present time series and historical evidence supporting the supply-driven view of floating-rate bank lending to firms.

This paper therefore highlights an important consequence of banks’ short-term funding: the potential for interest-rate mismatch. While standard models do analyze maturity mismatch created by short-term funding, they typically do not consider uncertainty in interest rates and interest-rate mismatch.

This paper shows that the structure of banks’ funding has important implications for the choices banks make about interest-rate risk on the asset side of their balance sheets. More broadly, my results establish an important link between intermediaries’ funding structure and the types of contracts used by non-financial firms. My results suggest that tighter regulation of banks’ exposure to interest rates might lead banks to pass on more risk to firms, which is particularly relevant given renewed regulatory focus on banks’ exposure to rates.

Bank-dependent firms, i.e. poorly rated firms and smaller firms, are more exposed to interest rates than firms with better access to capital markets. While these firms do use interest-rate derivatives to hedge this exposure, they do so only partially. I show that this exposure is a component of the Bernanke & Gertler (1995) balance-sheet channel of transmission of monetary policy. Banks therefore play a role in the transmission of monetary policy to firms beyond the usual bank lending channel; here the effect is based on existing rather than new bank lending.

Note: IMF Working Papers describe research in progress by the author(s) and are published to elicit comments and to encourage debate. The views expressed in IMF Working Papers are those of the author(s) and do not necessarily represent the views of the IMF, its Executive Board, or IMF management.

The Global Economic Landscape Has Started Has to Shift

From iMFDirect.

Today we released our update to the World Economic Outlook.

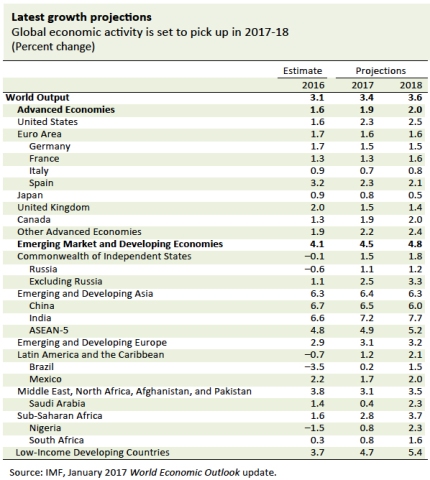
An accumulation of recent data suggests that the global economic landscape started to shift in the second half of 2016. Developments since last summer indicate somewhat greater growth momentum coming into the new year in a number of important economies. Our earlier projection, that world growth will pick up from last year’s lackluster pace in 2017 and 2018, therefore looks increasingly likely to be realized. At the same time, we see a wider dispersion of risks to this short-term forecast, with those risks still tilted to the downside. Uncertainty has risen. 

weo_table

Our central projection is that global growth will rise to a rate of 3.4 percent in 2017 and 3.6 percent in 2018, from a 2016 rate of 3.1 percent. Much of the better growth performance we expect this year and next stems from improvements in some large emerging market and low income economies that in 2016 were exceptionally stressed. That being said, compared to our view in October, we now think that more of the lift will come from better prospects in the United States, China, Europe, and Japan.

A faster pace of expansion would be especially welcome this year: global growth in 2016 was the weakest since 2008–09, owing to a challenging first half marked initially by turmoil in world financial markets. General improvement got under way around mid-year. For example, broad indicators of manufacturing activity in emerging and advanced economies have been in expansionary territory and rising since early summer. In many countries, previous downward pressures on headline inflation weakened, in part owing to firming commodity prices.

A significant repricing of assets followed the U.S. presidential election. Its most notable elements were a sharp increase in U.S. longer-term interest rates, equity market appreciation and higher long-term inflation expectations in advanced economies, and sharp movements in opposite directions of the dollar—up—and the yen—down. At the same time, emerging market equity markets broadly retreated as currencies weakened.

Of course, asset markets adjust not just to unexpected current events, but to shifting expectations of future events. Most commentators have interpreted the post-election moves as predicting that U.S. fiscal policy will turn more expansionary and require a swifter pace of interest rate increases by the Federal Reserve. Markets have noted that the White House and Congress are in the hands of the same party for the first time in six years, and that change points to lower tax rates and possibly higher infrastructure and defense spending.

In light of the U.S. economy’s momentum coming into 2017, and the likely shift in policy mix, we have moderately raised our two-year projections for U.S. growth. At this early stage, however, the specifics of future fiscal legislation remain unclear, as do the degree of net increase in government spending and the resulting impacts on aggregate demand, potential output, the Federal deficit, and the dollar.

There is thus a wider than usual range of upside and downside risks to this forecast. A sustained non-inflationary growth increase, marked by higher labor force participation and significant expansion of the U.S. capital stock and infrastructure, would allow a more moderate pace of interest rate increases in line with the Federal Reserve’s price stability mandate.

On the downside, if a fiscally-driven demand increase collides with more rigid capacity constraints, a steeper path for interest rates will be necessary to contain inflation, the dollar will appreciate sharply, real growth will be lower, budget pressure will increase, and the U.S. current account deficit will widen.

This last scenario, one with a widening of global imbalances, intensifies the risk of protectionist measures and retaliatory responses. It would also imply a faster than expected tightening of global financial conditions, with resulting possible stress on many emerging market and some low-income economies. Some emerging and especially low-income commodity exporters could benefit from higher export prices, but importers would then lose. The details of the U.S. policy mix matter; and as these become clearer, we will adjust our forecast and spillover assessment.

Among emerging economies, China remains a major driver of world economic developments. Our China growth upgrade for 2017 is a key factor underpinning the coming year’s expected faster global recovery. This change reflects an expectation of continuing policy support; but a sharp or disruptive slowdown in the future remains a risk given continuing rapid credit expansion, impaired corporate debts, and persistent government support for inefficient state-owned firms.

At the global level, other vulnerabilities include higher popular antipathy toward trade, immigration, and multilateral engagement in the United States and Europe; widespread high levels of public and private debt; ongoing climate change—which especially affects low-income countries; and, in a number of advanced countries, continuing slow growth and deflationary pressures. In Europe, Britain’s terms of exit from the European Union remain unsettled and the upcoming national electoral calendar is crowded, with possibilities of adverse economic repercussions, in the short and longer terms.

We continue to recommend a three-pronged policy approach relying on fiscal and structural policies alongside monetary policy, but one that is tailored to country circumstances.

Some advanced economies are now operating at close to full capacity, for example, Germany and the United States. In these, fiscal policy should focus, not on short-term demand support, but on increasing potential output through investments in needed infrastructure and skills, as well as supply-friendly, equitable tax reform. Policymakers in these economies should also turn their attention to longer-term fiscal sustainability, while monetary policy can follow a data-dependent normalizing path.

Structural reform remains a priority everywhere in view of continuing tepid productivity growth, although in many cases appropriate fiscal support can raise the effectiveness of reforms without worsening governments’ fiscal positions.

Financial resilience is another universal priority and requires stronger financial regulatory frameworks, better focused on key problem areas. Countries can do much on their own to improve financial oversight and institutions, but not everything, and continuing multilateral financial regulatory cooperation is vital.

Social dislocation due to globalization and, even more, to technology change is a major challenge that will only intensify in the future. One result has been wider inequality and wage stagnation in many countries. Rolling back economic integration, however, would impose aggregate economic costs without reducing the need for government investment in well-trained, nimble workforces, along with policies to promote better matching of available jobs to skills.

On this Martin Luther King Jr. Day in the United States, we do well to acknowledge a key takeaway from 2016: sustainable growth must also be inclusive growth.


What the Fed Rate Rise Means for Corporate Debt in Emerging Markets

From The IMF Blog.

In December 2016, the U.S. Fed raised interest rates for the first time in a year, and said they planned more increases in 2017.  Emerging market currencies took a bit of a dive, but overall investors didn’t overreact and run for the doors with their money.  For the bigger picture, you can read IMF Chief Economist Maurice Obstfeld’s blog that outlines how the U.S. election and Fed decision will impact the global economy.

One aspect that makes emerging markets more vulnerable is their corporations are loaded down with debt in both local and foreign currency—to the tune of roughly $18 trillion—fueled in large part by low interest rates in the United States.  This debt now makes them vulnerable to the expected interest rate increases in 2017. Will firms be able to roll over their debt?

The debt balloon

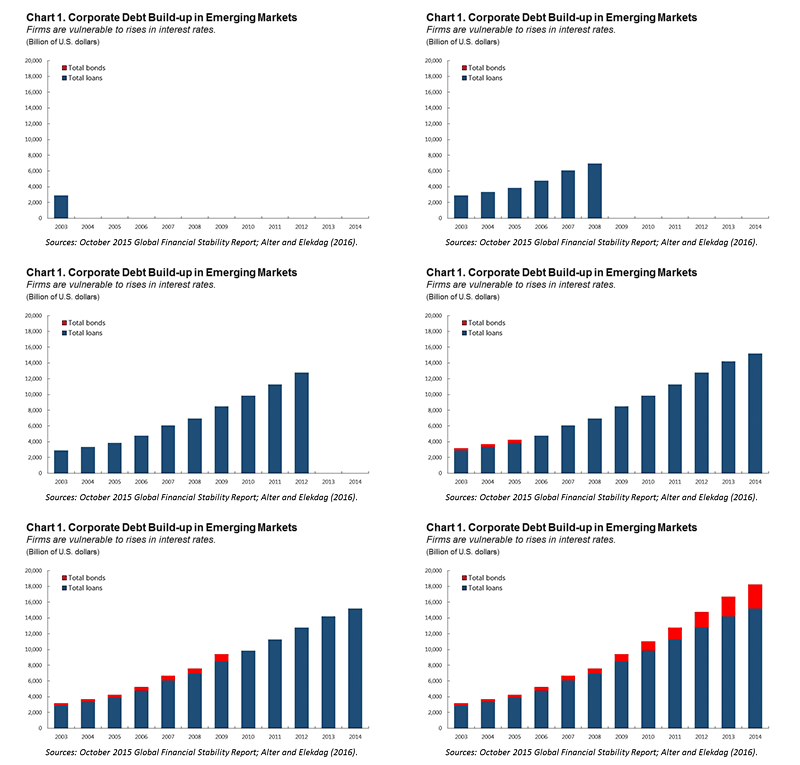
The debt of nonfinancial firms in emerging markets has quadrupled over the past decade, with bonds accounting for a growing share (Chart 1). The considerable increase in corporate debt raises concerns, given the link between the rapid build-up in leverage in emerging markets and past financial crises.

chart

Our new paper suggests that:

  • Debt accumulation was more pronounced for firms which are more dependent on external financing. Likewise, relative to other types of firms, small and medium-sized enterprises disproportionately increased their leverage.
  • The impact of U.S. monetary policy on debt growth was greater for sectors that are more heavily dependent on external funding in financially open emerging markets with relatively more rigid exchange rate regimes.
  • Global financial conditions affected emerging market firms’ growth in debt in part by relaxing corporate borrowing constraints.

Where is debt highest

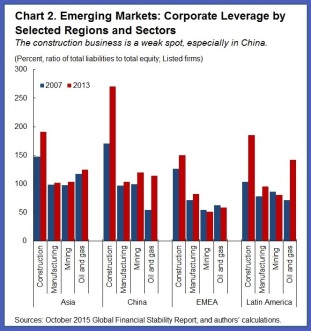
Corporate debt in emerging markets has climbed faster in more cyclical sectors, with the greatest growth seen in construction (Chart 2). The striking increase in leverage within the construction sector is most notable in China and Latin America. In addition, firms that took on more debt have, on average, also increased their foreign exchange exposures.

chart-2

Commodity Commotion

From the iMFdirect Blog.

Terms of trade is the price of a country’s exports relative to its imports. The commodity terms of trade refers to a country’s commodity exports relative to its commodity imports.

When the price of commodities, like oil, plummeted in 2015, economies that rely on exporting commodities had their terms of trade drop by an average of about 10 percent of GDP that year. Economies that rely more on importing commodities saw about a 2 percent of GDP benefit from the 2015 drop in prices.

comcommo_infographic

The decline in commodity prices may finally be leveling off, and instead of the spring 2016 World Economic Outlook projections of another 2 percent decrease in the terms of trade for commodity-exporting countries in 2016, the decline on average is estimated to have been closer to ½ percent of GDP. Although this is good news for those economies, it doesn’t do much to help recuperate the losses suffered in 2015.

The flip side is that the gains reaped by commodity-importing economies in 2015 are now looking to be short lived. The IMF estimates the benefit to these economies to have increased by less than ¼ percent in 2016: less than half the projected ½ percent anticipated in the spring 2016 World Economic Outlook projections.

A Shifting U.S. Policy Mix: Global Rewards and Risks

From The  iMFdirect Blog.

After a year marked by financial turbulence, political surprises, and unsteady growth in many parts of the world, the Fed’s decision this month to raise interest rates for just the second time in a decade is a healthy symptom that the recovery of the world’s largest economy is on track.

The Fed’s action was hardly a surprise: markets had for weeks placed a high probability on last week’s move. But market developments preceding the Fed decision did surprise many market watchers.

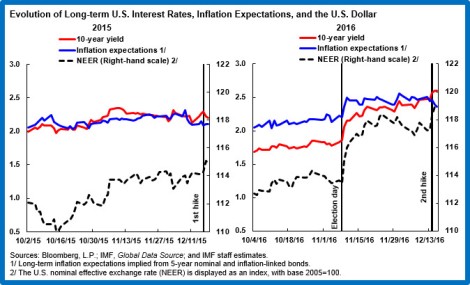
Especially striking were the sharp upward moves in longer-term U.S. interest rates, the dollar, and market-based measures of long-term inflation expectations soon after the U.S. presidential and congressional elections of November 8. No comparably abrupt market reactions preceded the Fed’s previous interest rate hike of December 2015 (see chart).

The dollar has risen further in the days following the Fed’s recent move.

usintrates-chartTime will tell if these market developments point to a new trend. Most likely, however, the election marks a shift in the U.S. policy regime with potentially even bigger future effects on prices and activity—abroad, as well as in the United States. Spillovers outside the United States will be felt especially strongly in emerging market economies, where for some, the advantages of enhanced competitiveness due to weaker currencies may be finely balanced against vulnerabilities.

Something has changed

From the start of 2016 and through the U.S. election, Treasury yields had been particularly low. Discussion of the global outlook, including at the IMF, stressed the risks of protracted low growth and continuing deflation pressures—even secular stagnation, with persistently low interest rates.

Longer-term nominal interest rates are, however, strongly influenced by expectations of the future path of the Fed’s policy rate, which in turn responds to U.S. inflation pressures and the economy’s underlying strength. Thus, the sharp post-election turnaround in longer-term U.S. interest rates changed the conversation: it likely reflected not the looming December rate hike alone, which was already widely anticipated, but also a shift in expectations about the future interest rate path and future demand in the U.S. economy.

Consistent with those expectations, while last week’s interest-rate hike was itself not unexpected, the future path of interest rates that Federal Open Market Committee members anticipate also steepened, and now suggests three interest rate hikes in each of the next two years.

The timing of the abrupt asset-price movements—coming within days of the U.S. election—is the key clue about what moved markets. The election of Donald Trump as president, coupled with continuing Republican control of the Congress, ended six years of divided U.S. government.

Implications for the future

Republicans in Congress have long advocated lower personal and corporate tax rates. President-elect Trump campaigned on a platform that included not only substantial tax cuts, but also increases in some categories of government spending, notably defense and infrastructure.

At this early stage, it is hard to know precisely how the shift in fiscal policy will look. One thing seems clear, however: it will turn more expansionary through some combination of more spending and lower tax rates.

In general, any increase in U.S. aggregate demand will generate some rise in real output—as new workers are hired, others work longer hours, and machinery is used more intensively—and some upward pressure on inflation. With the overall unemployment rate at 4.6 percent and other measures of labor market distress largely recovered from the financial crisis eight years ago, there could be little remaining slack in the U.S. economy. Unless labor force participation and overtime work rise significantly, there is a chance that inflation pressure therefore rises noticeably. This seems to be what the Fed has in mind when it predicts it will raise the federal funds rate more quickly.

More rapidly rising U.S. interest rates signal further dollar appreciation. Tax incentives for U.S. corporation to repatriate their past profits held abroad, which some estimate at $2.5 trillion, could also push the dollar up. Given faster demand growth, the outcome will be a widening U.S. current account deficit, that is, more borrowing from abroad. Some of it will possibly finance a growing Federal fiscal deficit, depending on the precise features of the U.S. fiscal package, the extent to which it is paid for by budget cuts elsewhere, the path of government borrowing rates, and the economy’s growth response.

U.S. growth will respond more strongly, with lower inflation, if any infrastructure spending is carefully designed to boost potential output, while tax measures encourage investment, labor supply, and inclusion.

International challenges ahead

Given the United States’ central role in the world economy, big changes in its policy mix have first-order effects beyond its borders.

Advanced economies with currencies that depreciate against the dollar will benefit both from higher U.S. growth and from more competitive exchange rates. For most of these economies, currently struggling with below-target inflation, any resulting inflationary pressure would (at least initially) be welcome. They may also see upward pressure on interest rates, posing a fiscal challenge for countries that are highly indebted but do not benefit enough from the positive demand spillovers that are driving their interest rates upward.

Emerging market economies can also benefit from more competitive currencies and higher U.S. demand. But although many emerging market economies have increased their policy buffers (e.g., foreign reserves), reduced currency mismatches, and improved financial oversight frameworks, some could still feel stress, especially where there are pre-existing political or economic strains.

Historically, U.S. interest rates have been one of the key drivers of net capital flows into emerging market economies. Flexible exchange rates can be helpful as a buffer against rapid outflows, as they allow international portfolios to rebalance through currency changes rather than reserve losses. A combination of rising dollar interest rates and domestic currency depreciation could reduce liquidity or worsen balance sheets, however, especially given the importance of dollar borrowing by residents and non-resident corporates in emerging market economies. Furthermore, currency depreciation might spark higher inflation. Policymakers in emerging markets therefore will remain vigilant.

If sharp exchange rate shifts and growing global imbalances follow the U.S. policy regime change, protectionist pressures become a major risk, as in past similar circumstances. Given the desire of advanced economy governments to maintain manufacturing, where emerging markets have made big inroads in recent decades, it is most likely that emerging market economies are the main targets for higher trade barriers erected by advanced economies.

Governments should therefore keep in mind that protection is likely to be counterproductive at home—even before trade partners retaliate, as they will be tempted to do. The integration of advanced economies into truly global supply chains underscores this danger. In an environment of sharply divergent policy mixes, as we may now be facing, the rules of the global trading system will be more important than ever.

Watch our recent video explaining how interest rates work:


China Must Quickly Tackle its Corporate Debt Problems

From The iMF Direct Blog.

China urgently needs to tackle its corporate-debt problem before it becomes a major drag on growth in the world’s No. 2 economy. Corporate debt has reached very high levels and continues to grow. In our recent paper, we recommend that the government act promptly to adopt a comprehensive program that would sacrifice some economic growth in the short term while rapidly returning the economy to a sustainable growth path.

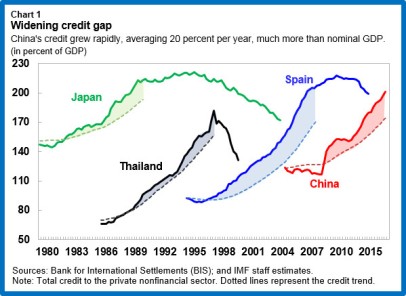
Let’s first take a look at the dimensions of the problem. From 2009 to 2015, credit grew very rapidly by 20 percent on average per year, much more than growth in nominal gross domestic product. What’s more, the ratio of non-financial private credit to GDP rose from around 150 percent to more than 200 percent, or about 20-25 percentage points higher than the historical trend. Such a “credit gap” is comparable to those in countries that experienced painful deleveraging, such as Spain, Thailand, and Japan (see Chart 1).

china-corpdebt-chartThis corporate credit boom reflected the government efforts to stimulate the economy in the wake of the global financial crisis, largely through lending for infrastructure and real estate. The outcome: overbuilding and a severe overhang of unsold properties, especially in lower-tier cities, along with excess capacity in related industries such as steel, cement and coal. The combination of heavy borrowing and falling profits led to excessive debt loads. The problem has been worst among state-owned enterprises that benefit from preferential access to financing and implicit government guarantees, which lower the cost of borrowing.

High-level decision

So what is the solution? First, the government should make a high-level decision to stop financing weak companies, strengthen corporate governance, mitigate social costs and accept likely slower growth in the near term. It needs buy-in at every level—state-owned enterprises, local governments, and financial supervisors. Here are the other steps China’s government can take:

  • Triage: Identify companies in financial difficulty and distinguish between those that should be restructured and those “zombie” companies that have no hope of survival and that should be allowed to exit. Because of the existing links between state-owned banks and corporations, a new agency could be created to perform this role.
  • Recognize losses: Require banks to recognize and manage impaired assets. So-called shadow banks—trust, securities and asset-management companies—should also be forced to recognize losses.
  • Share the burden: Allocate losses among banks, corporates, investors and, if necessary, the government.
  • Harden budget constraints—especially on state owned enterprises—by improving corporate governance and removing implicit guarantees to prevent further misallocation of credit and losses.

To make the program work and limit the short-term economic pain, other supportive measures are needed:

  • Improve the legal framework for insolvency: But large-scale and expedited restructuring also requires out-of-court mechanisms to complement the existing framework.
  • Ease the transition: Broaden unemployment insurance coverage, provide income support for displaced workers and help them find new jobs. The social safety net should be improved because closing or restructuring loss-making companies in industries such as coal and steel could result in substantial layoffs.
  • Facilitate market entry: Dismantle monopolies in services such as telecommunications and health care and foster greater competition.
  • Improve local government finance: Ensure sufficient taxing powers and revenue sources for local governments to discourage off-balance-sheet borrowing.

Risks appear manageable if the problem is addressed promptly. Indeed, it is encouraging that the government has recognized the problem and is taking action to address it. The comprehensive strategy we have outlined would allow China to reduce leverage, limit vulnerabilities, and return to a strong and sustainable growth path over the medium term.

Read our recently published working paper for more information.

Infrastructure Done Right

From The IMF Blog – iMFdirect

In the face of crumbling bridges and super-low interest rates, many countries are talking and planning to increase spending on infrastructure. And it’s not just about more spending; it’s about smart spending. This is something that the IMF has urged countries to consider for several years, starting with our Fall 2014 World Economic Outlook

Bridges, roads, and highways, along with telecoms, ports and airports are all part of the backbone that supports a country’s growth and the global economy.

Investing in building schools, public housing and hospitals, known as social infrastructure, can provide a powerful impetus for economic activity and jobs in countries. Canada and the United Kingdom have announced and begun plans to invest billions in the coming years to fix and modernize their infrastructure, sorely in need of an upgrade. The incoming U.S. Administration has also indicated its intention to increase investment in infrastructure.

For the past several years, the IMF has analyzed the data and produced new research on the benefits and best way to spend taxpayer dollars on infrastructure. With interest rates still low, the IMF research suggests that debt-financed investment could virtually pay for itself by boosting demand in the short run and productivity in the long run. But that comes with a caveat: the quality of investment matters. So countries should invest well, where there is a clear need, and invest efficiently.

Two weeks ago, IMF Deputy Managing Director Tao Zhang gave a speech about how countries can meet the growing needs, and challenges, of investing in public infrastructure.

Why Productivity Growth is Faltering in Aging Europe and Japan

From The IMF Blog.

Many countries are experiencing a combination of declining birth rates and increasing longevity. In other words, their populations are aging. And graying populations pose serious issues for people, policymakers, and society. 

Health care costs rise, mainly because older people need more of it. Pension payments—whether from public or private plans—also increase at the same time there are relatively fewer younger workers paying into the pension systems. And there are also fewer people producing goods and services relative to the total population. The old-age dependency ratio—the number of people over 65 divided by the number of people between 15 and 64—rises. In other words, there are economic strains and many countries that haven’t faced them yet will soon.

One way to alleviate those strains would be to increase the amount of goods and services each worker produces—that is to boost productivity. Productivity is a major driver of economic growth. When it is rising, more goods and services are produced from the same amount of input—giving society more output to divvy up. When productivity is falling, GDP growth is retarded.

How aging affects productivity

But two recent papers by IMF economists suggest that there are limited prospects for productivity to come to the rescue. That’s because not only is the overall population aging, so are those still in the workforce. And the aging workforce is holding down productivity growth in both Europe and Japan.

The decline in productivity in Japan and Europe manifested itself in what economists call Total Factor Productivity, which is the portion of economic growth that is not the result of changes in inputs (such as capital and labor). Total factor productivity measures how efficiently capital and labor are used in the production process and is affected by such things as innovation, institutions and the quality of the workforce.

Productivity generally increases until workers are in their 40s, then tails off until they stop working. In Japan, for example, workers in the 40 to 49 age group were the most productive, with productivity declining after that. Authors Yihan Liu and Niklas Westelius calculated that the aging workforce could have reduced Japan’s annual total factor productivity growth by as much as 0.7–0.9 percentage points between 1990 and 2005. The decline was largely due to the reduction in the 40 to 49 age group. Starting in 2010, the 40 to 49 group increased a bit, but after 2025 shifts in the working age population age will again reduce total factor productivity growth.

The story is similar for 28 countries in Europe. Authors Shekhar Aiyar, Christian Ebeke, and Xiabo Shao found that the growing number of workers aged 55 and older on average “lowered total factor productivity growth by about 0.1 percentage points each year over the past two decades.” But that varied across countries. In Latvia, Lithuania, Finland, the Netherlands, and Germany, workforce aging shaved about 0.2 percentage points off annual total factor productivity growth.

Future could be worse

Under current demographic projections, the future will be worse. From 2014 to 2045 workforce aging will intensify in Europe and could reduce annual total factor productivity growth by 0.2 percentage points. But in countries where aging will be most pronounced—Greece, Hungary, Ireland, Italy, Portugal, Slovakia, Slovenia, and Spain—annual total factor productivity growth could be reduced by as much as 0.6 percentage points.

Aiyar, Ebeke, and Shao write that some of the effects of total factor productivity erosion from workforce aging might be offset in Europe by such policies as:

  • Broadening access to medical services to improve the overall population health;
  • Improving workforce training;
  • Reforming labor markets to make it easier for older workers to change jobs; and
  • Promoting technological innovation to improve overall productivity—among other things, through increased spending on research and development. To the extent that such changes (for example, devices that reduce physical labor associated with manufacturing) disproportionately benefit senior workers, they could mitigate the adverse effects of an aging workforce on total factor productivity growth.

Global House Prices: Time to Worry Again?

From The IMF Blog.

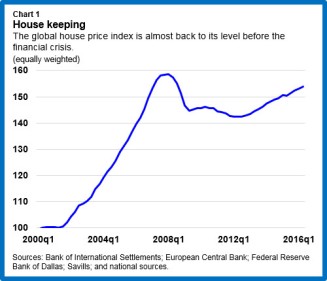
During 2007-08, house prices in several countries collapsed, marking the onset of a global financial crisis. The IMF’s Global House Price Index, a simple average of real house prices for 57 countries, is now almost back to its level before the crisis (Chart 1). Is it time to worry again about a global fall in house prices? 

res-globalhouseprices-chart1

The classic study of financial crises by Carmen Reinhart and Ken Rogoff has taught us the folly of claiming “this time is different.” Still, there are several reasons to think that the present conjuncture is a time for vigilance but not panic.

  • First, unlike the boom of the 2000s, the current boom in house prices is not synchronized across countries. And within countries, the boom is often restricted to one or a few cities. In many cases, the booms are not being driven by strong credit growth: some house price increases, particularly at the city level, are due to supply constraints.

Lack of synchronicity

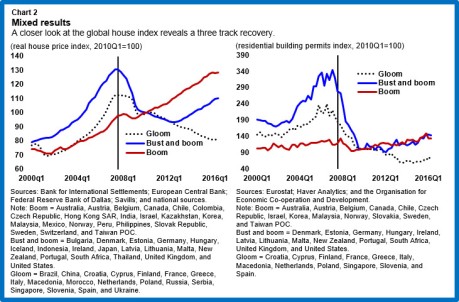
A closer look at the global index reveals three clusters of countries (Chart 2, left panel).

  • The first cluster—gloom—consists of 18 economies in which house prices fell substantially during the global financial crisis and have remained on a downward path.
  • The second—bust and boom—consists of 18 economies in which housing markets have rebounded since 2013 after falling sharply during 2007-12.
  • The third—boom—comprises 21 economies in which the drop in house prices in 2007–12 was quite modest and was followed by a quick rebound.

Not only are there differences across countries, but the situation differs within countries. China offers a good example. While land prices overall have kept up a steady upward march, this masks tremendous variation at the city level. Beijing has “experienced one of the greatest booms ever seen in housing markets,” according to Joe Gyourko, an expert at the University of Pennsylvania. With his co-authors, Gyourko has constructed a residential land price index for 35 large cities in China based on government sales of land to private developers. These data show that prices have increased in inflation-adjusted terms by about 80 percent a year in Beijing over the past decade but by only 10 percent a year in Xian. Whether this pattern of price increases will continue depends on the balance between supply and demand, which varies across cities as well. Some other examples are those of Amsterdam, Oslo, and Vienna, where house prices are rising far more than the national averages.

res-globalhouseprices-chart2

Supply constraints

Many of the past housing booms were driven by excessive credit growth. But this time supply constraints appear to be playing a big role in driving some of the price booms. Residential permits have grown only modestly in the “boom” and “bust and boom” country clusters (Chart 2, right panel). The impact of supply constraints is evident in the case of many of cities. In Copenhagen and Stockholm, the increase in the housing stock has not kept up with population growth, feeding some of the price increase observed there. In recent years, the IMF has also flagged the role of supply constraints in some cities in Australia and Canada, as well as in many European countries—France, Germany, the Netherlands, Norway, and the United Kingdom.

Increased vigilance

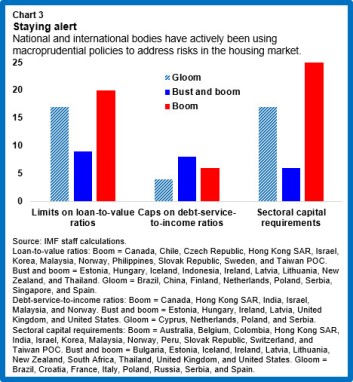
Another difference from the pre-crisis period is that national and international regulators are being more vigilant about monitoring house price booms and using macroprudential policies to tame them. The use of such policies has been quite extensive in the period since the crisis, particularly in the “gloom” and “boom” clusters (Chart 3).

res-globalhouseprices-chart3

The IMF has been urging macroprudential measures, alongside measures to boost supply, in many countries including Australia, Canada, and several European countries. This is because, even if house price increases are due to supply constraints, their impact of household indebtedness could have adverse implications for financial stability.

Just last week, the European Systemic Risk Board published a set of country-specific warnings on medium-term vulnerabilities in the residential sector for eight member states: Austria, Belgium, Denmark, Finland, Luxembourg, the Netherlands, Sweden, and the United Kingdom. This provides a good example of the kind of vigilance that will be needed to keep the past from again becoming prologue.