An increase in the number of Australian “owner-occupier” home buyers who are taking out interest-only (IO) mortgages is credit negative for future Australian Residential Mortgage Backed Securities (RMBS) because such loans have a higher risk of delinquency and default, particularly if interest rates rise from their current record low levels.
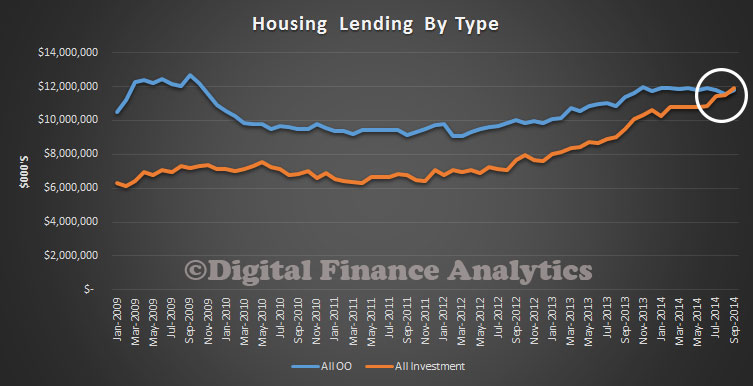
Over the past year, a notable rise has occurred in the amount of IO loans in Australia and owner-occupiers – people who buy a home to live in, as opposed to investors who buy to rent out — are accounting for a growing share of these loans.
IO loans are common among real estate investors in Australia because interest costs on investment loans can be claimed as a tax deduction. However, owner-occupiers cannot claim such deductions. There are concerns that many of the owner-occupiers taking out these loans — which are generally larger than the traditional Principal and Interest (PI) loans — would consequently find it difficult to service them if interest rates start to rise.
Greater Delinquency Risk as Owner-Occupier Interest Only Loans Grow
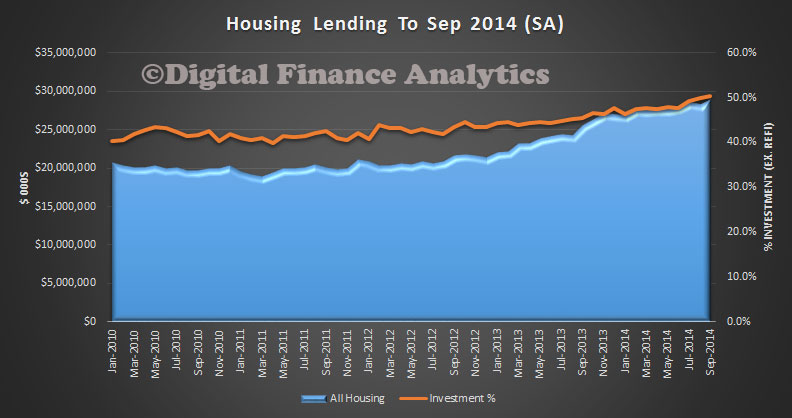
IO loans accounted for 43.2% of all new mortgages in June 2014, up from 38.6% in June 2013, according to the latest Australian Prudential Regulation Authority figures. Over the same period, the proportion of loans for investment properties also rose — to 37.9%, from 35.2% — but not by as much as the rise in IO loans.
The growing gap between the percentage of IO loans and investment loans shows that more owner-occupier borrowers are taking out IO loans.
IO loans, whether they are for owner-occupiers or real estate investors, generally carry a greater risk of delinquencies and default than traditional PI loans.
In particular, IO loans are more sensitive to interest rate rises than PI loans because of their larger amounts and slower amortization rates. IO loans are most sensitive to higher interest rates when they revert to PI loans — which typically occurs after 5-10 years — and monthly repayment amounts rise significantly.
If the proportion of owner-occupier IO loans continues to rise, we would expect that they would also make up a greater proportion of the loans in future RMBS transactions, which would be credit negative, given their higher propensity for delinquency and default.
Owner-occupier IO loans account for 16.5% of the current RMBS portfolio, but these do not present the same risk as new owner-occupier IO loans because they were underwritten when interest rates were higher and would be more resilient when rates rise again.
In the current record low interest rate environment in Australia, delinquency rates for IO loans have in fact been lower than for PI loans. This situation reflects the fact that monthly repayments for IO loans are lower than PI loans. However, our expectation is that interest rates in Australia will rise in 2015, putting more pressure on IO borrowers and resulting in greater levels of delinquencies and defaults.
Real estate investors in Australia can claim a tax deduction for the interest costs of their loans, which will help offset the impact of higher rates. However, owner-occupiers are not eligible for such deductions. For this reason, all else being equal, an increase in interest rates will be more severe for owner-occupier IO borrowers than investment borrowers.
Owner-Occupiers Turn to IO Loans as Property Prices Increase
At a time when property prices and therefore the size of mortgages in Australia is rising rapidly, the increase in the number of owner occupiers taking out IO loans may reflect their decision to take out larger loans amounts, given the rise in property prices.
In Australia, national house prices have increased by 9.3% over the year ended September 2014, while in Sydney, the city with the highest growth, prices have risen by 14.3%.
Against this backdrop, home buyers may view IO loans as an option if they seek to borrow larger amounts without having to service as large a monthly repayment amount as they would have to with a similarly sized PI loan.
In our existing RMBS portfolio, the average loan size of owner-occupier IO loans is AUD289,800, compared with AUD187,500 for PI loans.
In addition, the current loan-to-value ratio of owner-occupier IO loans is 2.1% higher than PI loans. IO loans are also paid off at a slower rate, as reflected by the fact that they are 5.1% in advance of their scheduled payment balance, compared with 6.5% for PI loans. Hence, owner occupier IO loans are larger, more leveraged and slower to amortize than PI loans.
Accordingly, once interest rates rise from their current record low levels, any issues owner-occupier IO loan borrowers have with servicing their mortgages will be exacerbated, leading to higher delinquencies and defaults.
However, it is also important to note that some owner-occupier borrowers may be choosing IO loans simply to maintain a level of flexibility in managing their repayment obligations, rather than because of serviceability reasons. Given that interest rates are at record lows, these borrowers may feel comfortable in paying only the interest on their mortgages and using any remaining available funds for other purposes.
But, because these borrowers are making few, if any, principal repayments, their loan amounts will remain high relative to PI loans, leaving them more susceptible to payment shocks when interest rates rise.

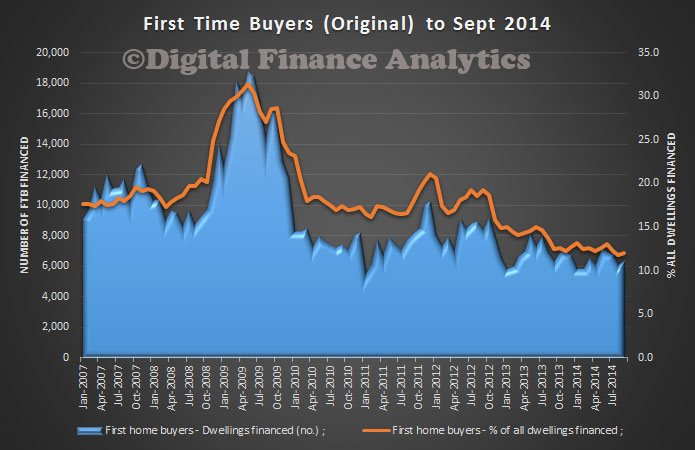
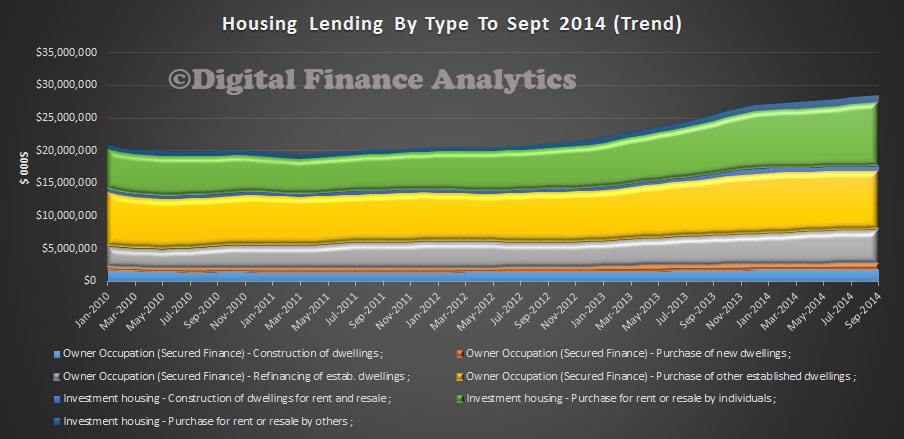
 In trend terms, the number of commitments for owner occupied housing finance rose 0.5% in December 2014. In trend terms, the number of commitments for the purchase of established dwellings rose 0.6%, while the number of commitments for the purchase of new dwellings fell 1.1% and the number of commitments for the construction of dwellings was flat.
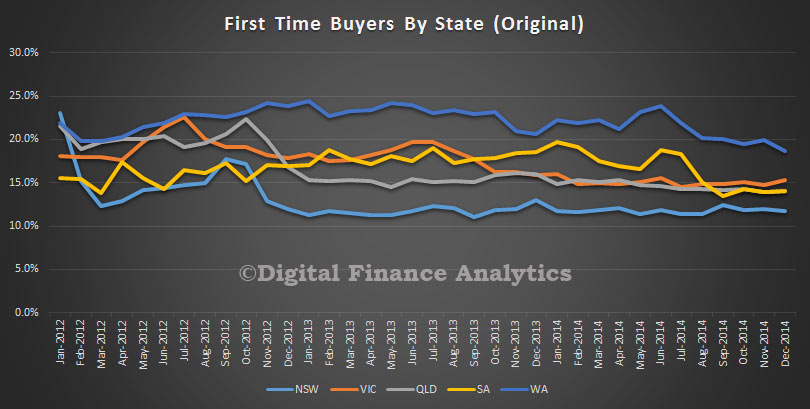
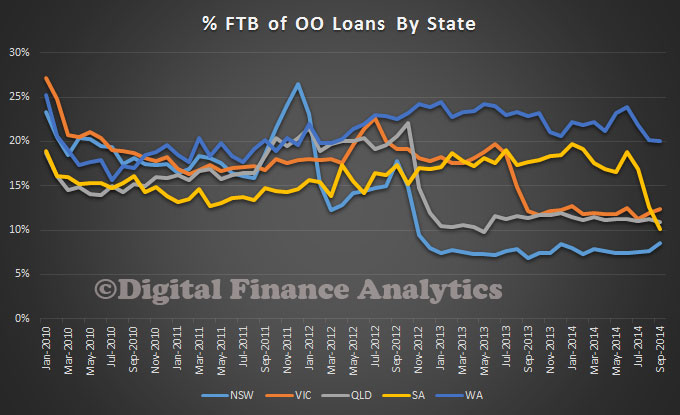
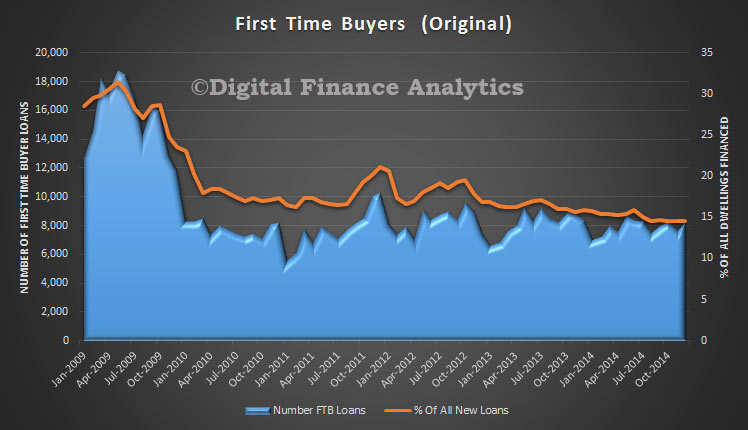 The state by state data reflects the revised First Time Buyer data, with NSW up by one third from 8% to 11% following the ABS revisions, compared with a national uplift of one quarter. We still see WA leading the way, though falling from the June 2014 peak. The other states are now more closely aligned. Given the size of the adjustment, we hypothise that at least one of the majors was not correctly recording first time buyer data.