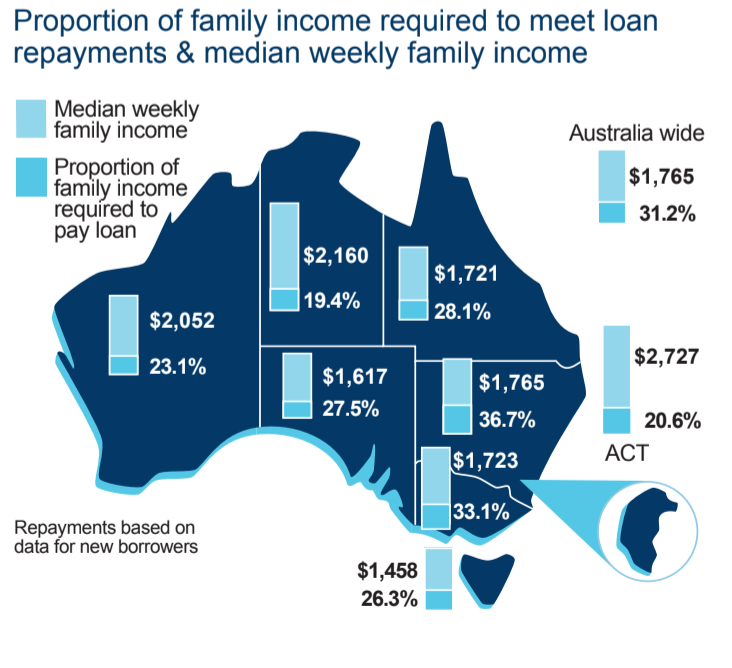
Housing affordability declined in all states and territories, with the exception of Victoria and the Northern Territory, according to the December quarter 2018 edition of the Adelaide Bank/REIA Housing Affordability Report, via The Real Estate Conversation.
“The slight downtick in housing affordability nationally for the
quarter is disappointing,” Darren Kasehagen, Head of Third Party
Banking, Adelaide Bank said.
Adelaide Bank/REIA Housing Affordability Report at a glance:
Victoria leads first home buyer numbers
Australian Capital Territory first home buyers up 34 per cent
New South Wales shows the biggest improvement for renters
Queensland shows the largest decrease in new loans
South Australia had the largest increase in loan size
Western Australia rents up 0.5 per cent (but still nations most affordable at 16.6 per cent of family income)
Tasmania had the largest rise in monthly loan repayments
Northern Territory housing affordability improves by 1.5 per cent
Mr Kasehagen said the decline in affordability in the quarter is
attributable to an increase in average mortgage payments through
increases in interest rates.
“These negated the drop in house prices and an increase in household payments.”
The largest decline was in Tasmania, with the proportion of income required to meet loan repayments increasing to 26.3 per cent.
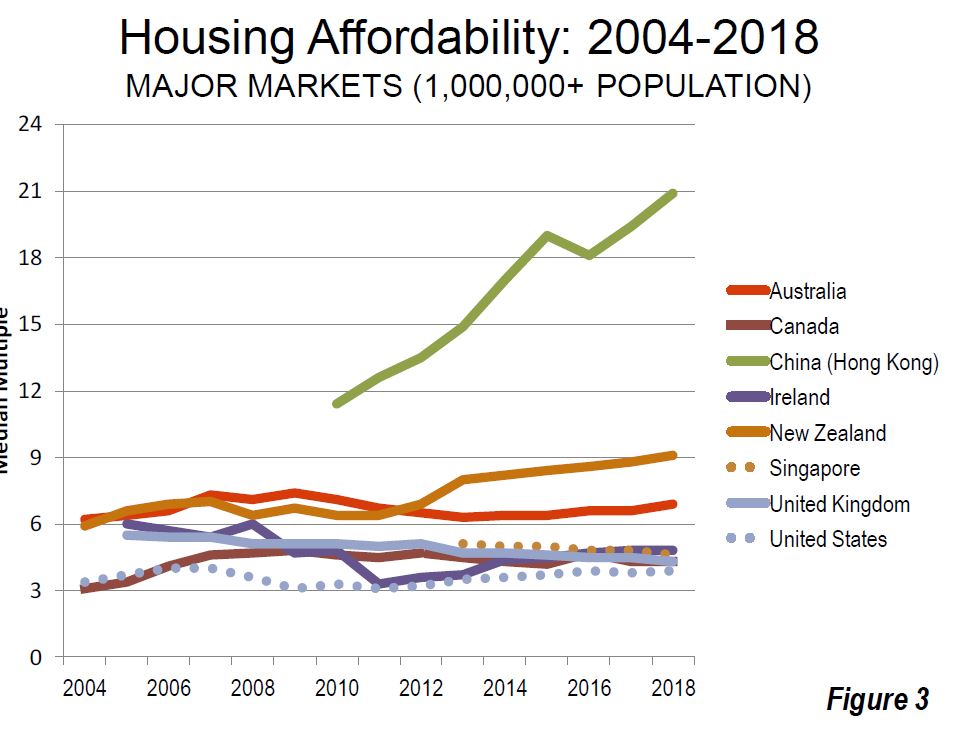
The 15th edition of the annual Demographia Internal Housing Affordability Survey has been released. Once again it shows that Australia and New Zealand property is unaffordable. Globally there were 26 severely unaffordable major housing markets in 2018. As normal they argue for planning reforms to release land, but do not consider credit availability, the strongest lever to affordability!
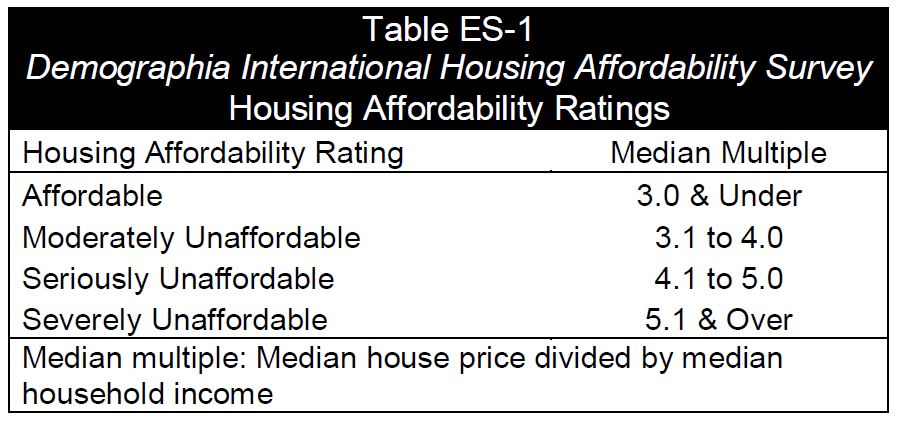
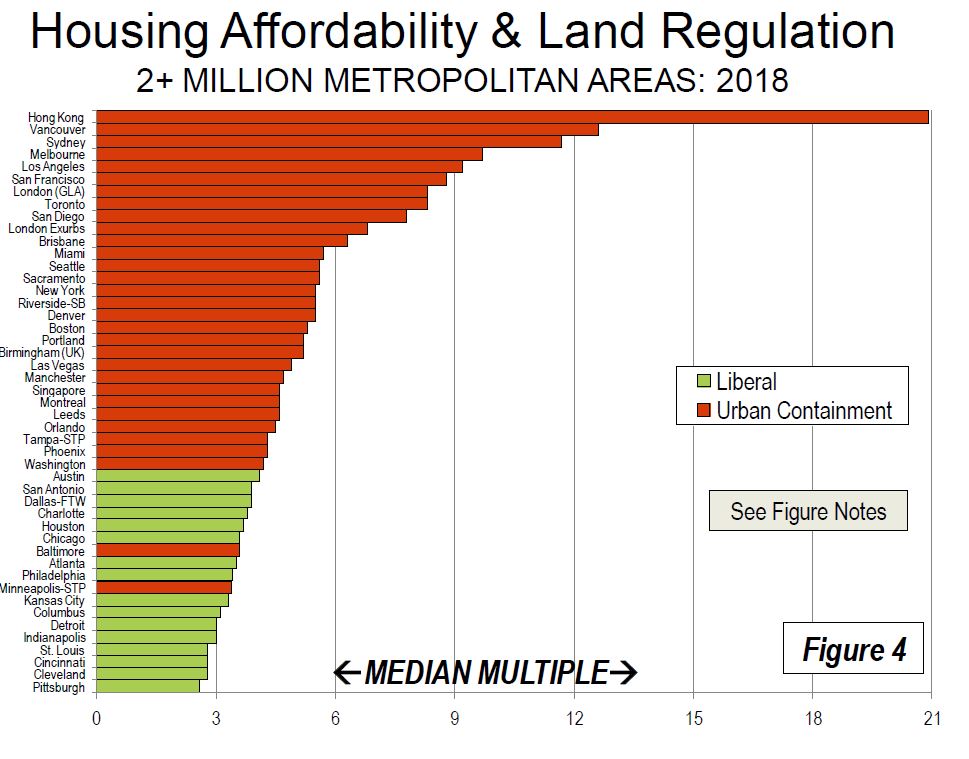
The Demographia International Housing Affordability Survey rates housing affordability using the “Median Multiple”, average house price divided by average household income or Price- Income Ratio (PIR). In the 2019 Affordability Survey covering 90 cities of more than one million people, PIR values range from 2.6 in Pittsburgh, PA and Rochester, NY to 20.9 in Hong Kong!
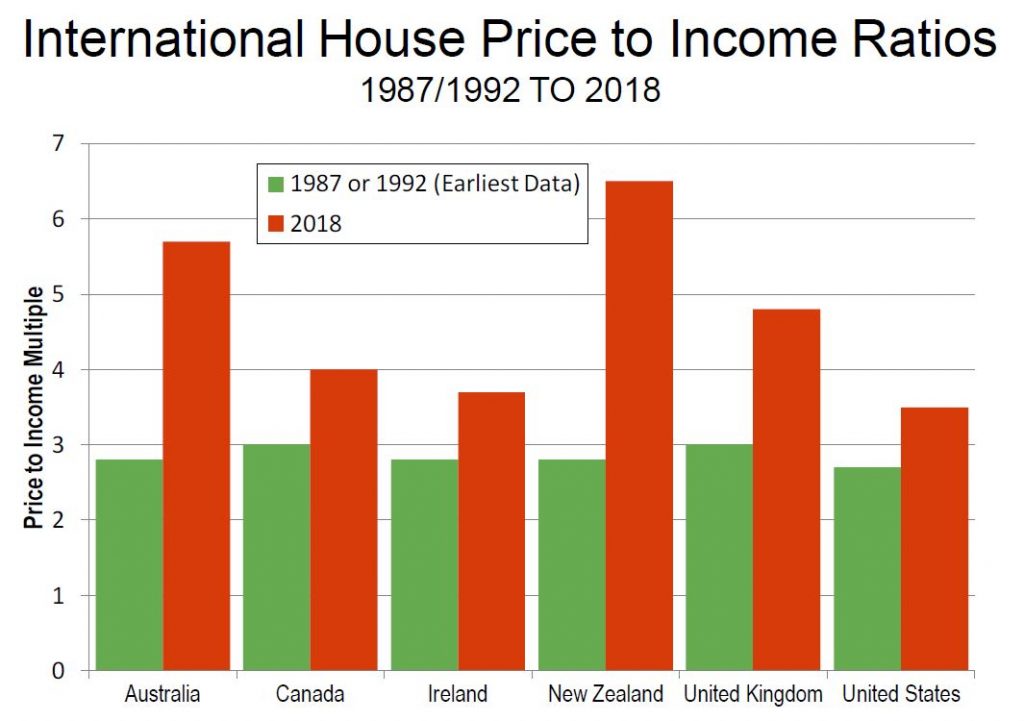
Available data shows that house costs have generally risen at a rate similar to that of household incomes until comparatively recently. This is consistent with cost trends among other basic necessities, such as personal transport, food and clothing. In some metropolitan markets house prices have doubled, tripled or even quadrupled relative to household incomes. Historically, the Median Multiple has been remarkably similar among six surveyed nations, with median house prices from 2.0 to 3.0 times median household incomes (Australia, Canada, Ireland, New Zealand, the United Kingdom and the United States). Housing affordability remained generally within this range until the late 1980s or late 1990s in each of these nations.
In recent decades, house prices have escalated far above household incomes in many parts of the world. [This coincides with the deregulation of the financial markets, and more recently QE and ultra low interest rates]
The report says that many prosperous cities consider ever increasing housing prices as an unavoidable side-effect of their economic success. But the Survey conducted by Wendell Cox and Hugh Pavletich demonstrates that some cities can be economically successful and avoid over-charging households for their housing consumption. Australia is not among them, so why do some cities manage to conciliate economic growth and housing affordability while others see their PIR number increases years after years?
The severely unaffordable major markets include all in Australia (5), New Zealand (1) and China (1). Two of Canada’s six markets are severely unaffordable. Seven of the 21 major markets in the United Kingdom, and 13 of the 55 major markets in the United States are severely unaffordable.
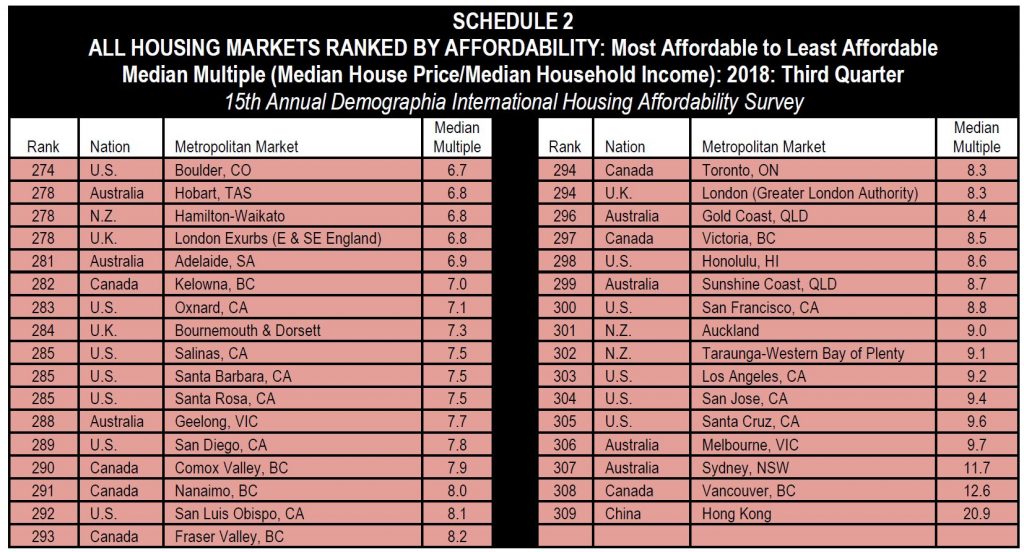
There are 26 severely unaffordable major housing markets in 2018. Again, Hong Kong is the least affordable, with a Median Multiple of 20.9 up from 19.4 last year. Vancouver has replaced Sydney as the second least affordable, with a Median Multiple of 12.6. With slightly declining house prices, Sydney’s Median Multiple dropped to 11.7. Melbourne (9.7), San Jose (9.4), Los Angeles (9.2) and Auckland (9.0) were also among the least affordable. San Francisco (8.8), Honolulu (8.6), as well as London (Greater London Authority) and Toronto (both 8.3) were also among the 10 least affordable major markets.
An already high or increasing Price-Income Ratio (PIR) should immediately signal to urban managers that they should take urgent correcting action after conducting a detailed diagnosis that would explain the high PIR figure. The Affordability Survey should be similar to the periodic health check-up taken by an individual: an abnormally high blood pressure indicates that urgent correcting steps should be taken.
Virtually all of the severely unaffordable major markets have urban containment.
Among the 79 severely unaffordable markets, 28 are in the United States, 17 in Canada, 16 in Australia, 11, six in New Zealand and one in China. Among the 10 least affordable housing markets, seven are major housing markets. s least affordable 10 also includes California’s Santa Cruz, at 9.6 and Tauranga-Western Bay of Plenty in New Zealand, at 9.1. All of the other least affordable metropolitan areas were major markets.
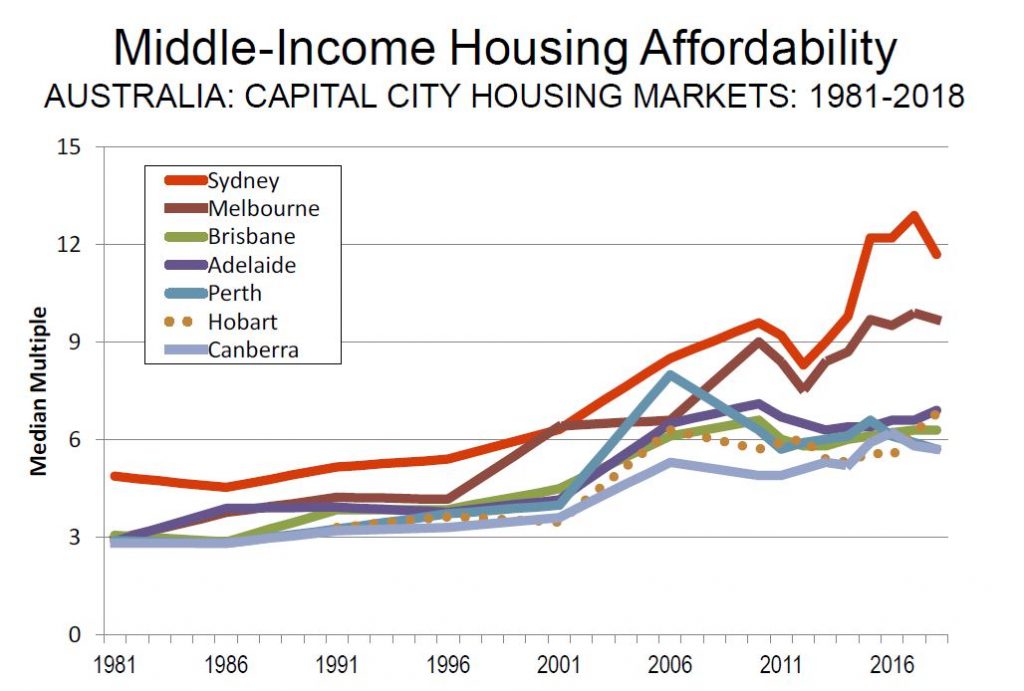
In Australia, housing affordability remains severely unaffordable in all of the major markets, and by a substantial margin in Sydney and Melbourne. Despite what has been called the largest Sydney price reduction in 35 years, house prices relative to incomes are more than double the rate of the early 1980s. In Sydney and Melbourne, median income households need at least three years’ more income to pay for the median priced house than in 2004, when the first Survey was published.
Major Markets: Sydney is again Australia’s least affordable market, with a Median Multiple of 11.7, and ranks third worst overall, trailing Hong Kong. Melbourne has a Median Multiple of 9.7 and is the fourth least affordable major housing market internationally. Only Hong Kong, Vancouver, and Sydney are less affordable than Melbourne. Adelaide has a severely unaffordable 6.9 Median Multiple and is the 16th least affordable of the 91 major markets. Brisbane has a Median Multiple is 6.3 and is ranked 18th least affordable, while Perth, with a Median Multiple of 5.7 is the 24th least affordable major housing market in this year’s Survey.
Other Housing Markets: Overall, Australia’s housing markets have a severely unaffordable Median Multiple of 5.9. The most affordable markets are moderately affordable, Gladstone, Queensland at 3.2 and Rockhampton, Queensland at 3.9. There are no affordable or moderately affordable markets in Australia. Overall 16 markets in Australia are rated severely unaffordable. The least affordable are the Sunshine Coast, Queensland (8.7) and the Gold Coast, Queensland (8.4).
Historical Context: Australia’s generally unfavorable housing affordability is in significant contrast to the broad affordability that existed before implementation of urban containment (called “urban consolidation” in Australia). The price-to-income ratio in Australia was below 3.0 in the late 1980s. All of Australia’s major markets have urban containment policy and all have severely unaffordable housing.
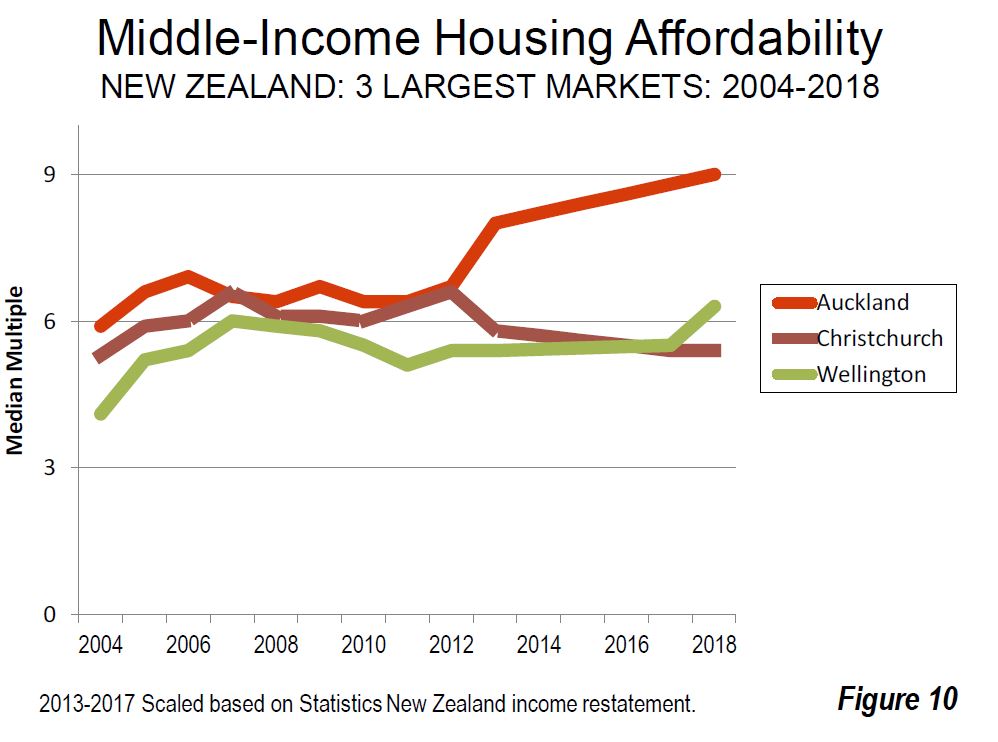
New Zealand’s housing affordability has a severely unaffordable Median Multiple of 6.5. Recent Median Multiple trends have been influenced by government restatement of median income data.
Major Housing Market: Auckland, New Zealand’s only major housing market has a severely unaffordable 9.0 Median Multiple. Housing affordability has deteriorated from a Median Multiple of 5.9 in the first Survey (2004), thus adding the equivalent of three years in pre-tax median household income to the house prices. Over the past year, Auckland’s house prices have been stable, with the Median Multiple increase resulting from the household income restatement described above. Auckland is the seventh least affordable among the 91 major housing markets, and has been severely unaffordable in all 15 Demographia International Housing Affordability Surveys.
Other Housing Markets: There is severely unaffordable housing in the two largest markets outside Auckland. Christchurch has a Median Multiple of 5.4, while Wellington is at 6.3.
Housing Affordability and Public Policy: Outside Singapore, New Zealand is the only nation in the Survey that emphasizing public policy priority to restore and maintain middle-income housing affordability. In New Zealand, as in Australia, housing had been affordable until approximately a quarter century ago. However, urban containment policies were adopted across the country, and consistent with the international experience, housing became severely unaffordable in all three of New Zealand’s largest housing markets, Auckland, Christchurch and Wellington.
Meanwhile, public opinion placed the issue of housing affordability to the top of the policy agenda in the last three national elections. That concern continues to be dominant according to the latest IPSOS New Zealand Issues Monitor (October 2018), with 45 percent saying that “Housing/Price of Housing” is the issue of greatest concern. Poll respondents were asked to identify the three most important issues, and the cost of living rated third, which is to be expected given the enormous influence of housing costs on the financial health of households. The new Labour Party led coalition government unveiled a focused housing affordability program, intending to increase the housing supply throughout Auckland, including both urban fringe and infill development. The Labour Party’s Urban Growth agenda calls for intensified residential development, both greenfield and infill. The Auckland urban containment boundary is to be abolished. Recently, the government and the city of Auckland agreed to establish a non-government debt financing mechanism to facilitate development of a 9,000 home greenfield development. The government intends to establish an Urban Development Authority, which would provide means for communities and developers to finance infrastructure for new housing development.
In his Introduction: Avoiding Dubious Urban Policies to this Survey, former World Bank principal urban planner Alain Bertaud says that “After the government has successfully passed these reforms, the international community will watch with great interest the impact it will have on Auckland’s PIR (Median multiple) in the next few years. It is hoped that the example of Auckland will create a blueprint that could be used in other high PIR cities.”
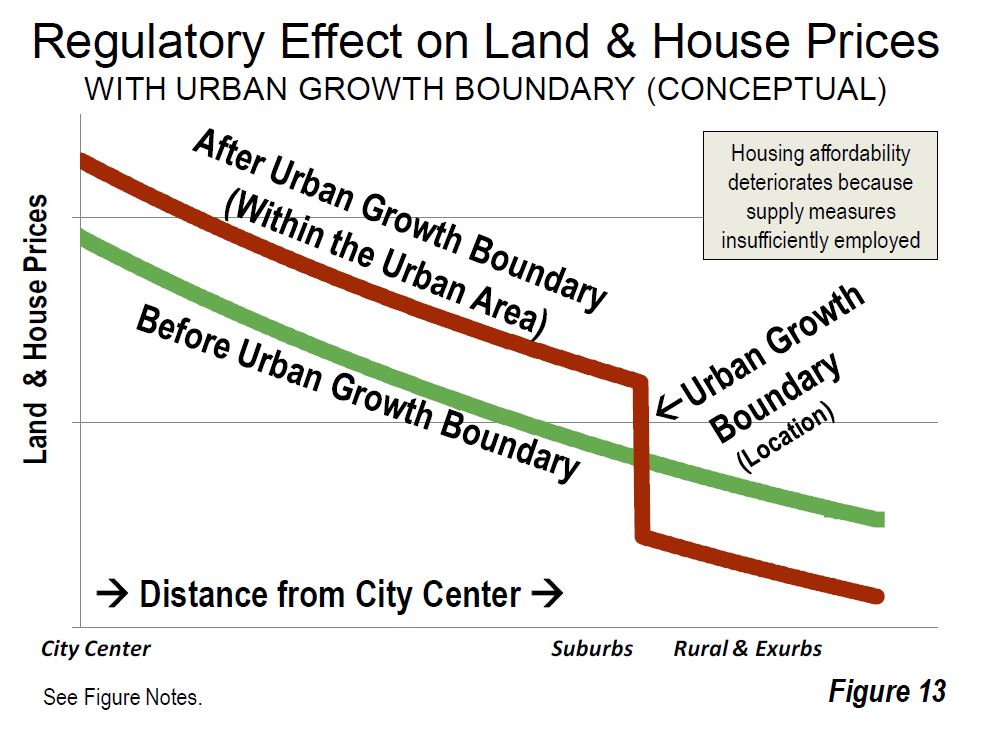
These developments build on other recent developments, especially a Productivity Commission of New Zealand report, which found that land use authorities have a responsibility to provide “capacity to house a growing population while delivering a choice of quality, affordable dwellings of the type demanded ….” Consistent with that finding, the Productivity Commission proposed a measure that would automatically expand the supply of greenfield land when housing affordability targets are not met. The Commission said, “Where large discontinuities emerge between the price of land that can be developed for housing and land that cannot be developed, this is indicative of the inadequacy of development capacity being supplied within the city.” The Productivity Commission expansion of greenfield land for development where the difference between land prices on either side of an urban containment boundary become too great.
Here are the top housing markets listed by their unaffordability.
The report highlights three myths which tend to limit policy responses, namely:
Myth #1: planners know how to allocate land equitably through the design of increasingly complex zoning regulations while ignoring price signals.
Myth #2: Regulators can mandate the creations of new affordable housing units by obliging private developers to provide a share (usually 20%) of the housing units they build at prices fixed by the government below market; regulators call these “affordable housing units.”
Myth #3: The compact city fallacy. A city can accommodate increasing income and population through densification of the existing built-up area; expansion into greenfield would result in “sprawl.”
The report says that by severely restricting or even prohibiting expansion to accommodate larger population, urban containment has virtually destroyed the competitive market for land in many urban areas, driving house prices up relative to incomes.
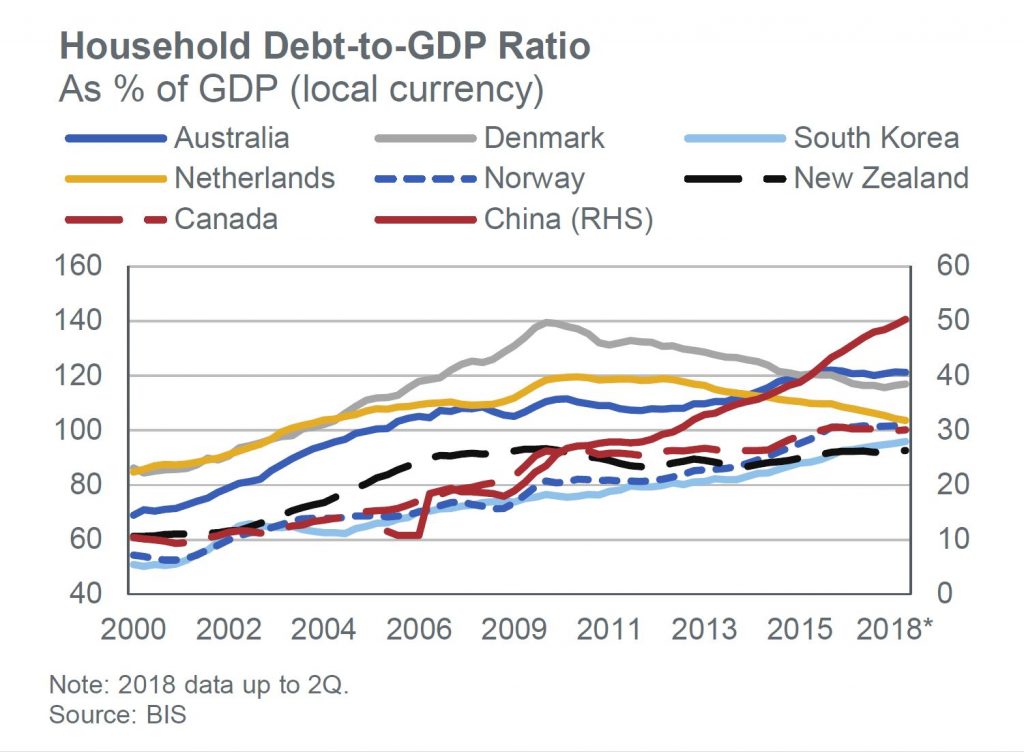
We agree that land supply is one important issue but the report is silent on the most powerful lever of home prices, credit availability. Our own research suggests that more credit leads to higher prices, and the reverse is also true. There are correlations with the household debt to GDP ratios.
In addition there is an “undersupply myth”. According to the latest census in Australia, from 2016, 11.2% of residential properties are unoccupied, which equates to 1,039,874 residences. We also saw in Joe Wilkes’ recent reports from Auckland, that supply is not an issue at this time in New Zealand.
Finally, some will criticise the index method they use in their surveys, but we think the consistently applied approach shows real trends and real issues.
In fact, the truth is housing affordability is a result of the complex interplay between supply and demand, planning and credit, and to that end the Demographia survey is a helpful tool to diagnose the issues we face. But planning changes alone will not solve the issue. The greatest of these is credit.
The ACCC has issued a draft determination proposing to authorise SA Housing Authority and Renewal SA to enter into arrangements with land and property developers to increase the supply of affordable housing in the greater metropolitan region of Adelaide.
The government of South Australia has set a goal that 15 per cent of all new significant developments should be available as affordable housing.
Affordable housing is to be made available to people in the low to moderate income category, who are often employed in the health care, social services and administrative support occupations.
Under the proposed arrangements, SA Housing Authority and Renewal SA may ask developers to agree to cap prices for properties in some developments, agree to rent or sell to specified tenants or purchasers and agree not to compete for the rental or sale of property.
“The ACCC considers that the arrangements are likely to contribute to an increase in the supply of affordable housing in the greater metropolitan region of Adelaide. People who may otherwise find themselves excluded from both the general housing market and social housing, are likely to benefit from an increase in affordable housing,” ACCC Commissioner Mr Roger Featherston said.
“The arrangements are unlikely to result in public detriment. Housing affordability criteria are set and published by the government of South Australia and developers have a wide range of land and property developments from which to choose.”
The ACCC proposes to grant authorisation for 10 years and expects to make a final determination in November 2018.
Further information about the application for authorisation, including copies of the ACCC’s draft determination and public submissions, is available at SA Housing Authority and Renewal SA.
Authorisation provides statutory protection from court action for conduct that might otherwise raise concerns under the competition provisions of the Competition and Consumer Act 2010. Broadly, the ACCC may grant an authorisation when it is satisfied that the public benefit from the conduct outweighs any public detriment.
Authorisation is sought as the proposed conduct may contain a cartel provision.
Background
SA Housing Authority and Renewal SA, and land and property developers may be considered competitors for the supply of affordable housing.
Therefore, by arranging to cap prices and not compete for the supply of rentals and the sale of properties, they risk breaching competition laws unless they have ACCC authorisation.
On 1 July, legislation in Denmark took effect that will trigger the inaugural issuance of Danish public housing covered bonds (almene realkreditobligationer) as a new asset class, says Moody’s.
These new covered bonds will be issued out of newly established capital centres with the sole purpose of funding mortgage loans granted to public housing companies (almen boligforening). As is the practice in the Danish covered bond market, assets serving as security for covered bonds must be segregated into independent cover pools, referred to as capital centres in mortgage banks. The Danish government guarantees in full the mortgage loans as well as the public housing covered bonds.
The law is credit positive for potential investors in public housing covered bonds because their credit risk will be lower than in existing mortgage covered bonds. Although investors in both types of covered bonds benefit from recourse to the issuing mortgage bank and a pool of good quality mortgage assets, only public housing covered bonds benefit from a state guarantee in case the issuer fails to fulfil its obligations.
Today, public housing loans benefit from a municipality’s partial guarantee of the loan, but under the new framework such loans will benefit from the federal government’s guarantee covering the full loan amount. In 2017, Danish municipalities guaranteed on average the most risky 62% of mortgage loans. Under the new model, the government will charge a guarantee commission from the mortgage banks. The mortgage banks, owing to the government’s full guarantee, will have lower capital requirements and lower over- collateralisation requirements for the covered bonds that are set in Denmark at 8% of risk-weighted assets.
Denmark’s public housing covered bonds will be issued by mortgage banks via frequently held auctions and tap sales. For the issuance of public housing covered bonds, banks shall obtain bids for purchases from Denmark’s central bank on behalf of the Danish government before the bonds are sold to others, which reduces funding execution risk for the public housing companies and the mortgage banks. According to the Danish central bank, the government will purchase DKK42.5 billion of public-sector covered bonds in 2018, corresponding to the total of new loans and refinancings of existing loans. The government will bid at a rate corresponding to the yield on government bonds.
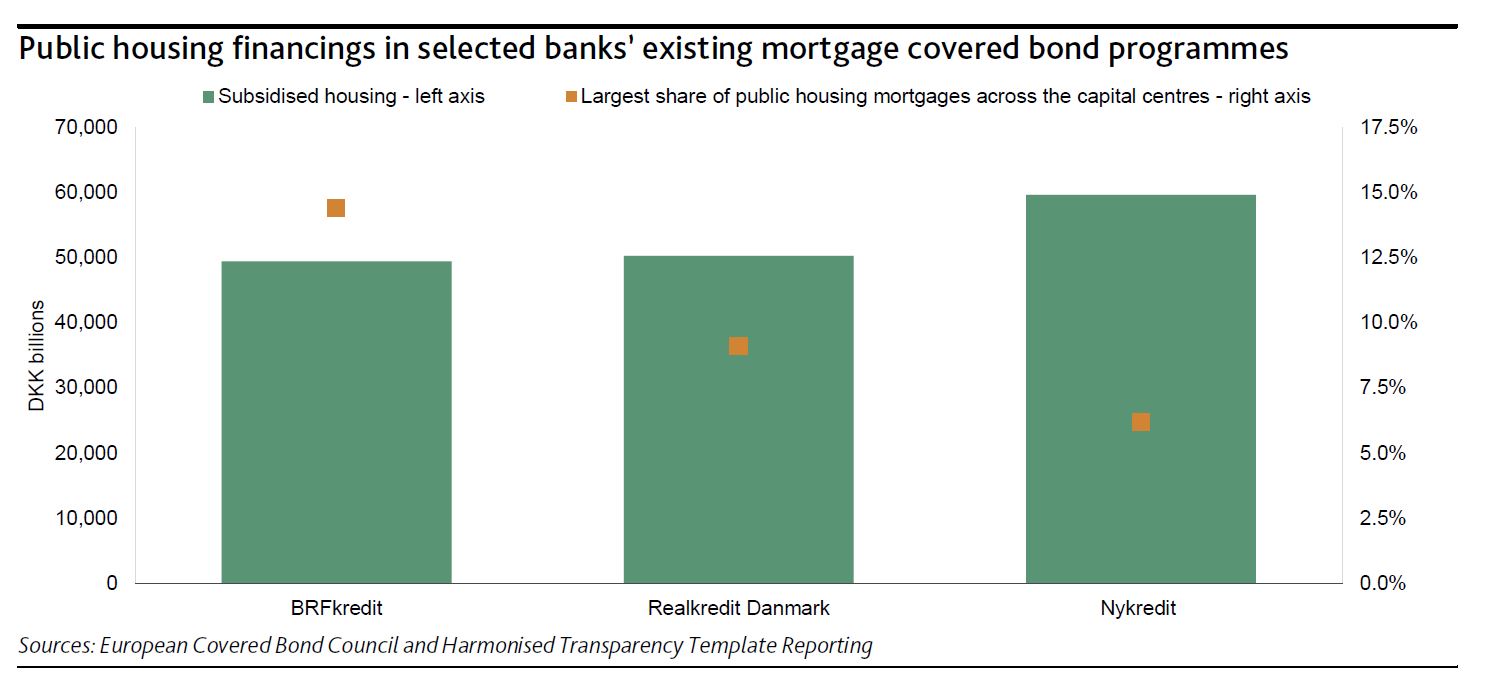
We expect a quick migration of public housing loans to the newly established capital centres in order to benefit from the government guarantees. This will lead to an increased level of prepayments and refinancings in the existing capital centres. The public housing sector has subsidised loans totalling around DKK180 billion that are largely financed by existing capital centres that issue mortgage covered bonds.
Nykredit Realkredit A/S, Realkredit Danmark A/S (part of Danske Bank) and BRFkredit A/S (part of Jyske Bank) are active lenders in this sector, each currently lending DKK50-DKK60 billion to the public housing sector. Despite the public housing loans being refinanced into the new capital centres, the risk characteristics of the capital centres will not change materially because the share of public housing loans is often small and in active capital centres does not exceed 15% as shown in the exhibit.
Even though house prices have risen substantially over recent decades, housing costs as a share of income have barely shifted in over 20 years. Costs relative to disposable income for housing are largely unchanged, at 17% since 1993, although there has been some increase since 2000.
There is no agreed measure for defining housing affordability, but just looking at house prices can be deceptive. Australian households are roughly equally split between purchasing, renting or owning their house outright.
There is no doubt that house prices increased substantially over recent decades. According to CoreLogic over the past 20 years the median house price in Australia increased from A$140,000 in December 1997 to A$540,000 by December 2017 – an annual increase of 7%. Relative to disposable income this represents a 68% increase over the 20-year period.
Australian households are roughly equally split between purchasing, renting or owning their house outright. Highly inflated house prices are more concerning to people wishing to move from renting to purchasing a house (mostly potential first home buyers).
Housing affordability looks very different when we look at actual housing costs relative to income, rather than just house prices. Housing costs increased substantially between 1984 and 1993.
This was a combination of weak income growth and strong increases in housing costs, particularly mortgages with interest rates increasing sharply over this period. Since peaking in 1993 costs remained relatively stable with rents increasing modestly over the past 10 years, while mortgage costs declined.
Overall, actual housing costs relative to income have remained stable since 1993 at around 16% of disposable income.
We split households into five equal groups from lowest 20% of disposable income up to highest 20%, after adjusting for type of family and household size. Clearly, low-income households spend a lot more on housing relative to their income than higher-income households. The share of housing costs for the lowest income quintile has increased in recent years but is not substantially different from longer term averages.
All other income groups have increased their share of spending relative to income since 1984. Since 1993 the changes have been mixed with the lowest income households and highest income households both spending less as a share of income, while the middle income categories have increased their spending, albeit modestly.
Housing was much more affordable in 1984 with average housing costs at just 11.3% of disposable income.
A number of important changes have occurred over the past 25 years. Interest rates are much lower, living standards have increased substantially for low, middle and high income families and savings rates have also increased – implying that housing costs are increasingly a larger share of expenditure.
Another common measure of housing affordability is housing stress. We use the “30/40” stress rule – a household paying more than 30% of their disposable income on housing costs and also in the bottom 40% of the income distribution.
Using this housing stress measure, we see a significant increase in renter stress, firstly between 1984 and 1993 and then from 2007. Mortgage stress is largely unchanged since 1988 following an increase between 1984 and 1988.
Housing stress rates are similar for major states. The highest rate is in Queensland with 13.5% of households in stress whereas the combined ACT and NT region has the lowest stress rate at 8.1%, thanks to relatively high incomes. The NSW rate is lower than both Victoria and Queensland.
Home ownership rates in Australia have slowly declined since 1984 from around 72% to around 68% by 2015-16. Ownership rates of households headed by people aged under 35 dropped from 50% in the 1980s to around 35% in 2015-16. Households headed by people aged 35 to 49 have experienced a similar percentage point decline but from a higher base.
The downward trend in ownership rates for younger households has been ongoing since 1988. Surprisingly, the house price boom between 1999 and 2005 in Australia does not appear to have made a significant difference to pre-existing trends.
However, home ownership trends are complex, and are likely driven by a range of factors such as interest rates, higher rents in the 1980s, broader societal changes such as people marrying and having children later in life and a higher divorce rates. Another possibility is a shift away from home ownership, with younger people preferring the flexibility that renting offers.
Overall, housing costs in Australia have been relatively stable as a share of disposable income since the early 1990s. This average does mask problems for low-income renters who are paying an increasing share of their income on housing costs, and rent stress levels have also increased over the long term.
Changed economic circumstances provide risks for housing affordability. Were interest rates or unemployment to increase sharply there would be risks to households and flow on effects to the broader economy.
House prices have indeed increased sharply since the late 1990s, well above incomes or inflation. This poses a problem for those wishing to move from the rental market to owning a home as higher house prices imply larger deposits.
While elevated house prices are a concern, the more pressing social problem for Australia remains the lack of affordable rental housing for lower-income families that is close to jobs and services in our capital cities. This has been an ongoing problem in Australia for a number of decades. An ageing population with potentially lower home ownership rates will add to this problem in future years
Author: Ben Phillips, Associate Professor, Centre for Social Research and Methods, Australian National University
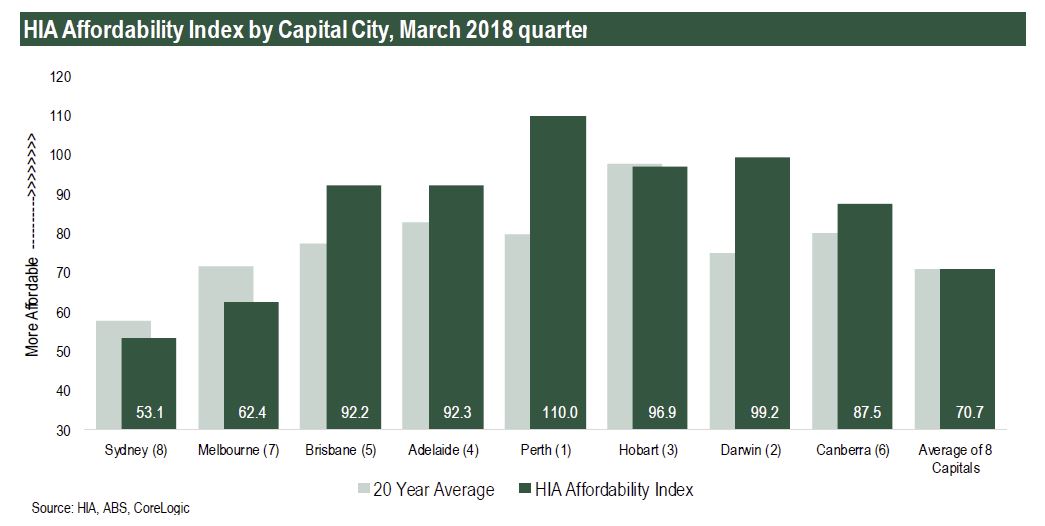
“Affordability improved in most of Australia’s capital cities during the first three months of 2018 as house price pressures eased,” commented Shane Garrett, HIA Senior Economist.
This does not necessarily take account of the now tighter, and becoming even tighter lending standards now in play. In any case, in most centres, affordability is still well below the long term averages.
HIA’s Affordability Index is calculated for each of the eight capital cities and regional areas on a quarterly basis and takes into account latest dwelling prices, mortgage interest rates and wage developments. The results are published and analysed in the HIA Affordability Report.
“Affordability in Sydney improved by 1.9 per cent as a result of the reduction in dwelling prices over the past six months, while in Melbourne the outcome was largely unchanged as price growth remains solid.
“Across the eight capital cities overall, affordability improved slightly (+0.2 per cent) during the March 2018 quarter. The improvement was held back by strong home price growth in a limited number of markets including Melbourne and Hobart.”
“Current interest rate settings continue to benefit affordability. The RBA’s official cash rate is at a record low and hasn’t been moved in over 20 months – an unprecedented period of stability.
“Even though we have started to move in the right direction, housing affordability remains very challenging in the larger capital cities. The root cause of the problem is that the cost of producing new houses and apartments is still too high.
“Governments need to focus on solutions involving lower land costs, a more nimble planning system and a lighter taxation burden on new home building,” concluded Mr Garrett.
Today we examine the Mortgage Industry Omnishambles. And it’s more than just a flesh wound!
Welcome to the Property Imperative Weekly to 17th March 2018. Watch the video, or read the transcript.
In this week’s review of property and finance news we start with the latest January data from the ABS which shows lending for secured housing rose 0.14% or 28.8 million to $21.1 billion. Secured alterations fell 1%, down $3.9 million to $391 million. Fixed personal loans fell 0.1%, down $1.2 million to $4.0 billion, while revolving loans fell 0.06%, down $1.3 million to $2.2 billion.
Investment lending for construction of dwellings for rent rose 0.86% or $10 million to $1.2 billion. Investment lending for purchase by individuals fell 1.34%, down $127.7 million to $9.4 billion, while investment lending by others rose 7.7% up $87.2 million to $1.2 billion.
Fixed commercial lending, other than for property investment rose 1.25% of $260.5 million to $21.1 billion, while revolving commercial lending rose 2.5% or $250 million to $10.2 billion.
The proportion of lending for commercial purposes, other than for investment housing was 45% of all commercial lending, up from 44.5% last month.
The proportion of lending for property investment purposes of all lending fell 0.1% to 16.6%.
So, we are seeing a rotation, if a small one, towards commercial lending for more productive purposes. However, lending for property and for investment purposes remains quite strong. No reason to reduce lending underwriting standards at this stage or weaken other controls.
But this also explains the deep rate cuts the banks are now offering – even to investors – ANZ Bank and the National Australia Bank were the last of the big four to announce cuts to their fixed rates, following similar announcements from the Commonwealth Bank and Westpac. NAB has dropped its five-year fixed rate for owner-occupied, principal and interest home loans by 50 basis points, from 4.59 per cent to 4.09 per cent. The bank has also reduced its fixed rates on investor loans by up to 35 basis points, with rates starting from 4.09 per cent. And last week ANZ also dropped fixed rates on its “interest in advance”, interest-only home loans by up to 40 basis points, with rates starting from 4.11 per cent. Further, fixed rates on its owner-occupied, principal and interest home loans have fallen by 10 basis points, with rates now starting from 3.99 per cent. This fixed rate war shows our big banks are not pricing in a rate hike anytime soon.
But we think these offers will likely encourage churn among existing borrowers, rather than bring new buyers to the market. For example, the ABS housing finance data showed that in original terms, the number of first home buyer commitments as a percentage of total owner occupied housing finance commitments rose to 18.0% in January 2018 from 17.9% in December 2017 – and this got the headline from the real estate sector, but the absolute number of first time buyers fell, thanks mainly to falls of 22.3% in NSW and of 13.3% in VIC. More broadly, there were small rises in refinancing and investment loans for entities other than individuals.
The latest data from CoreLogic shows home prices fell again this week, with Sydney down for the 27th consecutive week, and their index registering another 0.09% drop, whilst auction volumes were down on last week. They say that last week, the combined capital city final auction clearance rate fell to 63.3 per cent across a lower volume of auctions with 1,764 held, down from the 3,026 auctions over the week prior when a slightly higher 63.6 per cent cleared. The weighted average clearance rate has continued to track lower than results from last year; when over the corresponding week 75.1 per cent of the 1,473 auctions sold.
But the strategic issues this week relate to the findings from the Royal Commission and from the ACCC on mortgage pricing. I did a separate video on the key findings, but overall it was clear that there are significant procedural, ethical and even legal issue being raised by the Commission, despite their relatively narrow terms of reference. They cannot comment on bank regulation, or macroprudential, but the Inquiries approach is to examine a series of case studies, from the various submissions they have received, and then apply forensic analysis to dig into the root causes examining misconduct. The question of course is, do the specific examples speak to wider structural questions as we move from the specific instances. We discussed this on ABC Radio this week.
From NAB we heard about referrer’s providing leads to the Bank, outside normal lending practices and processes, and some receiving large commissions, despite not being in the ambit of the responsible lending code. From CBA we heard that the bank was aware of the conflict brokers have especially when recommending an interest only loan, because the trail commission will be higher as the principal amount is not repaid. And from Aussie, we heard about their reliance on lenders to trap fraud, as their own processes were not adequate. And we also heard of examples of individual borrowers receiving loans thanks to poor conduct, or even fraud. We also heard about how income and expenses are sometimes misrepresented. So, the question is, do these various practices show up more widely, and what does this say about liar loans, and mortgage systemic risk?
We always struggled to match the data from our independent household surveys with regards to loan to income, and loan to value, compare with loan portfolios we looked at from the banks. Now we know why. In some cases, income is over stated, expenses are understated, and so loan serviceability is a potentially more significant issue than the banks believe – especially if interest rates rise. In fact, we saw very similar behaviours to the finance industry in the USA before the GFC, suggesting again we may see the same outcomes here. One other point, every lender is now on notice that they need to look at their current processes and back book, to test affordability, serviceability and risk. This is a big deal.
I will also be interested to see if the Commission turns to look at foreclosure activity, because this is the other sleeper. Mortgage delinquency in Australia appears very low, but we suspect this is associated with heavy handed forced sales. Something again which was apparent around the GFC.
More specifically, as we said in a recent blog, the role and remuneration models for brokers are set for a significant shakedown.
Turning to the ACCC report on mortgage pricing, this was also damming. Back in June 2017, the banks indicated that rate increases were primarily due to APRA’s regulatory requirements, but now under further scrutiny they admitted that other factors contributed to the decision, including profitability. Last December, the ACCC was called on by the House of Representatives Standing Committee on Economics to examine the banks’ decisions to increase rates for existing customers despite APRA’s speed limit only targeting new borrowers. The investigation falls under the ACCC’s present enquiry into residential mortgage products, which was established to monitor price decisions following the introduction of the bank levy. Here are the main points.
Banks raised rates to reach internal performance targets: concern about a shortfall relative to performance targets was a key factor in the rate hikes which were applied across the board. Even small increases can have a significant impact on revenue, the report found. And the majority of existing borrowers would likely not be aware of small changes in rates and would therefore be unlikely to switch.
A shared interest in avoiding disruption: Instead of trying to increase market share by offering the lowest interest rates, the big four banks were mainly preoccupied and concerned with each other when making pricing decisions. It shows a failure in competition (my words).
Reputation is everything: The banks it seems were very conscious of how they should explain changes. As it happens, blaming the regulators provides a nice alibi/
For Profit: Internal memos also spoke of the margin enhancement equating to millions of dollars which flowed from lifting investment loans.
New Loans are cheaper, legacy rates are not. Banks of course are offering deep discounts to attract new customers, funded by the back book repricing. The same, by the way, is true for deposits too.
The Australian Bankers Association “silver lining” statement on the report said they welcomed the interim report into residential mortgages, which clearly shows very high levels of discounting in the Australian home loan market. It’s clear that competition is delivering better deals for customers, shopping around works and Australians should continue to do so to get the best discounts on the advertised rate. But they are really missing the point!
We will see if the final report changes, but if not these are damming, but not surprising, and again shows the pricing power the major lenders have.
So to the question of future rate rises. The FED meets this week, and the expectation is they will lift rates again, especially as the TRUMP tax cuts are inflationary, at a time when the US economy is already firing. In a recent report Fitch Ratings said that Central banks are becoming less cautious about normalising monetary policy in the face of strong growth and diminishing spare capacity. They expect the Fed to raise rates no less than seven times before the end of next year. And while still sounding tentative, the European Central Bank is clearly laying firm groundwork for phasing out QE completely later this year. They now also expect the Bank of England to raise rates by 25bp this year.
Guy Debelle, RBA Deputy Governor spoke on “Risk and Return in a Low Rate Environment“. He explored the consequences of low rates, on asset prices, and asks what happens when rates rise. He suggested that we need to be alert for the effect the rise in the interest rate structure has on financial market functioning, and that investors were potentially too complacent. There are large institutional positions that are predicated on a continuation of the low volatility regime remaining in place. He had expected that volatility would move higher structurally in the past and this has turned out to be wrong. But He thinks there is a higher probability of being proven correct this time. In other words, rising rates will reduce asset prices, and the question is – have investors and other holders of assets – including property – been lulled into a false sense of security?
All the indicators are that rates will rise – you can watch our blog on this. Rising rates of course are bad news for households with large mortgages, exacerbated by the possibility of weaker ability to service loans thanks to fraud, and poor lending practice. We discussed this, especially in the context of interest only loans, and the problems of loan resets on the ABC’s 7:30 programme on Monday. We expect mortgage stress to continue to rise.
There was more discussion this week on Housing Affordability. The Conversation ran a piece showed that zoning is not the cause of poor affordability, and neither is supply of property. Indeed planning reform they say is not a housing affordability strategy. Australia needs a more realistic assessment of the housing problem. We can clearly generate significant dwelling approvals and dwellings in the right economic circumstances. Yet there is little evidence this new supply improves affordability for lower-income households. Three years after the peak of the WA housing boom, these households are no better off in terms of affordability. In part, this may reflect that fact that significant numbers of new homes appear not to house anyone at all. A recent CBA report estimated that 17% of dwellings built in the four years to 2016 remained unoccupied. If we are serious about delivering greater affordability for lower-income Australians, then policy needs to deliver housing supply directly to such households. This will include more affordable supply in the private rental sector, ideally through investment driven by large institutions such as super funds. And for those who cannot afford to rent in this sector, investment in the community housing sector is needed. In capital city markets, new housing built for sale to either home buyers or landlords is simply not going to deliver affordable housing options unless a portion is reserved for those on low or moderate incomes.
But they did not discuss the elephant in the room – booming credit. We discussed the relative strength of different drivers associated with home price rises in a separate, and well visited blog post, Popping The Housing Affordability Myth. But in summary, the truth is banks have pretty unlimited capacity to create more loans from thin air – FIAT – let it be. It is not linked to deposits, as claimed in classic economic theory. The only limit on the amount of credit is people’s ability to service the loans – eventually. With that in mind, we built a scenario model, based on our core market model, which allows us to test the relationship between home prices, and a series of drivers, including population, migration, planning restrictions, the cash rate, income, tax incentives and credit.
We found the greatest of these is credit policy, which has for years allowed banks to magic money from thin air, to lend to borrowers, to drive up home prices, to inflate the banks’ balance sheet, to lend more to drive prices higher – repeat ad nauseam! Totally unproductive, and in fact it sucks the air out of the real economy and money directly out of punters wages, but make bankers and their shareholders richer. One final point, the GDP calculation we use in Australia is flattered by housing growth (triggered by credit growth). The second driver of GDP growth is population growth. But in real terms neither of these are really creating true economic growth. To solve the property equation, and the economic future of the country, we have to address credit. But then again, I refer to the fact that most economists still think credit is unimportant in macroeconomic terms! The alternative is to continue to let credit grow well above wages, and lift the already heavy debt burden even higher. Current settings are doing just that, as more households have come to believe the only way is to borrow ever more. But, that is, ultimately unsustainable, and this why there will be an economic correction in Australia, and quite soon. At that point the poor mortgage underwriting chickens will come home to roost. And next time we will discuss in more detail how these scenarios are likely to play out. But already we know enough to show it will not end well.
Australia has a housing affordability problem. There’s no doubt about that. Unfortunately, one of the reasons the problem has become so entrenched is that the policy conversation appears increasingly confused. It’s time to debunk some policy clichés that keep re-emerging.
Is ‘zoning’ to blame?
It can be tempting to frame the housing affordability problem as all about inadequate new supply. According to this argument, the “demand side” drivers – such as low interest rates and tax incentives for property investment – have combined with population growth in the capital cities to fuel house prices, and new housing construction simply hasn’t kept up.
“Zoning” is often blamed. There is little hard evidence, though, to show systematic regulatory constraint.
Supply is at record highs, and in the right places
According to the cliché, this supply response should have cooled prices. Yet dwelling price inflation has surged even in metropolitan areas where new housing supply has exceeded population growth.
The fallacies of ‘filtering’
One of the great hopes underpinning the supply cliché is that new housing stock improves affordability even if these homes are not affordable for lower-income groups. This faith is based on a theory called “filtering” whereby older housing moves down to the affordable end of the market over time.
The empirical data on filtering are thin. Indeed, the academic literature has historically cast doubt on the theory. However, some commentators continue to claim that American rental housing markets provide evidence that “filtering” can occur in practice.
But whatever might happen in the US, in Australia there’s still no evidence to suggest new housing supply has filtered across the housing stock to expand affordable housing opportunities for low-income Australians, or that it will do so any time soon.
Some commentators cite cooling house prices as evidence that the supply response is taking effect. Whether or not that is so (above and beyond demand-side factors like higher interest rates for investor loans), expect the pipeline to start slowing down. Private sector development is driven by profit and risk and, as we have seen over many years, is characterised by speculative booms and busts.
Developers can turn off the new supply tap much more quickly than they can turn it on. Falling prices, weak consumer sentiment and economic uncertainty mean many developers will not follow through on building approvals until the market recovers.
This means that high levels of supply output are rarely sustained. Recent housing data in Western Australia provide a case in point. WA recorded rising completions in 2014, 2015 and 2016. But 2017 completion figures are expected to show a drop of around a third as prices have shaded off since the end of the mining boom.
Put simply, the market on its own will never solve Australia’s housing affordability problem. Expecting developers to keep building in order to reduce house prices is pure fantasy.
Planning reform is not an affordable housing strategy
They have aimed to: standardise and simplify planning rules; promote mixed use and higher-density housing near train stations; and overcome local political opposition to development through the use of independent expert panels.
Housing targets for both urban infill and new greenfield areas have been a feature of metropolitan plans to drive dwelling approval rates since at least 2000.
These reforms have been effective in overcoming regulatory constraints. The scale of the recent supply response shows clearly that zoning and development assessment processes are not inhibiting residential development approvals in cities like Sydney and Melbourne.
But trying to accommodate Australia’s population growth in towers around railway stations will fail as an affordable housing strategy – even if “zoning” and height rules were completely scrapped.
Rather than narrow deregulation agendas, bigger picture reforms are needed. Aligning infrastructure funding with metropolitan and regional decentralisation is a critical long-term strategy. Reforms to deliver affordable housing in communities supported by new infrastructure are long overdue.
A bigger affordable housing sector is needed
Australia needs a more realistic assessment of the housing problem. We can clearly generate significant dwelling approvals and dwellings in the right economic circumstances. Yet there is little evidence this new supply improves affordability for lower-income households. Three years after the peak of the WA housing boom, these households are no better off in terms of affordability.
In part, this may reflect that fact that significant numbers of new homes appear not to house anyone at all. A recent CBA report estimated that 17% of dwellings built in the four years to 2016 remained unoccupied.
If we are serious about delivering greater affordability for lower-income Australians, then policy needs to deliver housing supply directly to such households. This will include more affordable supply in the private rental sector, ideally through investment driven by large institutions such as super funds. And for those who cannot afford to rent in this sector, investment in the community housing sector is needed.
In capital city markets, new housing built for sale to either home buyers or landlords is simply not going to deliver affordable housing options unless a portion is reserved for those on low or moderate incomes.
Authors: Nicole Gurran, Professor of Urban and Regional Planning, University of Sydney; Bill Randolph, Director, City Futures Research Centre, Faculty of the Built Environment, UNSW; Peter Phibbs, Director, Henry Halloran Trust, University of Sydney; Rachel Ong, Professor of Economics, School of Economics and Finance, Curtin University; Steven Rowley, Director, Australian Housing and Urban Research Institute, Curtin Research Centre, Curtin University
“The current housing affordability crisis is the product of two decades of policy neglect,” HIA Managing Director Shane Goodwin said today.
“It is the core issue that HIA has championed fixing, and is responsible for the affordability challenge facing Australian cities.
“For too long governments have chosen quick fix options to the very long term problem of housing affordability. Australia needs brave and bold policies that go to the heart of the affordability problem,” Mr Goodwin said.
“We need to resume the discussion around tax especially where it cascades applies to land and housing and put an end to upfront taxes that are keeping so many first home buyers out of the market.
“We need to get serious about planning reform, these things are the keys to solving housing affordability which have largely been overlooked by State and Federal Governments.
“We need all tiers of government back at the table, driving these discussions and implementing change.
“HIA has said for a long time now that the problem of housing affordability in simple terms, comes down to supply and demand – more land needs to be freed up, and the punitive taxes like stamp duty that come with buying a home need to be done away with.
“State governments should take on policies like fixing planning rules to allow more homes to be built in inner and middle-ring suburbs of our largest cities, and continue to support the supply of new land around
our cities to achieve the right balance of housing supply.
“It is pleasing that today’s Grattan industry report mirrors HIA call for reform, but HIA cautions against any changes to migration.
“The problem of housing affordability is one of supply and demand – houses will not get built if the population doesn’t grow, and the main driver of population growth in Australia is migration.
“Migration issues aside, HIA is urging State and Federal Governments to get moving on reform, rather than sticking to the current politically safe and largely ineffective measures of dealing with housing affordability,” Mr Goodwin concluded.
A good point, but we also observe that availability of low cost credit, and weak lending standards has also driven affordability lower. This must also be addressed, or else more supply just means bigger debts, and more trouble for households. Time for some joined up thinking!
So much of Australia’s history and success is built on immigration. Migrants have benefited incumbent Australians by raising incomes, increasing innovation, contributing to government budgets, smoothing over population ageing and diversifying our social fabric. But it is also true that immigration is affecting house prices and rents.
Australian governments are squandering the gains from migration with poor housing and infrastructure policies. Our new report, Housing affordability: re-imagining the Australian dream, shows what’s at stake. Unless the states reform their planning systems to allow more housing to be built, the Commonwealth should consider tapping the brakes on Australia’s migrant intake.
Since 2005, net overseas migration – which includes the increase in temporary migrants – has averaged 200,000 people per year, up from 100,000 in the previous decade. It is predicted to be around 240,000 per year over the next few years.
Immigrants are more likely to move to Australia’s big cities than existing residents, which increases demand for scarce urban housing. In 2011, 86% of immigrants lived in major cities, compared to 65% of the Australian-born population.
Chart 1. Migration has jumped, and so have capital city populations
Grattan Institute, Author provided
Not surprisingly, several studies have found that migration increases house prices, especially when there are constraints on building enough new homes.
The pick-up in immigration coincides with Australia’s most recent housing price boom. Sydney and Melbourne are taking more migrants than ever. Australian house prices have increased 50% in the past five years, and by 70% in Sydney.
Chart 2: Net overseas migration into NSW and Victoria is at record levels
Grattan Institute (Data source: ABS 3101.0 – Australian Demographic Statistics), Author provided
Of course immigration isn’t the only factor driving up house prices and rents. Housing also costs more because incomes rose, interest rates fell and banks made it easier to get a loan. But adding 2 million migrants in the past decade has clearly increased how many new homes are needed.
We haven’t built enough homes
Housing demand from immigration shouldn’t lead to higher prices if enough dwellings are built quickly and at low cost. In post-war Australia, record rates of home building matched rapid population growth. House prices barely moved.
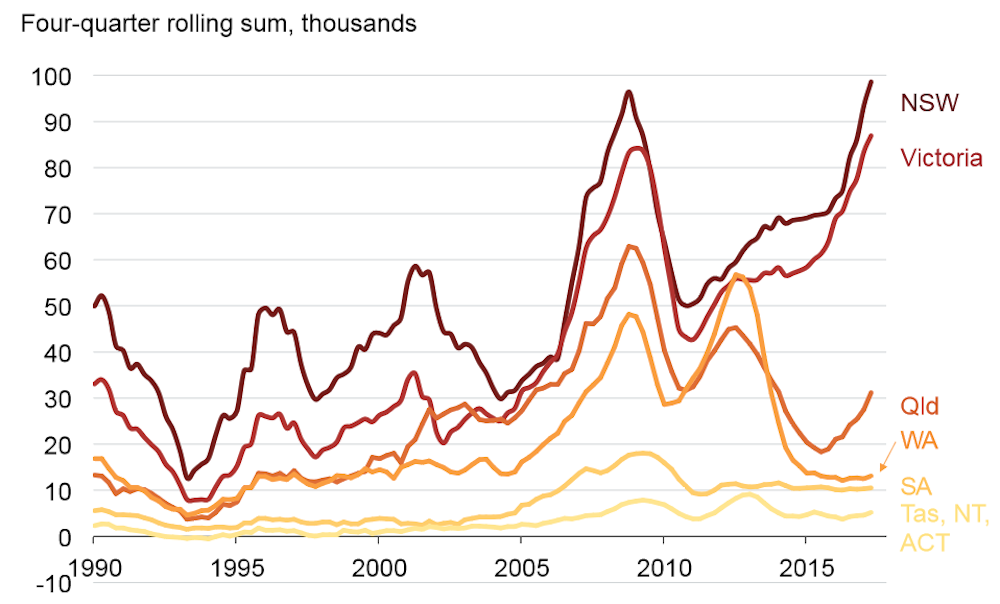
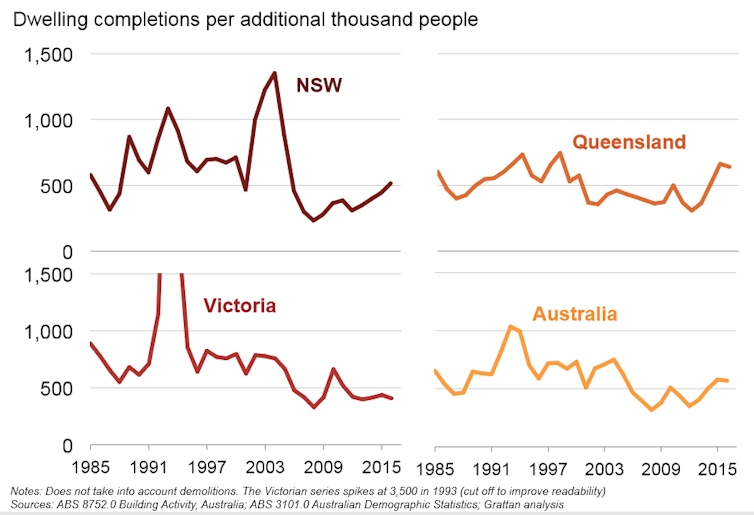
But over the last decade, home building did not keep pace with increases in demand, and prices rose. Through the 1990s, Australian cities built about 800 new homes for every extra 1,000 people. They built half as many over the past eight years.
We estimate somewhere between 450 and 550 new homes are needed for each 1,000 new residents, after accounting for demolitions. And because more families are breaking up and the population is ageing, more homes are needed to accommodate households with fewer members.
Chart 3: Housing construction lagged population in the last decade, but has picked up
Grattan Institute, Author provided
Only in the past couple of years has construction started to match population growth, especially in Sydney. It’s no coincidence that Sydney house prices have finally moderated in the past six months.
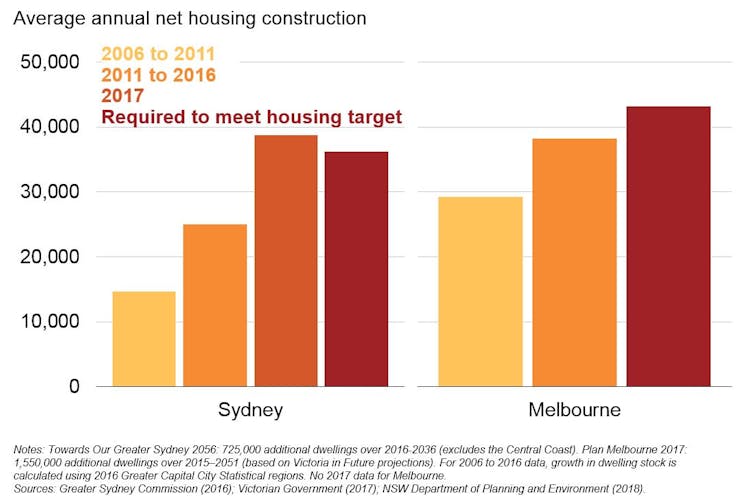
But the backlog of a decade of undersupply remains. Development at today’s record rates is the bare minimum needed to meet record population growth built into Sydney’s and Melbourne’s housing supply targets over the next 40 years.
Chart 4: Strong housing construction will need to be maintained to meet city plan housing targets
Grattan Institute
So what should governments do?
Building more housing will improve affordability the most – but slowly. Even at current record construction rates, new housing increases the stock of dwellings by only 2% each year. But building an extra 50,000 homes a year nationwide for a decade would lead to national house prices between 5% and 20% lower than otherwise. Do it for longer and prices will fall even further.
State governments need to fix planning rules to allow more housing to be built in inner and middle-ring suburbs. More small-scale urban infill projects should be allowed without council planning approval. And state governments should allow denser development “as of right” along key transport corridors. The Commonwealth can help with financial incentives for these reforms.
But the politics of planning in our major cities is fraught. Most people in established middle suburbs already own their houses. Prospective residents who don’t already live there can’t vote in council elections, and their interests are largely unrepresented.
If we want to maintain current migration levels, along with their economic, social and budgetary benefits, we need to do better at planning to allow more housing to be built.
What does this mean for the migrant intake?
The Australian government should develop a population policy, as the Productivity Commission recommended. It should articulate the appropriate level of migration given its economic, budgetary and social benefits and costs. This should include how it affects the Australian community living with the reality of land use planning policy – and contrasting this with the effect of optimal planning policy.
If planning and infrastructure policies don’t improve, the government should consider cutting the migration intake. This would reduce demand for housing, but would also reduce the incomes of existing residents.
The best policy is probably to continue with Australia’s demand-driven, relatively high-skill migration and to build enough homes for the growing population. But Australia is in a world of third-best policy: rapid migration and restricted housing supply are imposing big costs on people who don’t already own their homes. If the states are not going to reform planning rules to increase the number of homes built, then the Australian government should consider whether reducing migration is the lesser evil.
Any reduction should be modest and targeted at the parts of the migration program that provide the smallest benefit to Australian residents and migrants themselves. Balancing these interests is difficult, because each part of the program has different economic, social and budgetary costs and benefits.
Cutting back family reunion visas would have substantial social costs. Limiting skilled migration would hurt the economy and many businesses. Restricting growth in international students would reduce universities’ incomes.
There are also broader costs to cutting the migrant intake. It would hit the Commonwealth budget in the short term. Most migrants are of working age and pay full rates of personal income tax. And many temporary migrants, such as 457 visa holders, can’t draw on a range of government services and benefits, including welfare and Medicare. More importantly, cutting back on younger, skilled migrants is likely to hurt the budget and the economy in the long term.
But there is no point denying that housing affordability is worse because of a combination of rapid immigration and poor planning policy. Rather than tackling these issues, much of the debate has focused on policies that are unlikely to make a real difference. Unless governments own up to the real problems, and start explaining the policy changes that will make a real difference, Australia’s housing affordability woes are likely to get worse.
Authors; John Daley, Chief Executive Officer, Grattan Institute; Brendan Coates, Fellow, Grattan Institute; Trent Wiltshire, Associate, Grattan Institute