Pin The Tale (Yes, I Do Mean Tale), On The Home Price Donkey…

CoreLogic reported that their national Home Value Index (HVI) rose 8.1% in 2023, a significant turnaround from the 4.9% drop seen in 2022, but well below the 24.5% surge recorded in 2021. December’s 0.4% increase saw 2023 finish with a relatively soft monthly rise in home values.

Despite the annual 8.1% increase, the year was punctuated by diversity , with the annual change in housing values ranging from a 15.2% surge in Perth to a 1.6% fall across regional Victoria.

So now of course, the question is what will happen in 2024. Last week I made two shows for the channel, one on the top 5 elements supporting home price growth in 2024 and the other on the top five elements which could drive prices lower.

If you take, low supply, high demand, easing lending, Government support and RBA/APRA stability concerns, the potential for home prices, especially houses to rise in 2024 seems pretty strong. On the other hand, the risks from higher unemployment or a recession, the exit of property investors, higher delinquency and defaults, higher mortgage rates for longer, and dire housing affordability are all reasons why prices could fall in 2024.

To make an assessment of what will play out, you then have to do is to weigh the relative influence of each of these forces, against an unstable local and global economic environment.

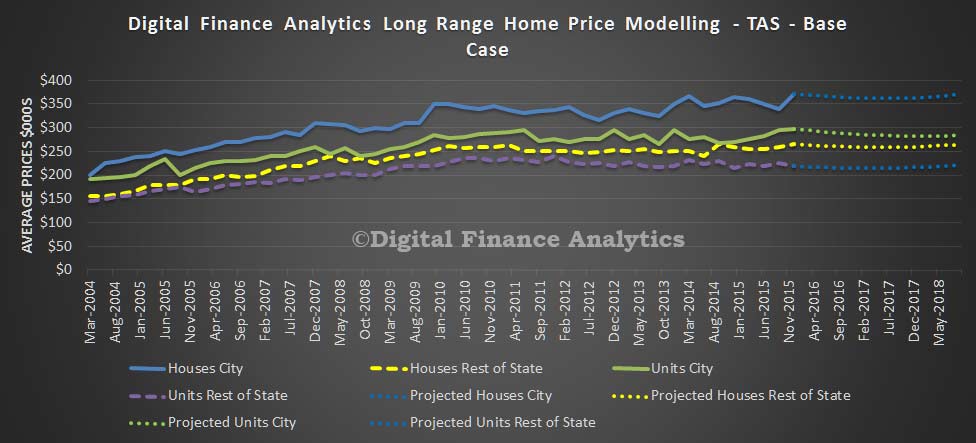
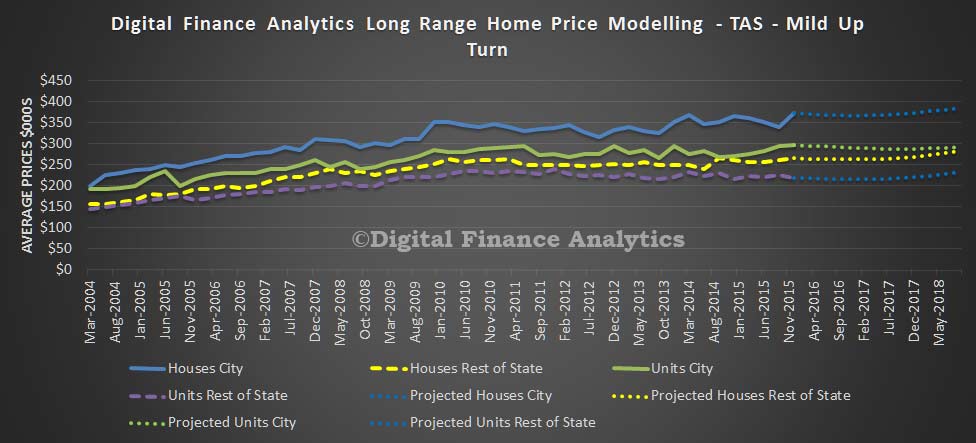
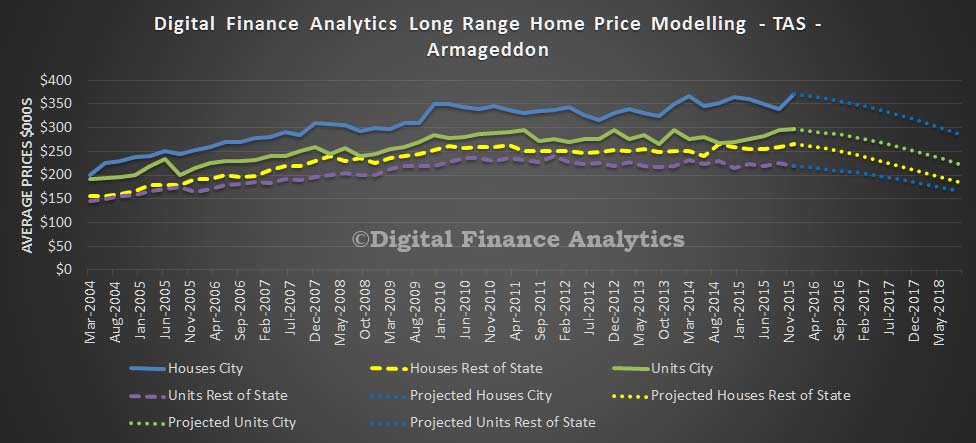
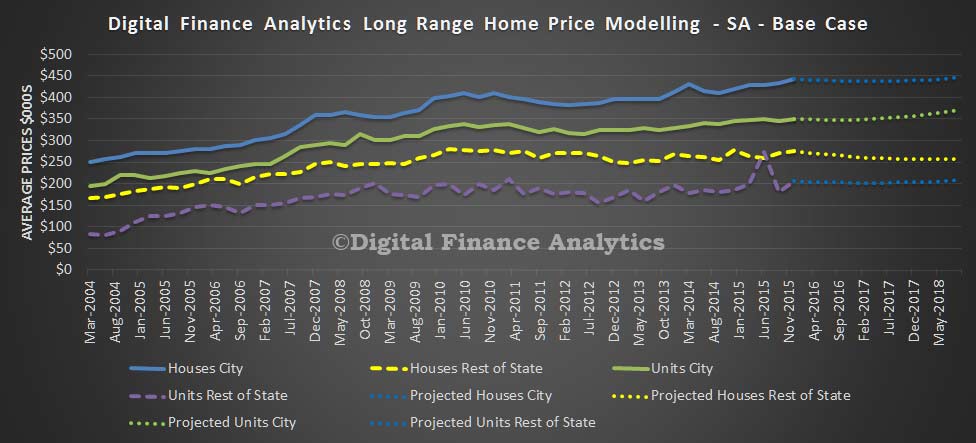
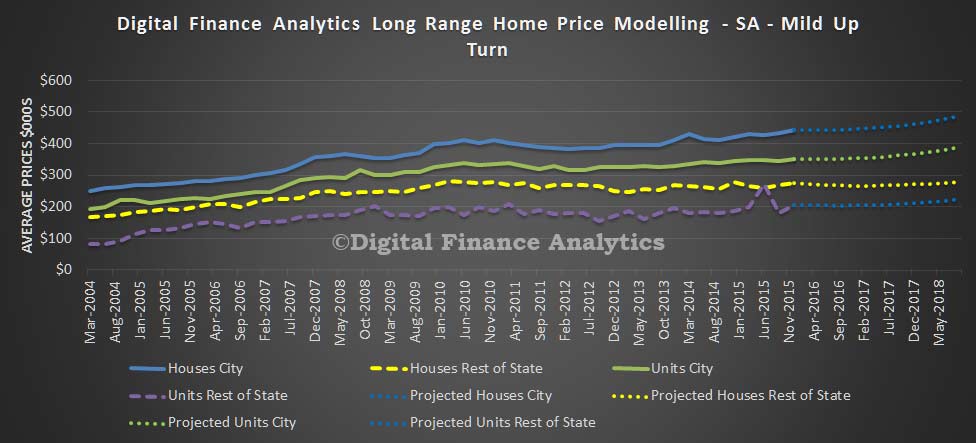
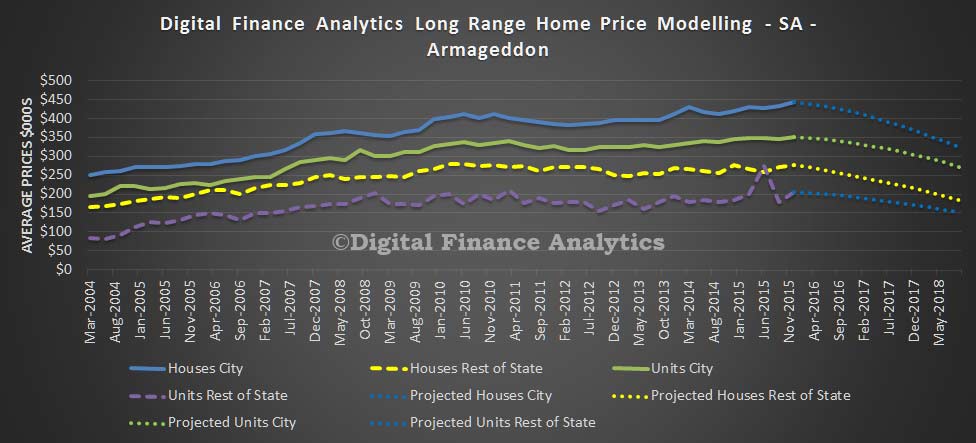
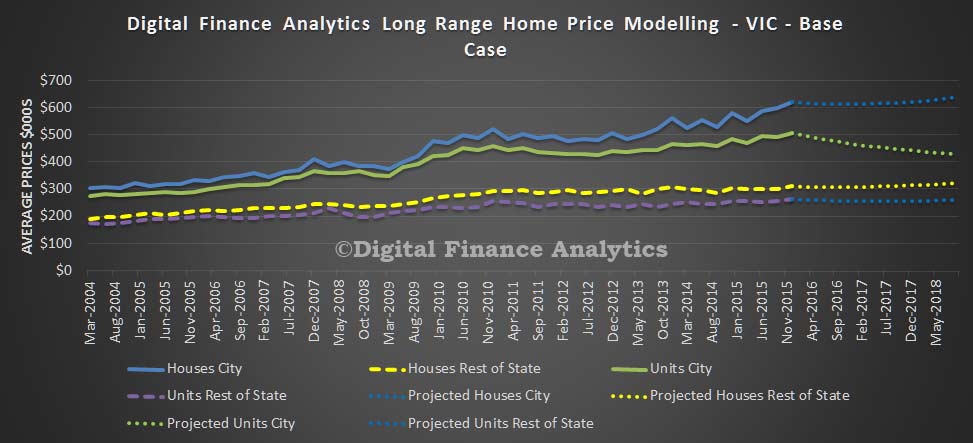
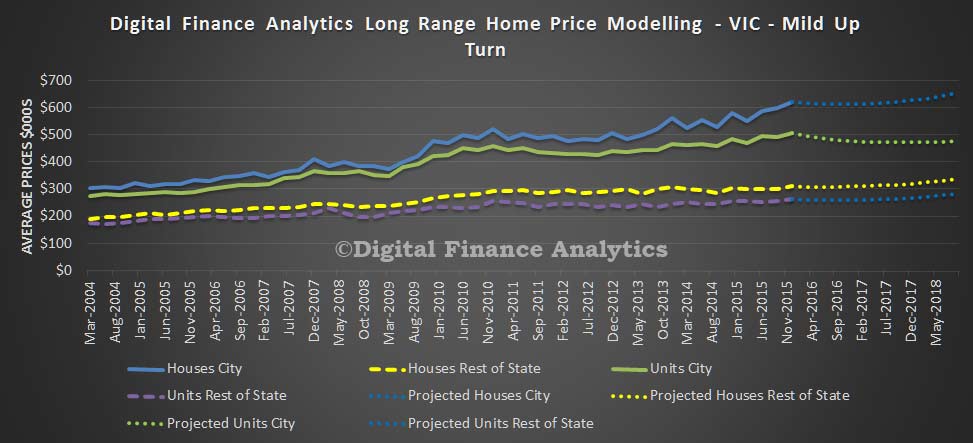
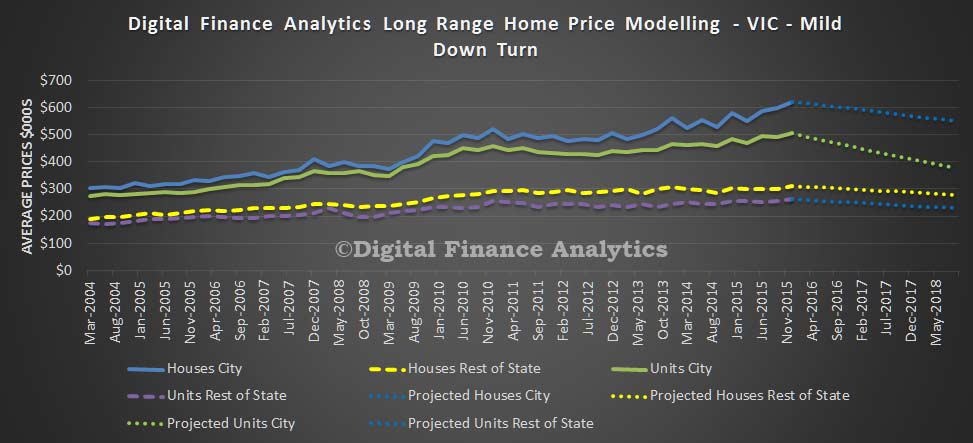
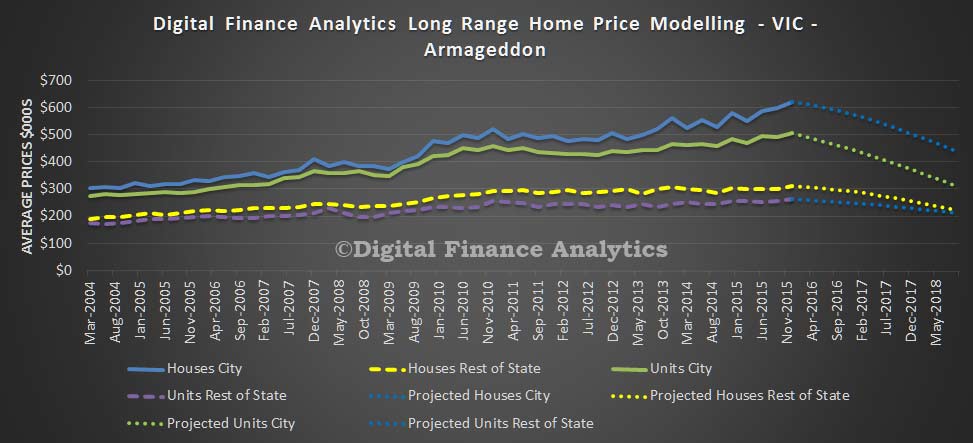
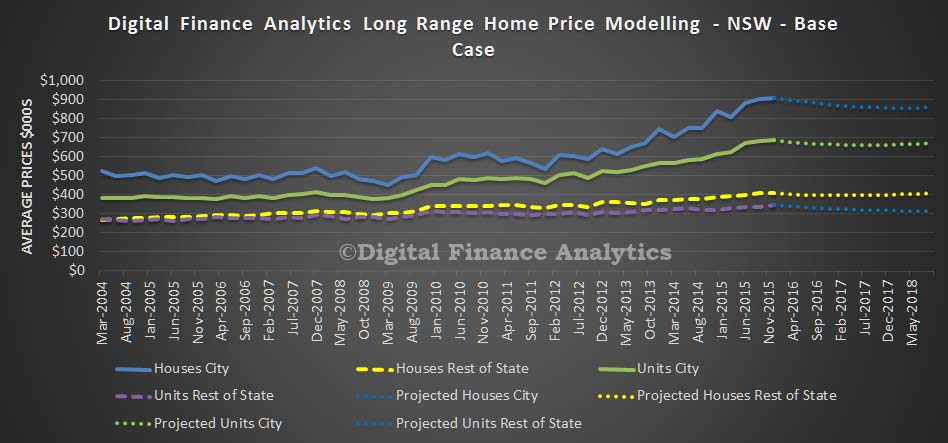
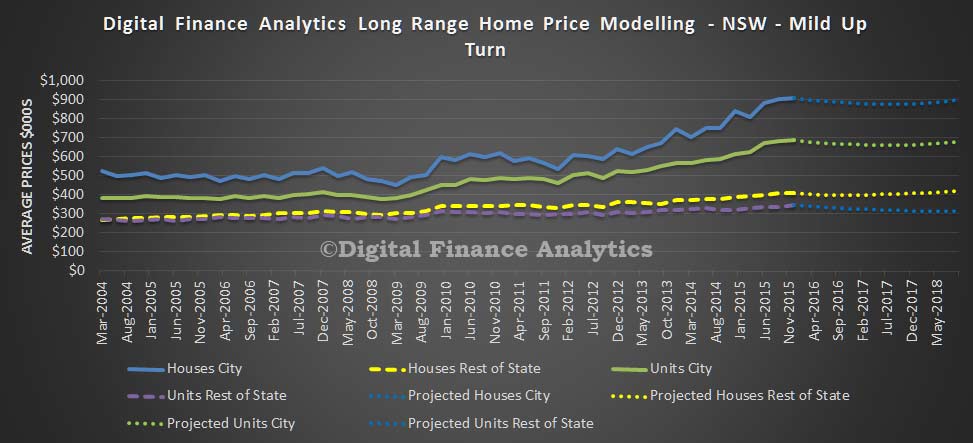
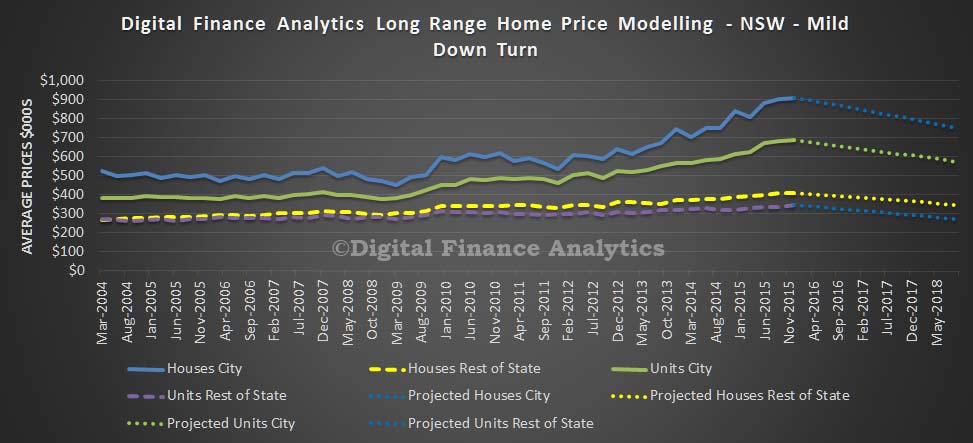
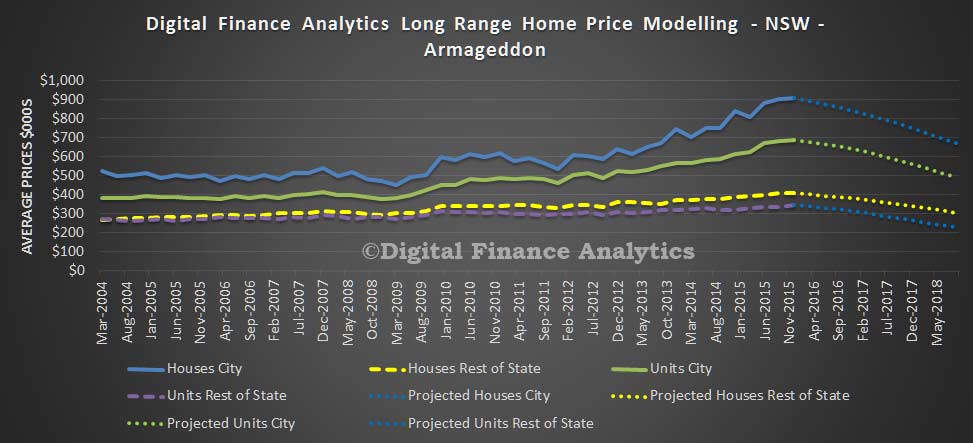
This is something we model dynamically, in our Core Market Model, which incorporates all these elements and delivers scenarios at a post code level for houses and units.

In comparison, the AFR published estimates from a panel of 10 property market experts and economists. Overall, they take a more sober view on growth prospects for the housing market, with most tipping gains of somewhere between 1 and 5 per cent. The most optimistic prediction is for house price gains of up to 8 per cent, while the most bearish forecast is for prices to fall nationally by as much 5 per cent.

Last year’s “very unusual supply and demand dynamics” are expected to normalise in 2024, according to Barrenjoey chief economist Jo Masters, who is tipping 4.8 per cent growth nationally. Sydney house prices could rise by 3.8 per cent, with Melbourne up 3.2 per cent and Brisbane 5.9 per cent.

“Importantly, we think borrowing capacity will re-emerge as a key constraint on demand,” she told AFR Weekend in a quarterly property survey.

Trying to pin the tail on the property price donkey, is fraught with difficulty, because of the uncertainty in the system – one reason why I run scenarios, and why the specific tale you prefer will influence your expectation of price movements.

http://www.martinnorth.com/

Go to the Walk The World Universe at https://walktheworld.com.au/

Today’s post is brought to you by Ribbon Property Consultants.

Digital Finance Analytics (DFA) Blog
Pin The Tale (Yes, I Do Mean Tale), On The Home Price Donkey…
Loading
/

Australian house prices won’t have a US-style collapse, but they will fall

From Business Insider.

There has been much talk lately about loose lending standards in Australian banking.

We’ve had an exposition of lending practices in Western Sydney by hedge fund manager John Hempton and Jonathan Tepper from Variant Perception and we’ve had revelations of problems with offshore borrowers’ income verification at the major banks.

But, believe it or not, it is Australian lending standards which Paul Dales, Capital Economics’ chief economist for Australia and New Zealand, says will protect the local housing market from a US-style collapse in prices.

Dales says, “lending conditions during the good times have not been as loose as in America and Australian banks are better placed to cope with the bad times”.

But while a US-style collapse isn’t likely to happen, Dales says prices will stagnate for a couple of years before “house prices in Australia will fall outright in both 2019 and 2020”.

Dales says that it’s easy to say the “Australian housing market looks even more vulnerable to a large fall in prices than the US market did before prices there fell by 30% during the GFC” given the “350% rise in prices since 1990 eclipses the 140% rise in the US before its bubble burst”.

But again he says it’s lending standards which will hold Australian housing in good stead.

“The extent of the excess in Australia isn’t as large as lending standards aren’t as loose,” he says. “For example, just 9% of loans in Australia are being issued to borrowers with a deposit of less than 10%. At the peak of the US boom, it was 29%. And the outstanding value of mortgages that are similar to America’s subprime loans is 2% in Australia.

“In the US, the share peaked at 14%.”

No crash then.

It would have already happened, Dales says, if it was going to be in a similar vein to the US housing collapse. But prices are vulnerable given their elevated levels compared to incomes with the catalyst the RBA when it eventually raises rates.

But Dales, who was the first to call this easing cycle the RBA is currently undertaking back in 2015, says “that trigger won’t be pulled until 2018 at the earliest”.

The reason an RBA move is the smoking gun to knock house prices lower is because of Australia’s high debt levels which means, “interest payments are already absorbing a large share of household income even though interest rates are at a record low. As and when rates rise, that burden will grow and may be too much to bear for those borrowers without funds saved in offset mortgage accounts”.

Dales says interest-only borrowers are particularly vulnerable when it comes time to start repaying principal once rates rise.

Overall though, in the context of the rise in prices in the past 20 years, Dales’ expectation about the fall in prices is relatively mild and should overly trouble the economy, or economic outlook given RBA rate rise should be accompanied by an accelerated economic expansion.

“Overall, we doubt that national house prices will rise much over the next few years and, if interest rates rise in 2018, prices may fall by about 10% over 2019 and 2020,” he says.

“Any price fall will be smaller than the 30% drop in the US, though, mainly as the relative health of Australian banks will prevent a US-style spiral of large loan losses leading to a severe credit crunch and yet more losses.”

Where To With Hobart Home Prices?

As we continue our state by state scenario analysis – read about our assumptions here – we look at Tasmania. Given the low transaction volumes, our results will be more noisy. That said, in our base case to mid 2018, we expect to see the average house price in Hobart fall by 0.2% to $371,000 and the average unit price in Hobart fall by 4.1% to $285,000. In the regional areas, the average house price will fall by 0.3% to $264,000 and units will rise 0.8% to $221,000.

TAS-Apr-2016---BaseIf economic activity picks up to mid 2018, we expect to see the average house price in Hobart rise by 3.6% to $385,000 and the average unit price in Hobart fall by 1.9% to $291,000. In the regional areas, the average house price will rise by 6.6% to $283,000 and units will rise 5.7% to $231,000.

TAS-Apr-2016---UpIf economic activity slows to mid 2018, we expect to see the average house price in Hobart fall by 11.3% to $329,000 and the average unit price in Hobart fall by 16.2% to $249,000. In the regional areas, the average house price will fall by 13.3% to $230,000 and units will fall 13.4% to $190,000.

TAS-Apr-2016---DownIf economic activity falls significantly to mid 2018, we expect to see the average house price in Hobart fall by 23.0% to $286,000 and the average unit price in Hobart fall by 24.6% to $224,000. In the regional areas, the average house price will fall by 30.3% to $185,000 and units will fall 23.7% to $167,000.

TAS-Apr-2016---Fall

Where To With Adelaide Home Prices?

As we continue our state by state analysis, today we look at South Australia.

In our base case to mid 2018, we expect to see the average house price in Adelaide rise by 0.8% to $446,000 and the average unit price in Adelaide rise by 5.9% to $371,000. In the regional areas, the average house price will fall by 7.0% to $256,000 and units will rise 1.1% to $208,000.

SA-Apr-2016---BaseIf economic activity picks up to mid 2018, we expect to see the average house price in Adelaide rise by 9.9% to $487,000 and the average unit price in Adelaide rise by 10.7% to $387,000. In the regional areas, the average house price will rise by 1.4% to $279,000 and units will rise 8.8% to $224,000.

SA-Apr-2016---UpIf economic activity slows to mid 2018, we expect to see the average house price in Adelaide fall by 10.3% to $397,000 and the average unit price in Adelaide fall by 7.1% to $325,000. In the regional areas, the average house price will fall by 18.1% to $226,000 and units will fall 11.9% to $182,000.

SA-Apr-2016---DownIf economic activity falls significantly to mid 2018, we expect to see the average house price in Adelaide fall by 26.7% to $324,000 and the average unit price in Adelaide fall by 22.2% to $272,000. In the regional areas, the average house price will fall by 33.1% to $184,000 and units will fall 25.8% to $153,000.

SA-Apr-2016---Fall  A reminder. This modelling is wrong, but is designed to illustrate the relative sensitivities in different scenarios!


Where to With Melbourne Home Prices?

Continuing our econometric modelling of home prices trends, today we examine Melbourne. As we discussed our model takes account of a range of factors and runs a series of future scenarios out to mid 2018.  We look at prices both within Melbourne and also across the state and split the analysis into houses and units.

In our base case to mid 2018, we expect to see the average house price in Melbourne rise by 2.8% to $639,000 and the average unit in Melbourne fall by 15.1% to $429,000. In regional areas, the average house price will rise 3.5% to $321,000 and units will fall by 0.4% to $260,000. The oversupply of units in the CBD explain the projected price falls.

VIC-APril-2016---BaseIf economic momentum becomes stronger, to mid 2018, the average house price in Melbourne will rise by 5.1% to $653,000 and the average unit in Melbourne will fall by 5.7% to $476,000. In regional areas, the average house price will rise 3.4% to $337,000 and units will rise by 7.9% to $282,000. The rise in Melbourne will continue despite lower demand for investment property and static incomes. Over supply of units in the CBD will depress unit prices.

VIC-April-2016---UpturnIf economic momentum falls, to mid 2018, we expect to see the average house price in Melbourne fall by 11.6% to $549,000 and the average unit in Melbourne fall by 25.2% to $378,000. In regional areas, the average house price will fall 10.6% to $277,000 and units will fall by 12.6% to $228,000. In this scenario, growth remains low, unemployment moves higher, incomes remain flat, and demand for property slows.

VIC-April-2016---Mild-DownIf economic momentum falls significantly, to mid 2018, we expect to see the average house price in Melbourne fall by 29.2% to $439,000 and the average unit in Melbourne fall by 38.4% to $311,000. In regional areas, the average house price will fall 28% to $223,000 and units will fall by 18.8% to $221,000. In this scenario, cash interest rates are cut further, unemployment rises, income falls in real terms, and demand for property falters.   This is our Armageddon scenario.

VIC-April-2016---SevereeWe see that the main area of risk centres on units in Melbourne, especially those within the CBD and surrounds. Supply is rising fast, at a time when demand is not matched.

And a caveat, this modelling will be wrong, but it does give an indication of relative sensitives. Next time we will look at Brisbane and QLD.

Econometric House Price Modelling

Given the near $6 trillion of residential real estate, and the near $1.6 trillion of loans on these properties, future house price dynamics are important for households, banks, regulators and the wider economy. So it is worth thinking about where house prices might go. There is no rule that house prices can only rise. In the US they fell up to 40% and in the UK up to 25% post the GFC. Domain today reported falls in many states in the past few months.  In Australia, prices are way above long term trends.

Any modelling of future outcomes will be wrong. However we have been developing an econometric model which draws current data from our segmented household surveys and using a range of relationships we seek to estimate average house and unit prices by state, for properties in the main urban areas, and separately in the regional areas. Averages across Australia mask too many differences to be useful. Having used the model to track events over the past year, we feel confident enough of the algorithms to share some of the results.  But to stress, this model is only a guide, and its results are wrong!!

Our point of departure is data from the ABS on house and unit prices. We overlay our survey data with a range of factors to drive our modelling from a range of sources. These include:

  • Supply of property by type (building approvals and construction)
  • Demand for property by type (from the DFA survey)
  • Population growth and demography (combination of DFA survey and ABS)
  • Income growth (from ABS)
  • Unemployment rate (from ABS)
  • Inflation rate (from ABS)
  • GDP Growth rate (from ABS)
  • Demand for finance (from the survey)
  • Supply of finance (RBA and ABS data)
  • Interest rates (RBA)
  • Mortgage interest margins (RBA and DFA analysis)
  • Mortgage underwriting interest rate floors (APRA)
  • Choice modelling between investment types (DFA survey)
  • Choice modelling between property types (DFA survey)
  • Tax breaks (DFA survey and ATO)
  • Mortgage default rates (Various, including DFA survey)
  • Lender mortgage write-downs (Company results)
  • Penetration of Lenders Mortgage Insurance (DFA surveys and analysis)

We have six scenarios:

  • Strong recovery
  • Mild up turn
  • Base case (no changes from current settings)
  • Mild down turn
  • Severe down turn
  • Armageddon

Over the coming days we will discuss some of the initial analysis we have completed.  Today, we look at NSW.

In our base case to mid 2018, we expect to see the average house price in Sydney fall by 5.5% to $860,000 and the average unit in Sydney fall by 1.2% to $400,000. In regional areas, the average house price will fall 2.5% to $395,000 and units will fall by 10.6% to $309,000.

NSW-Base-April-2016If economic momentum becomes stronger, to mid 2018, the average house price in Sydney will still fall a little, by 1.4% to $897,000 and the average unit in Sydney will fall by 1.1% to $677,000. In regional areas, the average house price will rise 3.3% to $418,000 but units will fall by 9.3% to $313,000. The falls in Sydney will continue given the previous strong run, lower demand for investment property and static incomes.

Upside-NSW-Apr-2016If economic momentum falls, to mid 2018, we expect to see the average house price in Sydney fall by 17.5% to $751,000 and the average unit in Sydney fall by 16.3% to $573,000. In regional areas, the average house price will fall 14.6% to $346,000 and units will fall by 21.9% to $269,000. In this scenario, growth remains low, unemployment moves higher, incomes remain flat, and demand for property slows.

NSW-April-2016-DOwnturnIf economic momentum falls significantly, to mid 2018, we expect to see the average house price in Sydney fall by 26.1% to $672,000 and the average unit in Sydney fall by 28.4% to $490,000. In regional areas, the average house price will fall 25.2% to$303,000 and units will fall by 34.5% to $226,000. In this scenario, cash interest rates are cut further, unemployment rises, income falls in real terms, and demand for property falters.   This is our Armageddon scenario.

NSW-APirl-2016---CrashOur conclusion is that in NSW, there is more down side than upside in property at the moment and this will continue for some time to come. How severe the correction will be depends on the economic and growth outcomes.

Results are rather different in other states, and we will explore these scenarios in the next few days.