Tweaking Owner Occupied and Investor Loans

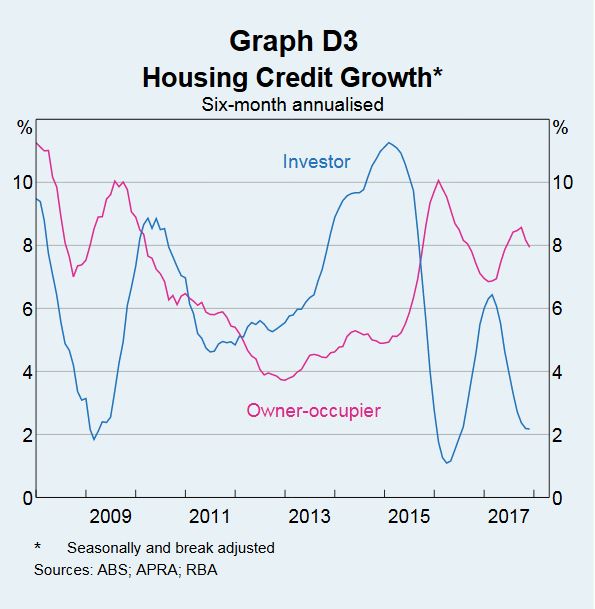
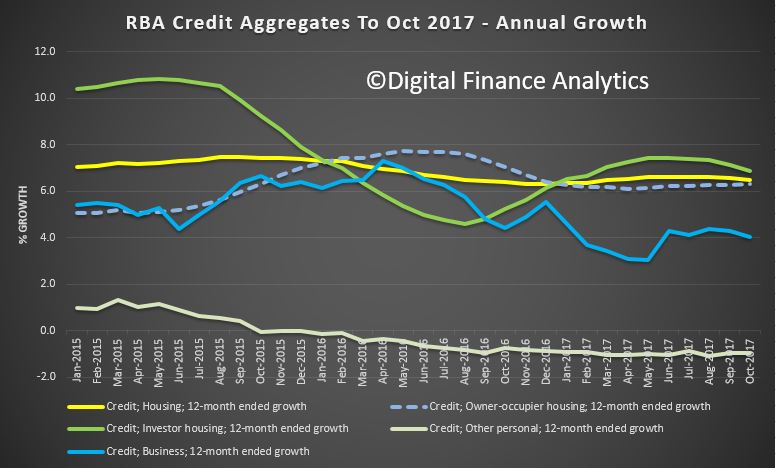
The RBA published their Statement on Monetary Policy today.  The key themes were foreshadowed yesterday, but there was in interesting side discussion on the housing  loans data. They says  it now appears unnecessary to adjust the published growth rates to undo the effect of regular switching flows between owner occupied and investment loans.  So now investor loan growth on a 6 month basis has been restated to just 2%. More fluff in the numbers!

Developments in investor and owner-occupier housing credit have attracted considerable attention in recent years. The RBA publishes these data as part of Australia’s Financial Aggregates on a monthly basis.

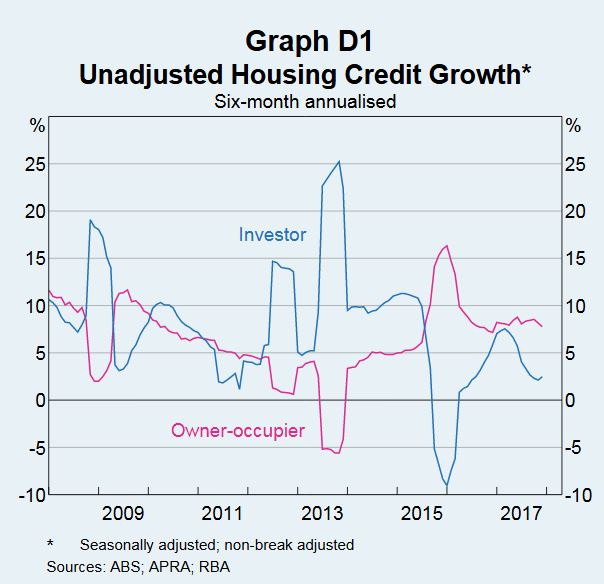
Measuring the Level and Growth Rate of Housing Credit

The Financial Aggregates statistical release contains data on the levels of credit extended by financial intermediaries to Australian businesses and households, including the levels of investor and owner-occupier housing credit. Sometimes, factors other than demand and supply can affect the growth of these series (Graph D1). Examples include changes in the availability of data from lenders, or changes arising from lenders reporting a reclassification of investor and owner occupier loans at a particular time. Each month, based on information provided by institutions, the RBA makes an assessment about whether any of the changes in the unadjusted data are being driven by such reporting changes. The RBA publishes growth rates adjusted to remove the effect of these breaks in order to aid the interpretation of the underlying growth in credit.

Switching Between Investor and Owner-occupier Housing Loans

In mid 2015, some banks decided to introduce interest rate differentials between investor and owner-occupier housing loans in response to regulatory measures. For a few months thereafter, a large amount of outstanding housing credit was reported as having switched from investor to owner-occupier (Graph D2).

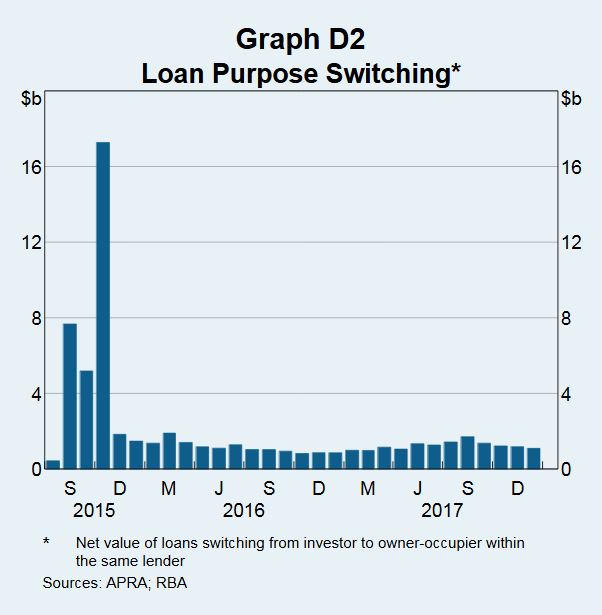
While the published growth rates for total housing credit were not affected by this switching, it had a substantial effect on the unadjusted growth rates of investor and owner-occupier credit. It was considered likely that many of these loans had switched purpose at some earlier date. But there was a greater incentive to report such switches after the pricing differential came into effect. So a decision was made to adjust the published growth rates for investor and owner-occupier credit to remove the effect of this switching.

Following the large amount of switching that initially occurred around the second half of 2015, the amount of switching each month has decreased significantly and appears to have been relatively stable for some time now. Indeed, these flows appear to reflect consistent behaviour that occurs from month to month. As a result, it now appears unnecessary to adjust the published growth rates to undo the effect of these regular switching flows. Accordingly, henceforth, adjustments for switching flows will only be applied to the growth figures over the period from mid to late 2015 when reported switching was unusually large, but not thereafter. The resulting break-adjusted growth rates are shown in Graph D3. Additionally, the RBA will publish data on aggregate switching flows to assist with the understanding of this switching behaviour.

Mortgage Growth Only Easing A Bit: A Policy Vacuum

The latest data from the RBA, to end October 2017 ,  shows that lending for housing rose 0.5% in the month, and 6.5% for the past year (three times inflation!).  Lending to business rose 0.3% to 4% over the past year and personal credit was flat, and fell 0.9% over the past year. Another $1.2 billion of housing loans were reclassified in the month, making $60 billion in total, this is more than 10% of the total investment loan book! The proportion of investor loans fell slightly again, down to 34.2% of portfolio

Total mortgage lending is now above $1,7 trillion, with owner occupied loans up 0.6% or $6.6 billion to $1.12 trillion, and investor loans up 0.2% or $1.2 billion to $584 billion. Comparing this with the APRA data, out today, we see continued relative growth in the non-bank sector.

Here is the monthly growth plots, which even seasonally adjusted are noisy.   The smoother annual plots shows a slowing trend across the mortgage sector, but with investor sector still growth at 6.9%, ahead of the owner occupied sector at 6.5%, or business at 4%.  Further evidence the settings are wrong.

There is simply no excuse to allow home lending to be running at more than three times inflation or wage growth at the current dizzy price and leverage levels.  Still too much focus on home lending and not enough on productive growth enabling business lending. This is something which the Royal Commission is unlikely to touch, as it is a policy, not a behaviourial issue.

The RBA says:

Following the introduction of an interest rate differential between housing loans to investors and owner-occupiers in mid-2015, a number of borrowers have changed the purpose of their existing loan; the net value of switching of loan purpose from investor to owner-occupier is estimated to have been $60 billion over the period of July 2015 to October 2017, of which $1.2 billion occurred in October 2017. These changes are reflected in the level of owner-occupier and investor credit outstanding. However, growth rates for these series have been adjusted to remove the effect of loan purpose changes.

Total Housing Lending Still Powering On

Today the RBA released their financial aggregates for April.  Total credit grew by 0.4%, or 4.9% over the past year. Housing lending rose 0.5%, or 6.5% over the past year, personal credit fell by 0.1% or 1.5% in the past 12 months, and business lending rose 0.4% or 3.1% over the past year.

There was $1.1 bn of mortgages switched between investment and owner occupation categories in the month.

The 12 month view shows investor lending still accelerating, whilst business lending and other personal credit continues lower.

The more volatile measures shows a fall in housing lending and a rise in business lending.

The aggregates show total housing was $1.66 trillion, up 0.5% of $8.1 billion.  Within that owner occupied loans rose 0.55% of $6 billion and investor loans grew 0.36% or $2.1 billion.

The proportion of lending to productive business fell again, so housing lending is still dominating the scene to the detriment of the broader economy and sustainable long term growth.

The RBA noted:

Following the introduction of an interest rate differential between housing loans to investors and owner-occupiers in mid-2015, a number of borrowers have changed the purpose of their existing loan; the net value of switching of loan purpose from investor to owner-occupier is estimated to have been $52 billion over the period of July 2015 to April 2017, of which $1.1 billion occurred in April 2017. These changes are reflected in the level of owner-occupier and investor credit outstanding. However, growth rates for these series have been adjusted to remove the effect of loan purpose changes.