Household Finance Confidence Continues To Fall

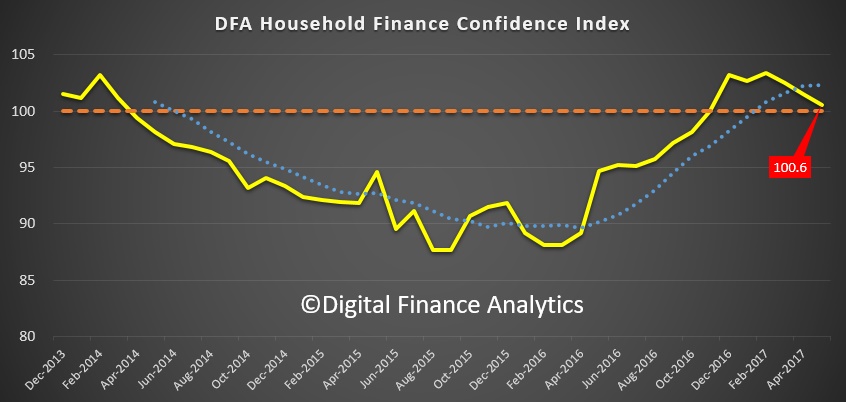
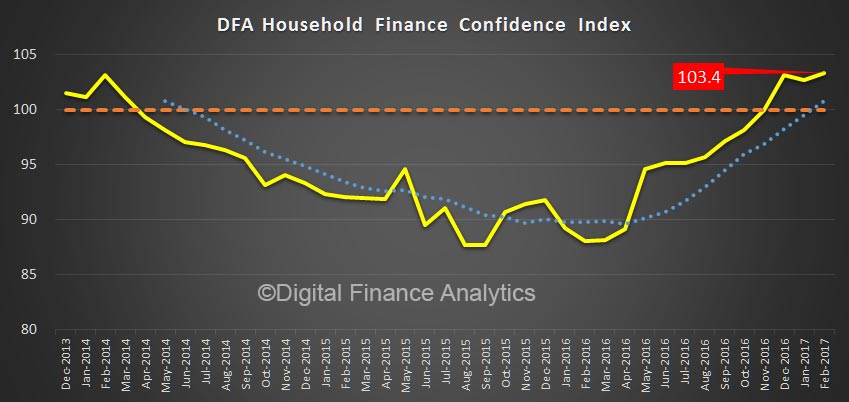
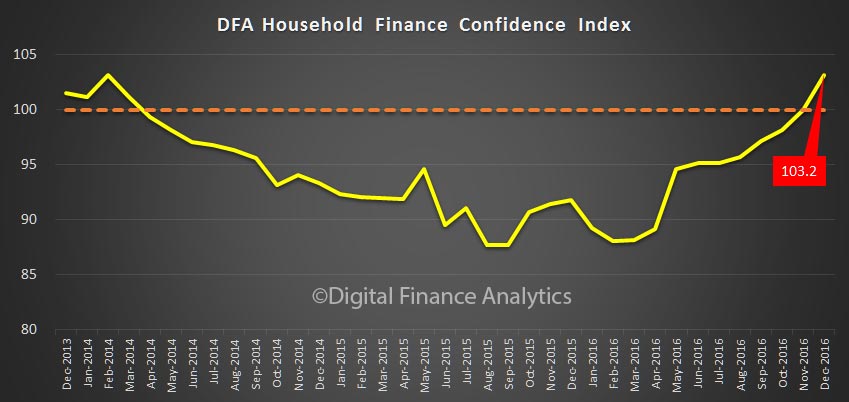
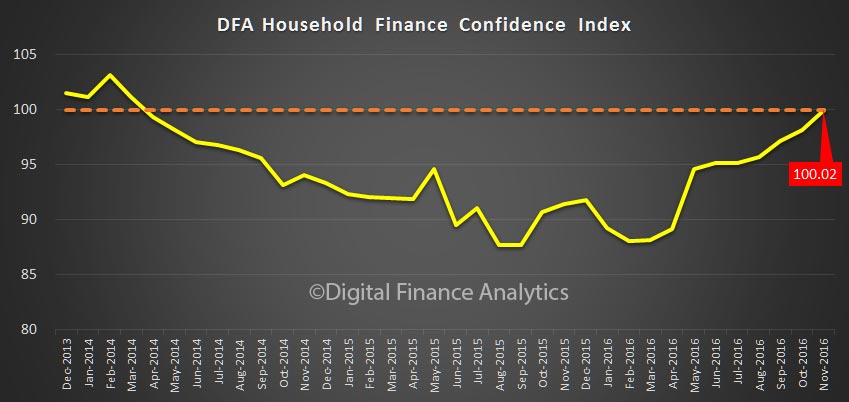
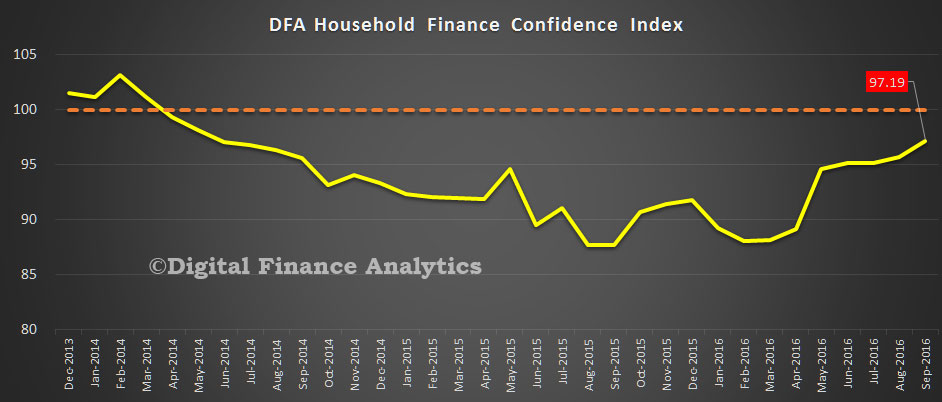
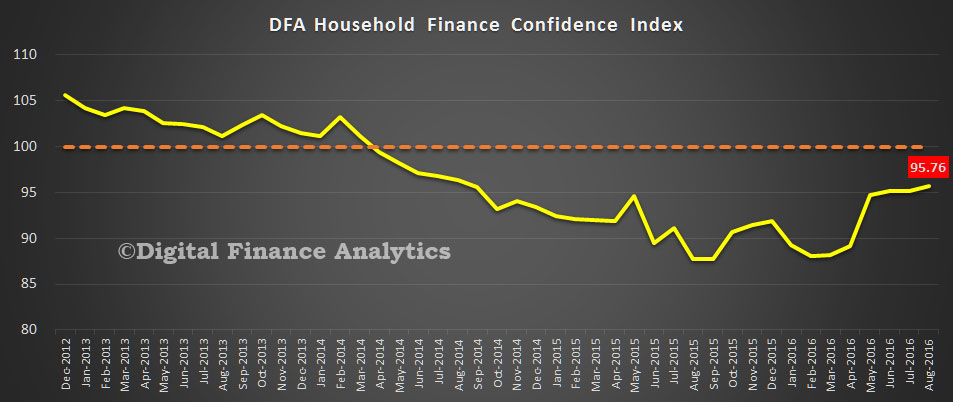
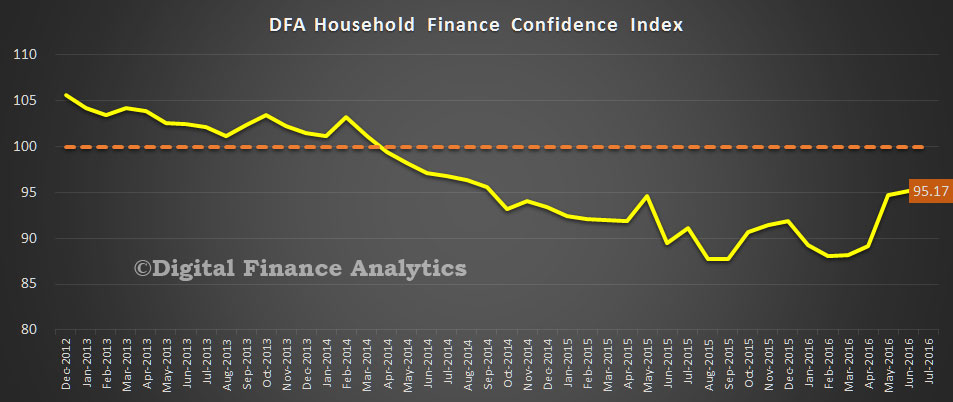
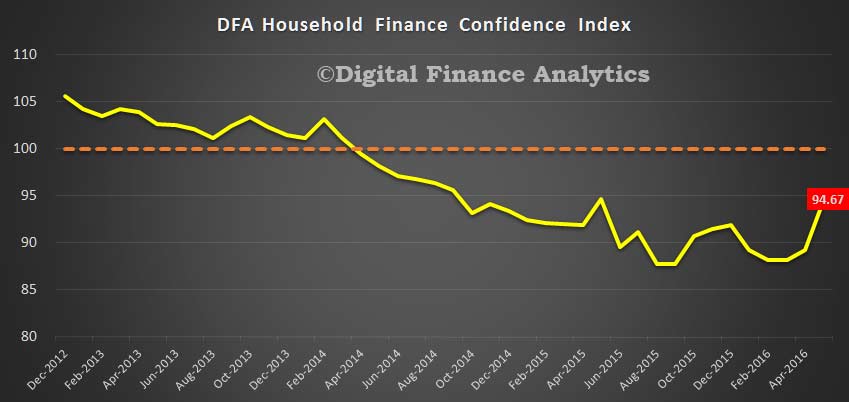
Digital Finance Analytics has released the July results from our Household Finance Confidence Index, which shows a further fall, with momentum decaying.

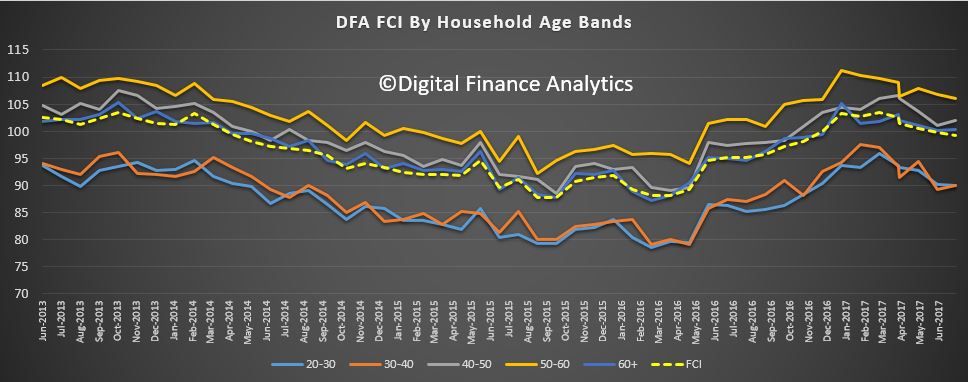
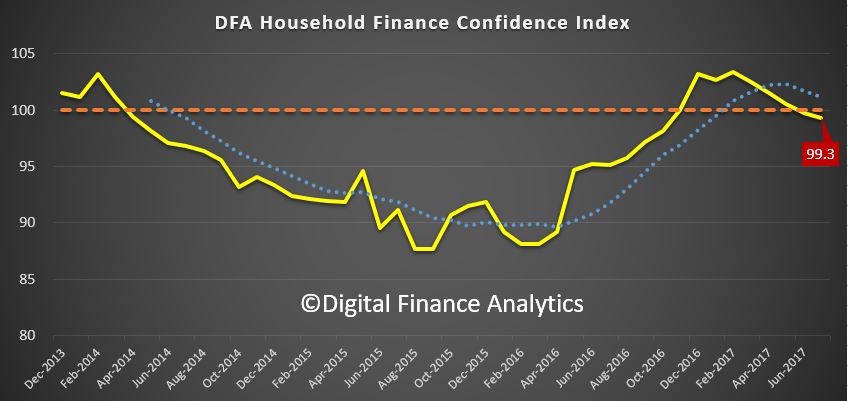
The average score was 99.3, down from 99.8 last month and below the neutral setting. However, the average score masks significant differences across the dimensions of the survey results. For example, younger households are considerably more negative, compared with older groups.

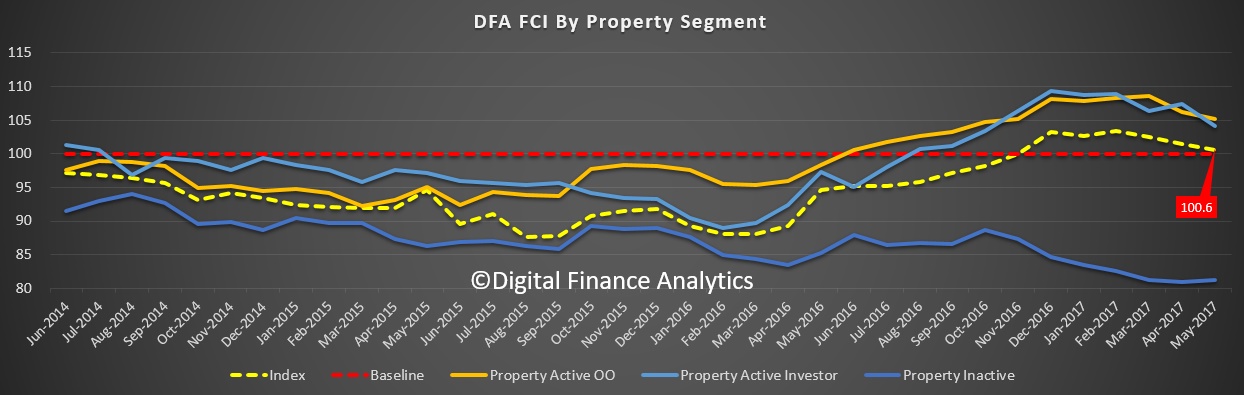
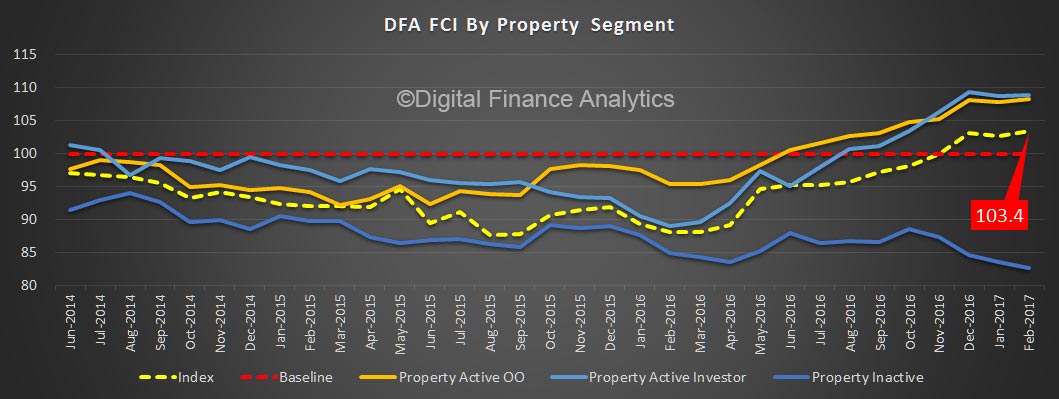
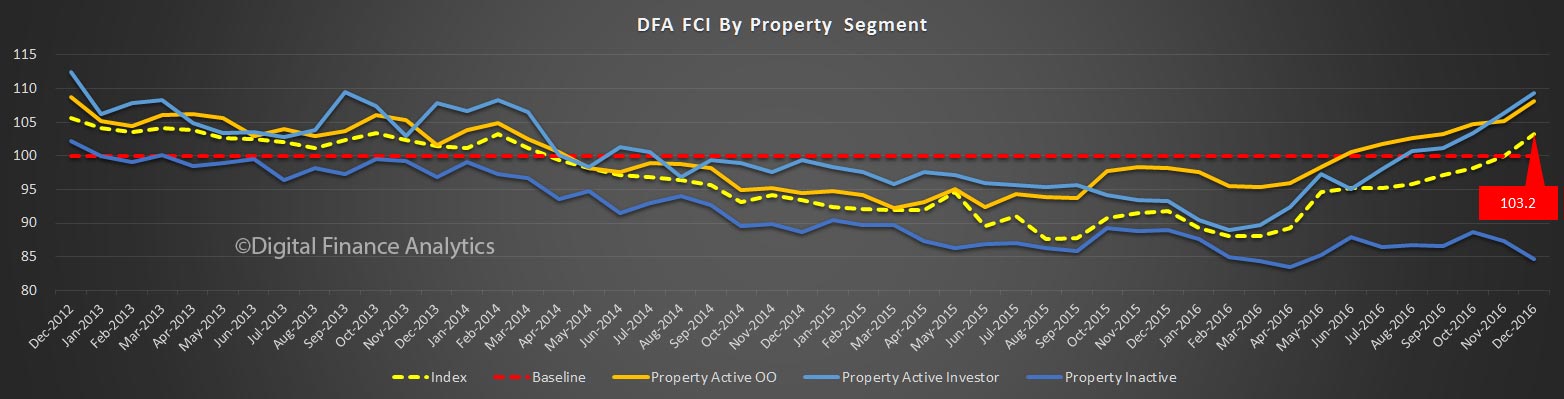
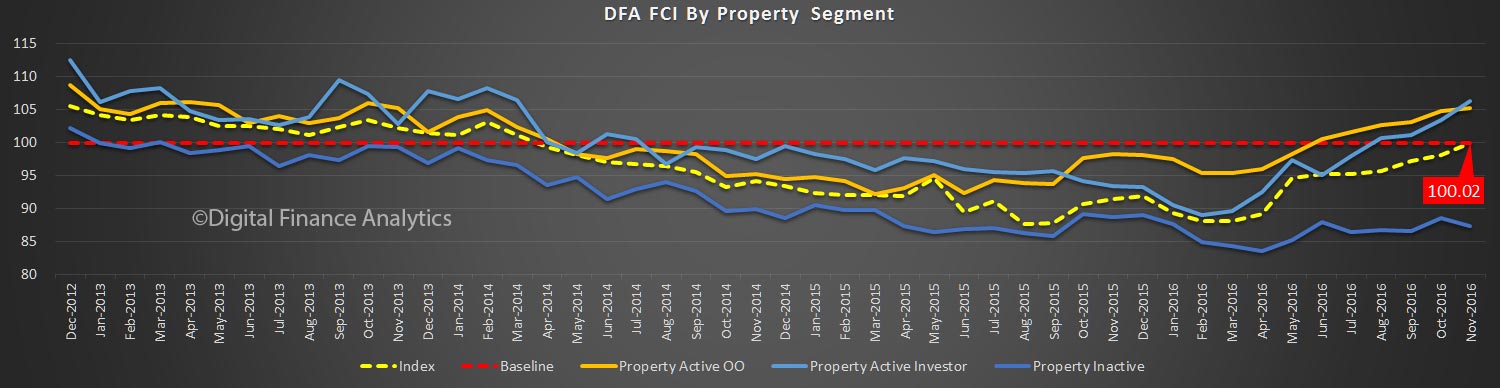
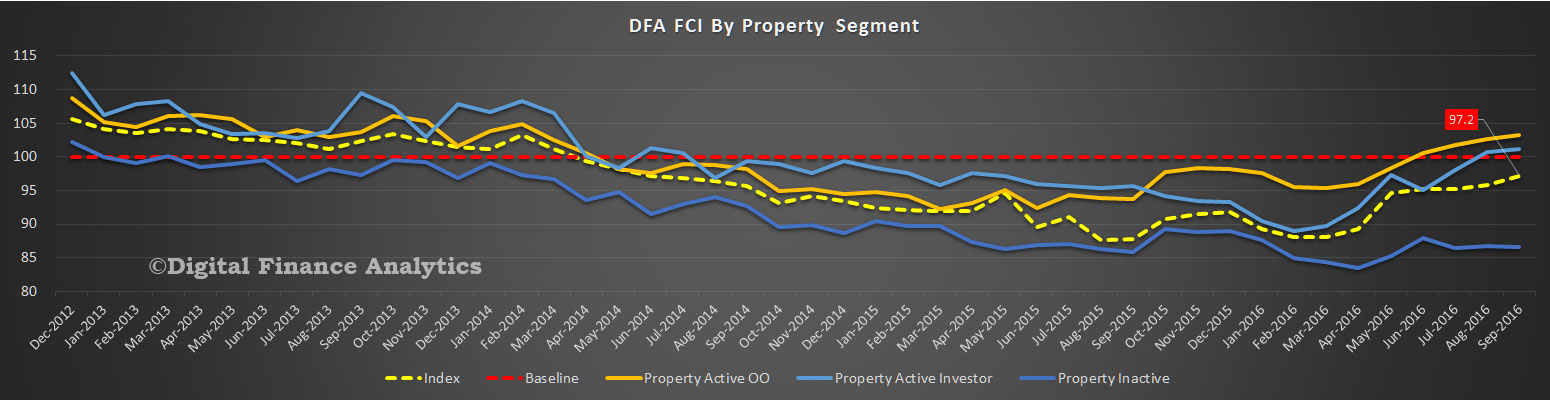
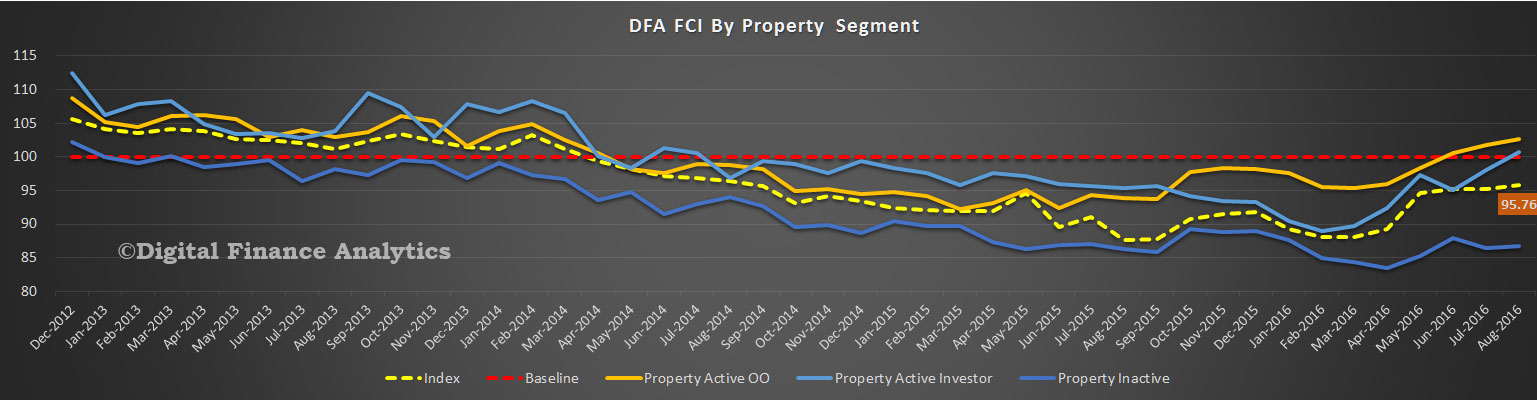
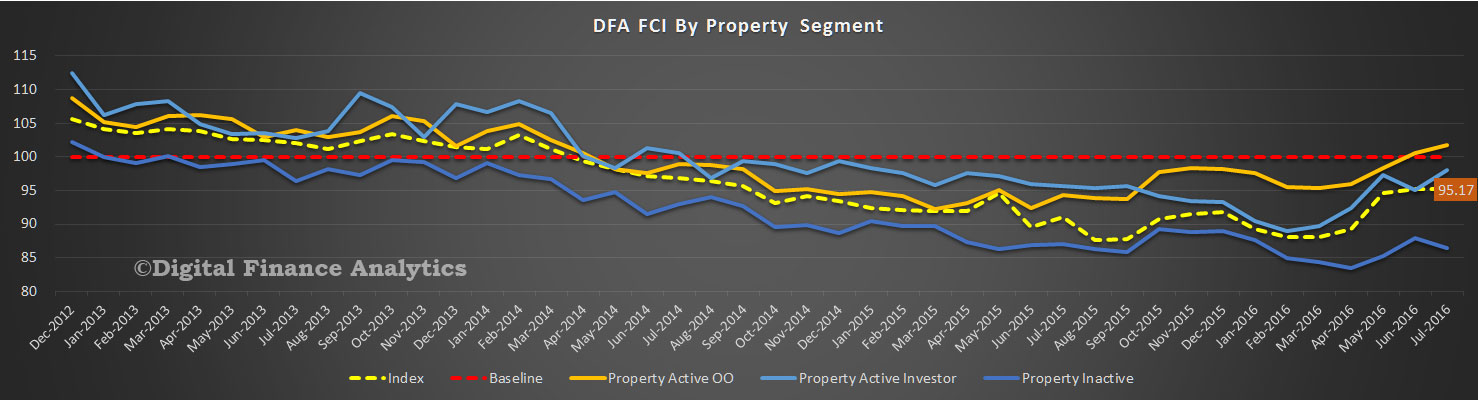
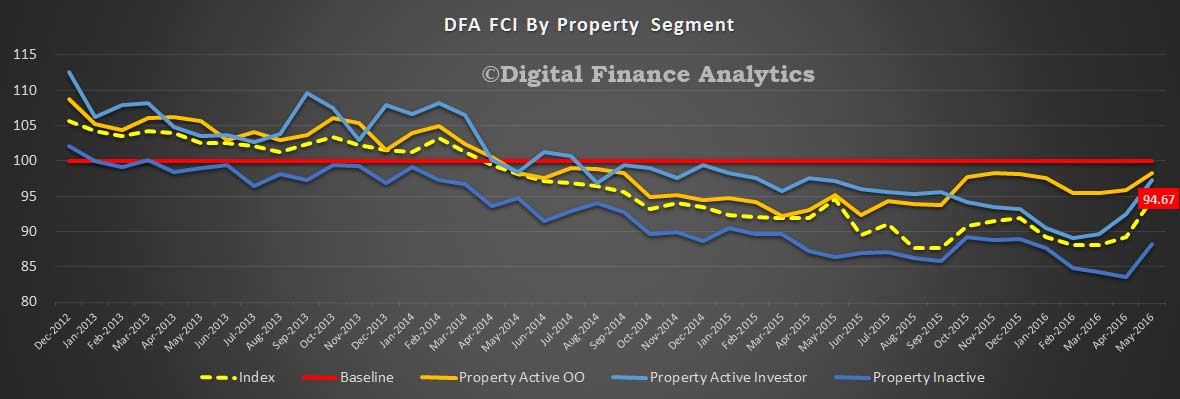
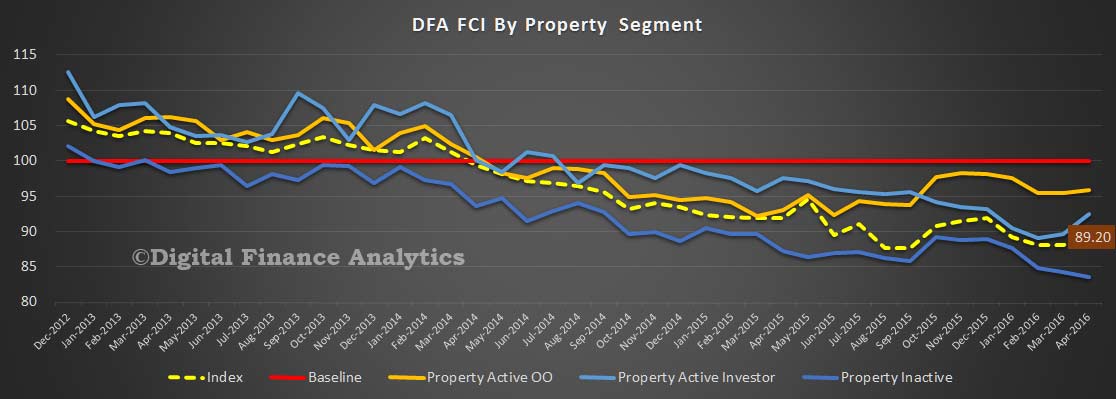
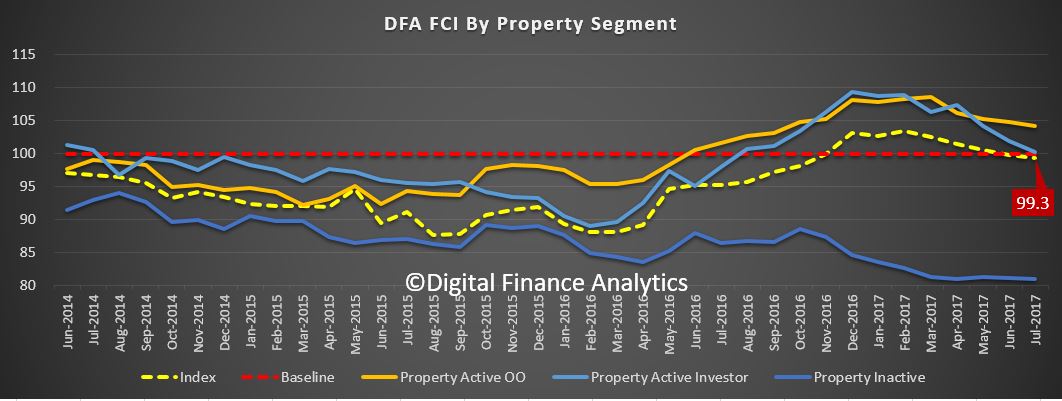
This is strongly linked with property owning status, with those renting well below the neutral setting (and more younger households rent these days), whilst owner occupied home owners are significantly more positive. We also see a fall in the confidence of property investors, relative to owner occupied owners.

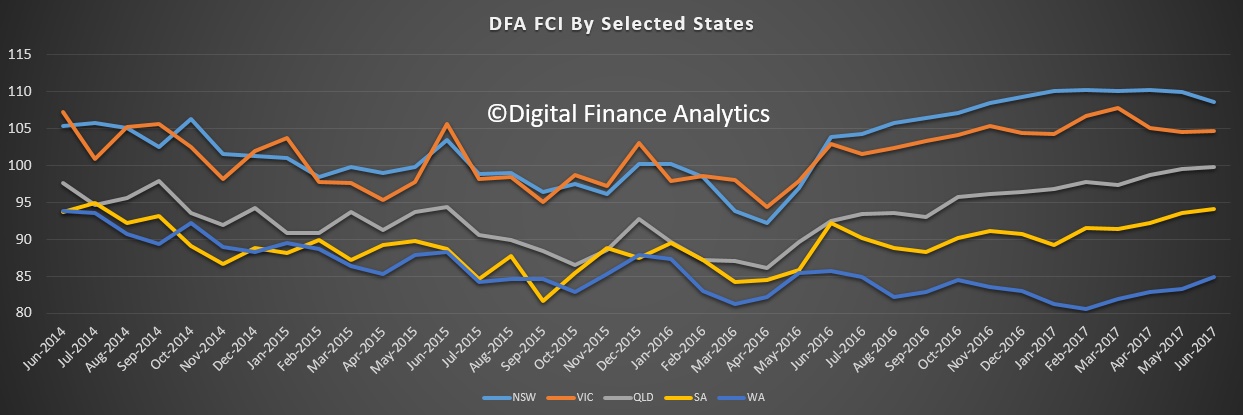
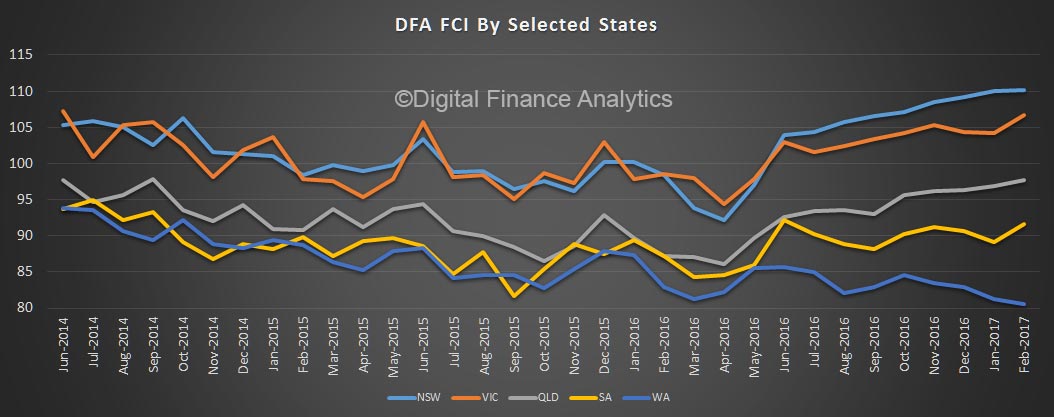
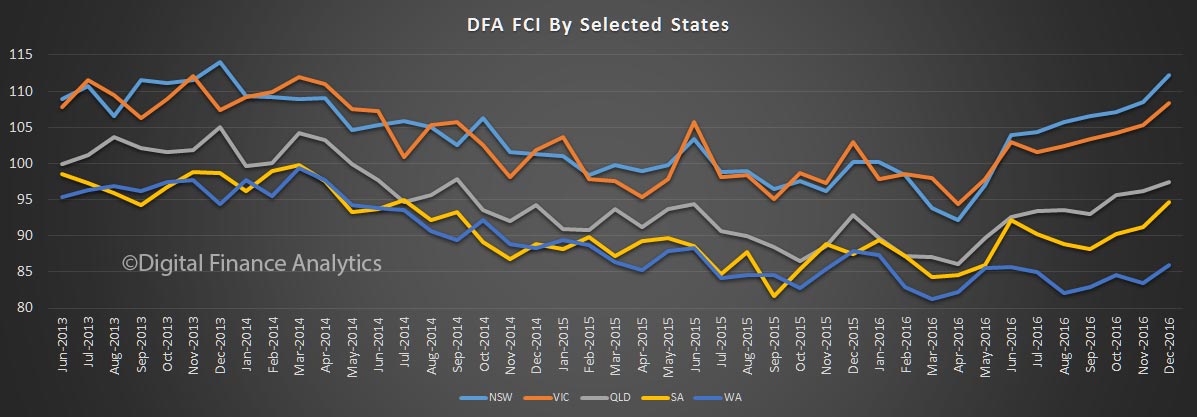
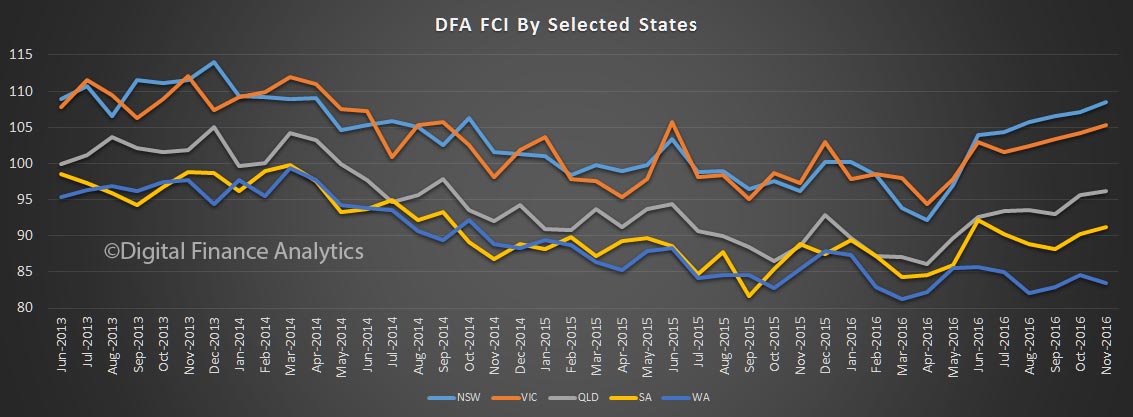
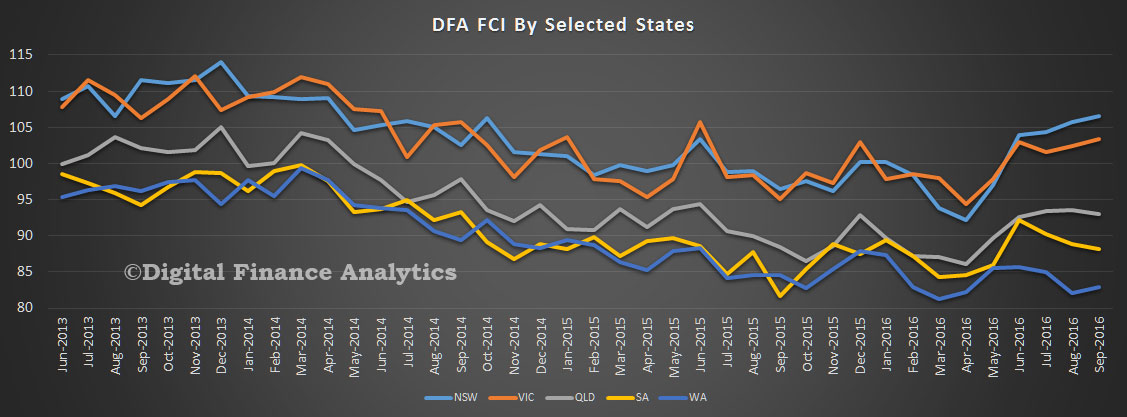
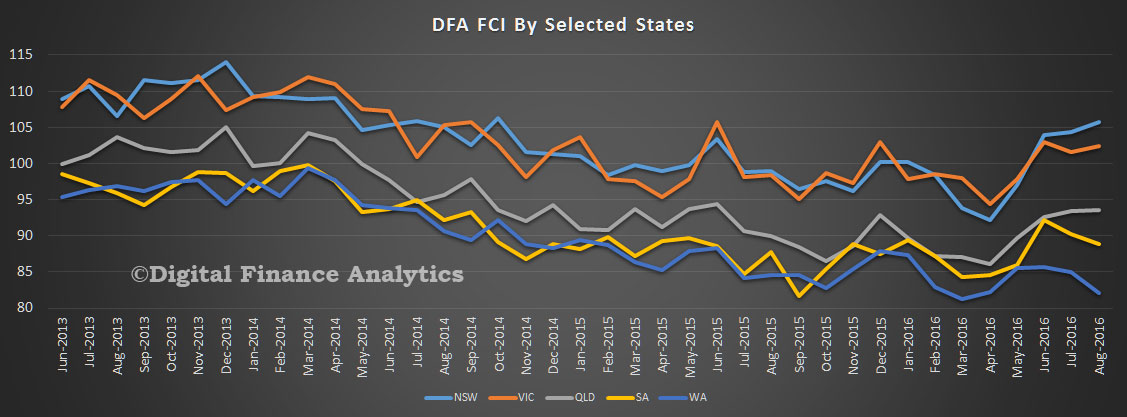
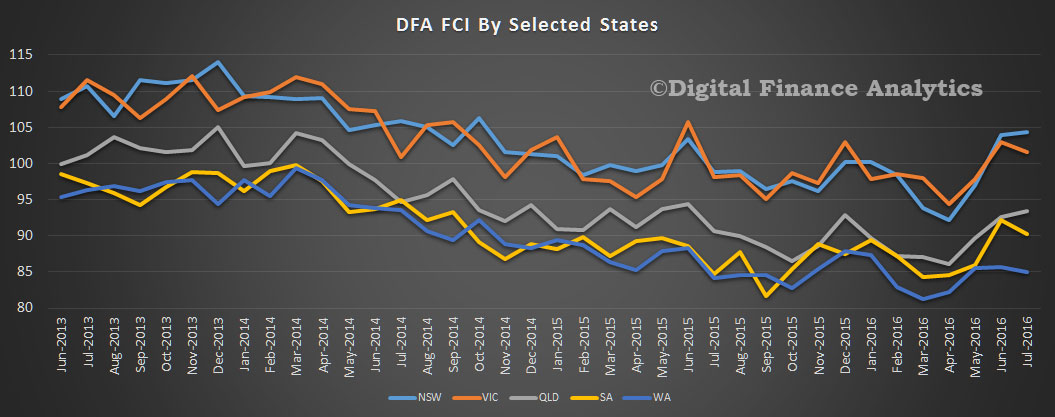
Across the states,  we see a small decline in confidence in NSW from a strong starting point, whilst VIC households were more confident in July.

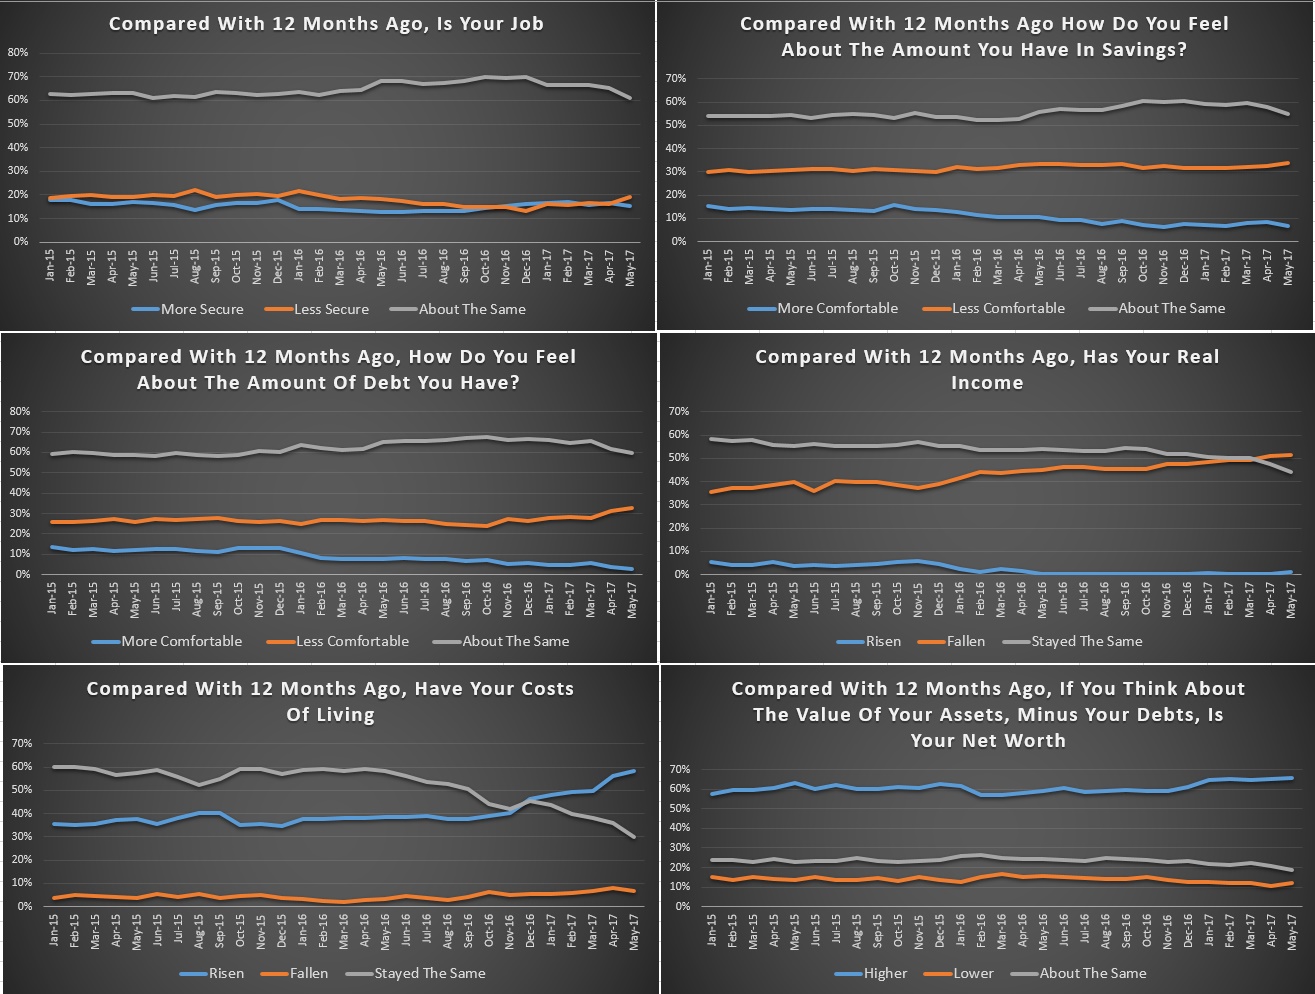
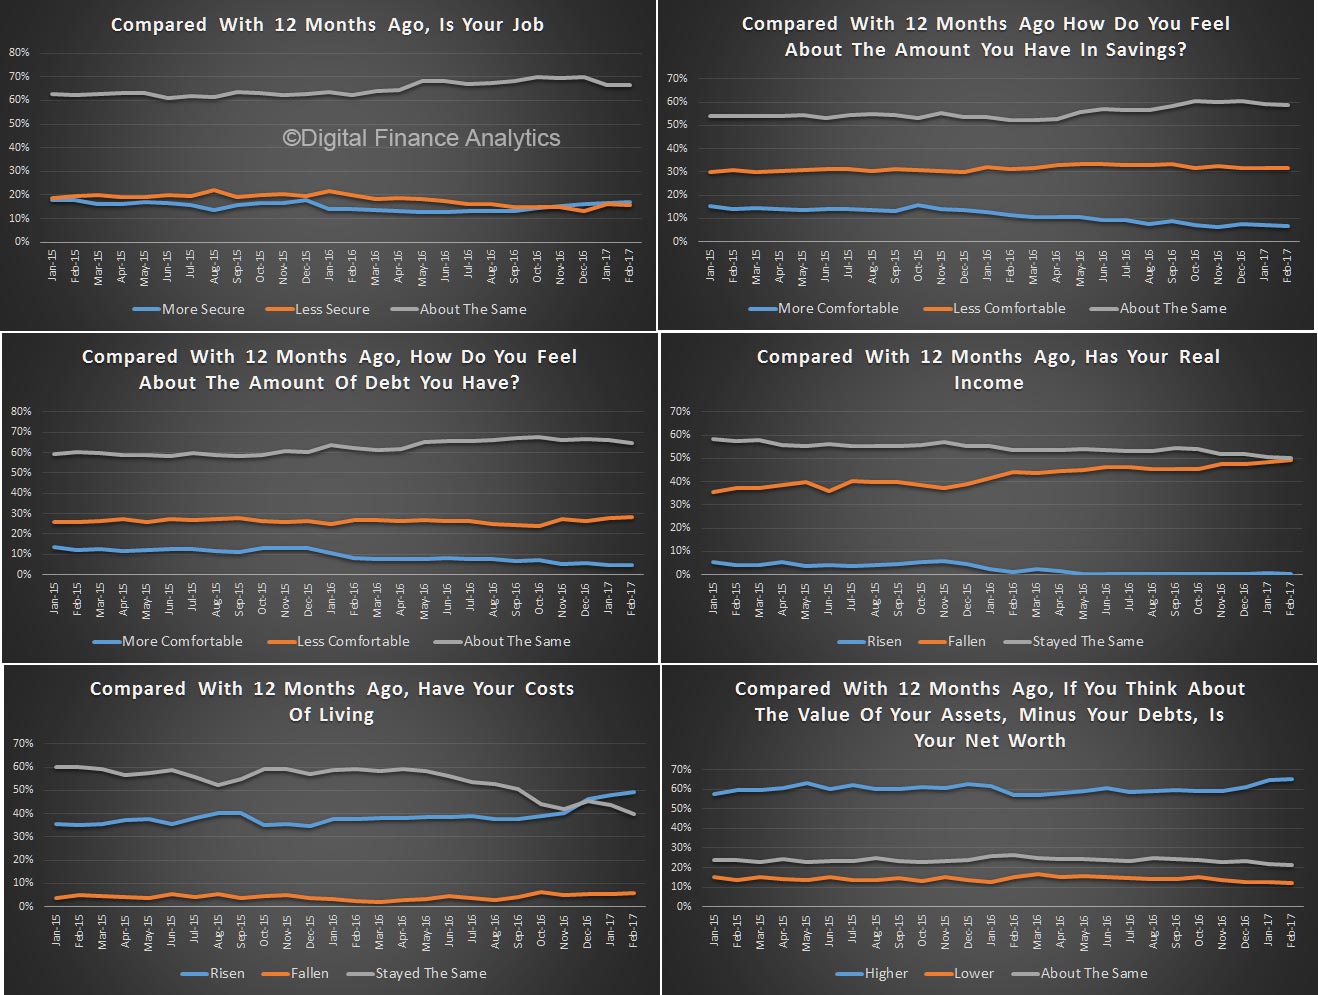
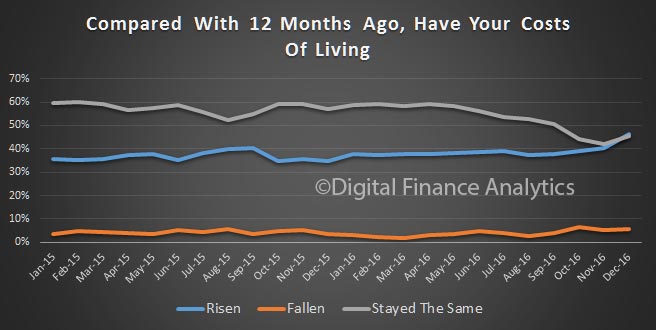
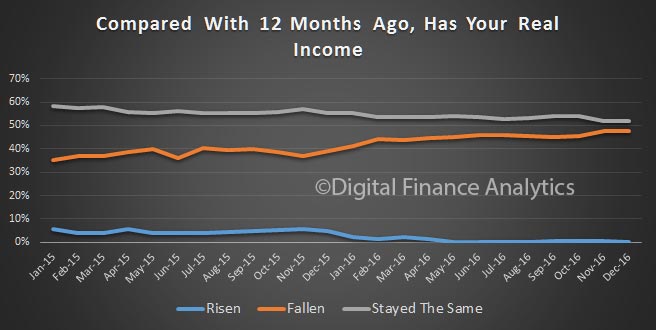
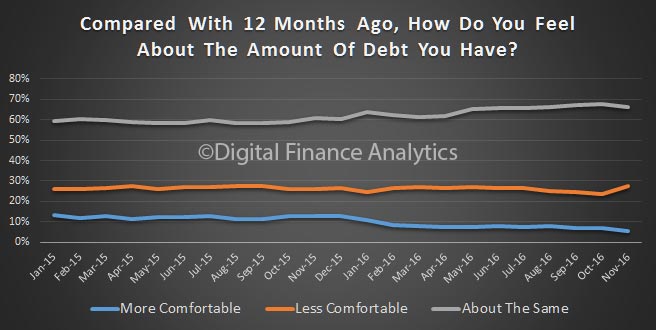
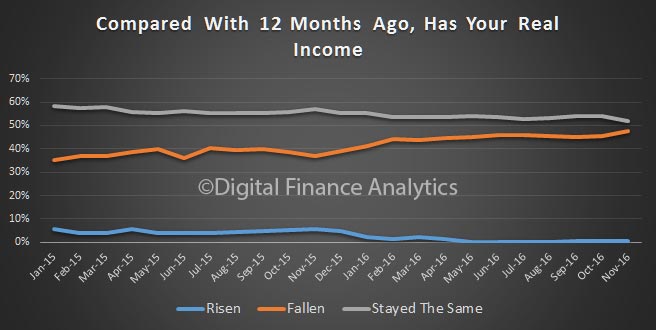
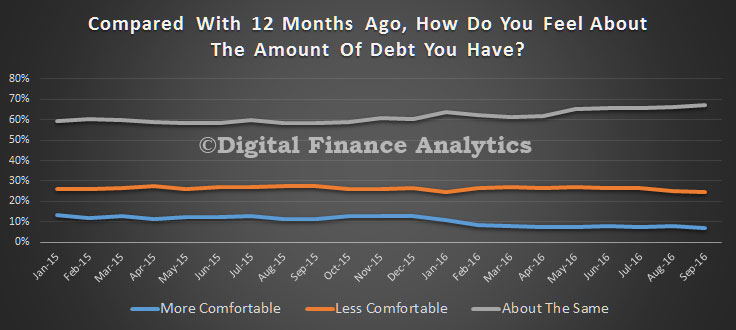
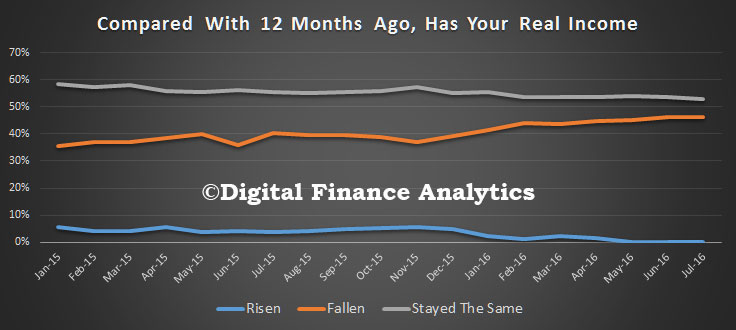
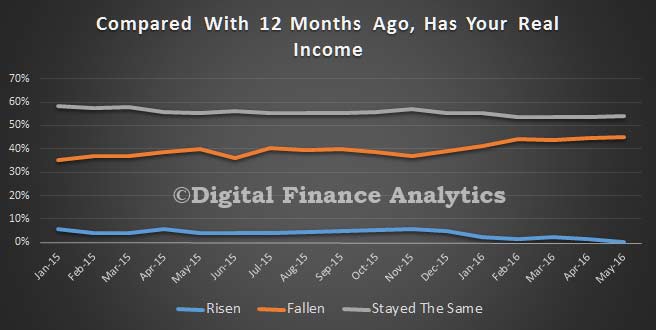
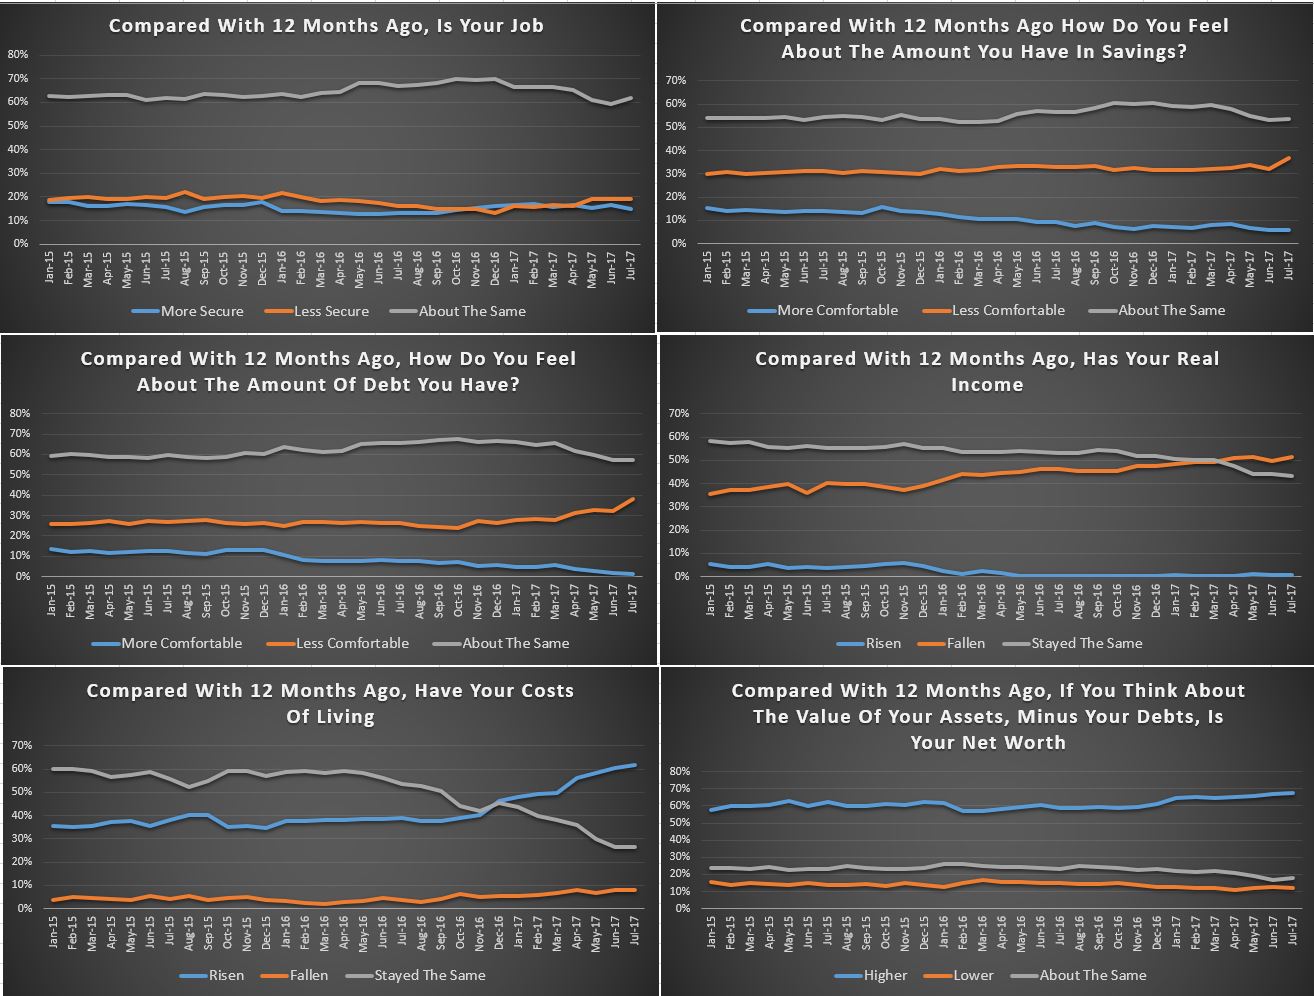
The driver scorecard shows little change in job security expectations, but lower interest rates on deposits continue to hit savings. Households are more concerned about the level of debt held, as interest rate rises bite home. The impact of flat or falling incomes registers strongly, with more households saying, in real terms they are worse off. Costs of living are rising fast, with the changes in energy prices, child care costs and council rates all hitting hard. That said, the continued rises in home prices, especially in the eastern states meant that net worth for households in these states rose again, which was not the case in WA, NT or SA.

Sentiment in the property sector is clearly a major influence on how households are feeling about their finances, but the real dampening force is falling real incomes and rising costs. As a result, we still expect to see the index fall further as we move into spring, as more price hikes come through. In addition, the raft of investor mortgage rate repricing will hit, whilst rental returns remain muted.

By way of background, these results are derived from our household surveys, averaged across Australia. We have 52,000 households in our sample at any one time. We include detailed questions covering various aspects of a household’s financial footprint. The index measures how households are feeling about their financial health. To calculate the index we ask questions which cover a number of different dimensions. We start by asking households how confident they are feeling about their job security, whether their real income has risen or fallen in the past year, their view on their costs of living over the same period, whether they have increased their loans and other outstanding debts including credit cards and whether they are saving more than last year. Finally we ask about their overall change in net worth over the past 12 months – by net worth we mean net assets less outstanding debts.


Household Financial Confidence Waned In May

The results from the latest Digital Finance Analytics Household Finance Confidence Index to end May 2017 is released today, and shows a lower overall score of 100.6, down from 101.5 last month. This is firmly in the neutral zone, but households with mortgages are feeling the pinch and the index is set to go lower in months ahead.

Both property investors and owner occupiers are more concerned about rising mortgage interest rates, and potentially falling property prices. There was less change in households who are property inactive, which shows how the dynamics of property is directly influencing confidence, but this group has a lower level of confidence to start with.

The biggest slide was in NSW, where the overall score is still the highest across the states, but is turning lower. Talk of lower prices, is hitting confidence. WA confidence is rising a little, but from a low baseline and there were small rises in QLD and SA.

Looking at the scorecard which drives the index, we see households have become a little more concerned about future job prospects, are less comfortable with savings returns, but significantly more concerned about the debt burden they are carrying in the context of falling real incomes, whilst costs of living continue to spiral higher. This despite net worth still rising for many.

Sentiment in the property sector is clearly a major influence on how households are felling about their finances, but the real dampening force is falling real incomes. This is unlikely to correct any time soon, so we expect continued weakness in the index as we go into winter.

By way of background, these results are derived from our household surveys, averaged across Australia. We have 52,000 households in our sample at any one time. We include detailed questions covering various aspects of a household’s financial footprint. The index measures how households are feeling about their financial health. To calculate the index we ask questions which cover a number of different dimensions. We start by asking households how confident they are feeling about their job security, whether their real income has risen or fallen in the past year, their view on their costs of living over the same period, whether they have increased their loans and other outstanding debts including credit cards and whether they are saving more than last year. Finally we ask about their overall change in net worth over the past 12 months – by net worth we mean net assets less outstanding debts.

Household Finance Security Index Higher Again In February

We have published the February 2017 edition of the Digital Finance Analytics Household Finance Confidence index (FCI) today, which shows a further small rise from the January 102.7 to 103.4. This is above the long term neutral setting, and after a significant dip in the past couple of years, the FCI is maintaining positive momentum.

However, the positive boost in predominately centered on momentum in the property market, with both owner occupied and investment property holders in positive territory, whilst those excluded from the property market, including renters and those living with family or friend get none of the upside, so their financial security is degrading further. This highlights the risks if the property market momentum were to reverse, and the bind that regulators face at the moment – do you keep the current settings and allow the market to continue to run, or tighten and risk reversing household sentiment and thus spending?

The state by state picture shows how uneven the confidence is, with households in the eastern states significantly more positive that in WA or SA.  WA grinds down, thanks to the pressure on the economy there, falling home prices and flat to falling incomes. Will the election result today make a difference?

Finally, here is the scorecard, which shows that real income in under pressure (up 1%), costs of living are rising (up 1%), concerns about debt levels are up a little (thanks to recent rate increases) but net worth is being bolstered by strong home price growth and rising stock markets.  The property sector is firmly linked to household confidence, and vice-versa.

By way of background, these results are derived from our household surveys, averaged across Australia. We have 26,000 households in our sample at any one time. We include detailed questions covering various aspects of a household’s financial footprint. The index measures how households are feeling about their financial health. To calculate the index we ask questions which cover a number of different dimensions. We start by asking households how confident they are feeling about their job security, whether their real income has risen or fallen in the past year, their view on their costs of living over the same period, whether they have increased their loans and other outstanding debts including credit cards and whether they are saving more than last year. Finally we ask about their overall change in net worth over the past 12 months – by net worth we mean net assets less outstanding debts.

Positive Property News Supports Household Finance Confidence

The latest Digital Finance Analytics Household Finance Confidence Index, to end December is released today. Overall household confidence is buoyant, and above the neutral setting. Sitting at 103.2, it is up from 100.02 in November.

The property “fairy” has been generous in that property is the key to the index at the moment, with positive news on home price rises, and the effect of the low interest rates following the last RBA cash rate cut flowing through. Home owners with an investment property have now overtaken the confidence score of owner occupied property holders, but both are higher. Those households who are not property active however continue to languish.

We see significant state variations, with those in NSW and VIC most confident, whilst those in WA, although slightly higher, is significantly off the pace.  The impact of changes to the first owner grant there will not flow through into the results for some time to come.

The impact of positive property news has swamped a couple of the negative indicators. For example, more households are saying their costs of living have risen in the past 12 months.

In addition, real incomes, after adjusting for inflation are static or falling. Very few have had any pay rises above inflation, and many none at all.

So, it seems the future of household confidence is joined at the hip with the future of property. In the light of our recent mortgage default modelling, in a rising interest rate market, this may be a concern as we progress through 2017. But at the moment, households are having a party!

By way of background, these results are derived from our household surveys, averaged across Australia. We have 26,000 households in our sample at any one time. We include detailed questions covering various aspects of a household’s financial footprint. The index measures how households are feeling about their financial health. To calculate the index we ask questions which cover a number of different dimensions. We start by asking households how confident they are feeling about their job security, whether their real income has risen or fallen in the past year, their view on their costs of living over the same period, whether they have increased their loans and other outstanding debts including credit cards and whether they are saving more than last year. Finally we ask about their overall change in net worth over the past 12 months – by net worth we mean net assets less outstanding debts.

Household Finance Confidence Higher Again

The latest data from the Digital Finance Analytics Household Finance Confidence Index shows a further improvement, with the November score now just above the 100 neutral position at 100.02. This is up from 98.2 in October, and the first time since 2014 we have been above the neutral setting.

fci-nov-2016-summaryThe full effect of recent rate changes and the availability of low-rate fixed mortgages, together with climbing home values in most states, combined,  have driven both home owners, and property investors confidence higher. In fact, for the first time in more than a year, property investors are more confident than owner occupiers. On the other hand, the one-third of households excluded from the property market drifted lower, thanks to higher costs of living and static or falling incomes.

fci-nov-2016-propertyLooking across the states, households in NSW are much more confident, with VIC slightly behind. Households in WA reported a fall in confidence, thanks to poorer employment prospects and falling home prices.

fci-nov-2016-statesjpgOn average households were a little less comfortable with the amount of debt they hold, thanks to expectations that interest rates have passed their low point, and will rise. 27.6% of households were less comfortable, up 3.9% from last month.

fci-nov-2016-debtWe also see a continued fall in real incomes, thanks to rising costs and flat or falling pay. 47.5% said their incomes had fallen, in real terms, in the past year, up 2.3% last month.

fci-nov-2016-income Households reported improved investment incomes from stocks and term deposits. However, appetite for investment property, especially down the east coast remains strong.

On average, younger households were less confident compared with those aged above 50 years.

By way of background, these results are derived from our household surveys, averaged across Australia. We have 26,000 households in our sample at any one time. We include detailed questions covering various aspects of a household’s financial footprint. The index measures how households are feeling about their financial health. To calculate the index we ask questions which cover a number of different dimensions. We start by asking households how confident they are feeling about their job security, whether their real income has risen or fallen in the past year, their view on their costs of living over the same period, whether they have increased their loans and other outstanding debts including credit cards and whether they are saving more than last year. Finally we ask about their overall change in net worth over the past 12 months – by net worth we mean net assets less outstanding debts.

Household Financial Confidence Improves, If You Hold Property

The latest edition of the Digital Finance Analytics Household Finance Confidence Index (FCI) to end September 2016 is released today. Using data from our household surveys we examine how households regard their overall financial position. The composite index rose from 95.8 in August to 97.2 in September, the highest reading for a couple of years, though still just below its 100 neutral setting. It is dragged down by households excluded from the property market.

fci-sept-2016This average national score masks some important differences. First, the score varies by state. Households in NSW and VIC are now above the neutral setting, thanks to improving job prospects, rising home prices, and lower interest rates on mortgages. With stock markets on the rise, the only negative indicator in these states is low returns on bank savings (which is encouraging more to look at investment property) and high debt. Costs of living, though rising, seem largely manageable.

There is a different story in WA and SA, where unemployment is a higher risk, property prices are muted, and debt remains high. QLD sits between the two extremes, with households in and around Brisbane mirroring the results in NSW, whilst regional QLD is mirroring WA; a state divided. In these states, costs of living are more of a concern.

fci-sept-2016-statesLooking at the results by property owning segmentation, owner occupied home owners are the most positive about their financial position, thanks to the increasing wealth effect of rising home prices, in an ultra-low interest rate environment. Property investors are increasingly confident, thanks to better than expected capital values, lower interest rates and no disruption to capital gains or negative gearing policy. The only shadow on their horizon is flat rental incomes and poor tenant behaviour.

However, one quarter of households are property inactive – mainly in rental accommodation, or living with friends or family. They are excluded from the wealth effect of property. With incomes static, the costs of rent, alongside other costs of living, kept their scores much lower (and indeed take the national average below its neutral setting). Take property inactive households out of the equation, and the remaining groups would be well above the neutral setting. Your property owning status determines your wealth footprint – no wonder people aspire to get on the property ladder, at almost any cost!

fci-sept-2016-pty Finally, we look at one of the specific dimensions in the survey. This month we look at debt exposure. Two thirds of borrowing households are as comfortable with the debts they hold as a year ago (bigger debts, but lower interest rates). Around 7% are more comfortable than a year ago, and 24% less comfortable, driven by finding it more difficult to service their debts in a low income growth, high cost growth environment. Remember, interest rates are very low at the moment, so this level of debt pressure remains a concern. If rates were to rise, pressure on these households would rise, fast.

fci-sept-2016-debtBy way of background, these results are derived from our household surveys, averaged across Australia. We have 26,000 households in our sample at any one time. We include detailed questions covering various aspects of a household’s financial footprint. The index measures how households are feeling about their financial health. To calculate the index we ask questions which cover a number of different dimensions. We start by asking households how confident they are feeling about their job security, whether their real income has risen or fallen in the past year, their view on their costs of living over the same period, whether they have increased their loans and other outstanding debts including credit cards and whether they are saving more than last year. Finally we ask about their overall change in net worth over the past 12 months – by net worth we mean net assets less outstanding debts.

Household Financial Security Confidence Improves Again

The latest edition of the Digital Finance Household Finance Confidence Index, to end August is released today. Overall the index rose again, from 95.1 to 95.8.

Household costs were relatively contained, whilst many received a boost from the RBA cash rate cut. Some savers were able to take advantage of higher term deposit rates, although others saw their returns on cash deposits falling further. Income growth remained static, but net worth improved thanks to rises in the value of property and shares. Overall the index remains below a neutral setting, but some households in some states are now well into positive territory.

fci-aug-2016 The cash rate cut helped to propel the confidence of those with owner occupied and investment property, while those who are property inactive did not show the same rise. In addition, the more recent positive home price rises bolstered property investors.

fci-aug-2016-ptyThe state variations continue to widen, with households in NSW and VIC well into positive territory, whilst those in WA languish.

fci-aug-2016-statesBy way of background, these results are derived from our household surveys, averaged across Australia. We have 26,000 households in our sample at any one time. We include detailed questions covering various aspects of a household’s financial footprint. The index measures how households are feeling about their financial health. To calculate the index we ask questions which cover a number of different dimensions. We start by asking households how confident they are feeling about their job security, whether their real income has risen or fallen in the past year, their view on their costs of living over the same period, whether they have increased their loans and other outstanding debts including credit cards and whether they are saving more than last year. Finally we ask about their overall change in net worth over the past 12 months – by net worth we mean net assets less outstanding debts.


Household Finance Confidence Holds

The latest Digital Finance Analytics Household Finance Confidence index, for July 2016 is released today. The index, which measures households’ attitudes to their finances, stands at 95.17, down a little from last month from 95.21, and below the long term average of 100. However, there are wide variations among households.

FCI-Jul-2016--IndexHouseholds with savings in bank deposits were more confident, thanks to small, but significant uplifts in term deposit rates. We expect to see this continue, following the August RBA rate cut, and banks’ repricing of term deposits.

One factor of note is the ongoing fall in households who recorded real income growth in the past year. This is a drag on confidence, and spending. The small cut in mortgage interest rates will not help very much.

FCI-July-2016---IncomeThere are significant differences by property segment, with owner occupied households the most confident, thanks to falling interest rates and continued property price rises. Property investors also recorded  a rise, thanks to rising property values, though trimmed by low rental income rises, and mortgage pricing. Property inactive households were the least confident, not least because with incomes flat many are finding it tough to make rental payments on time. They are not able to particulate in the wealth effect of holding property.

FCI-Jul-2016---PtyThere are also variations across selected states. Households in NSW and VIC are the more confident, thanks to relatively good employment prospects, and stable living costs.  Households in WA and SA are more concerned, with issues such an employment and living costs in mind.

FCI-Jul-2016-StatesBy way of background, these results are derived from our household surveys, averaged across Australia. We have 26,000 households in our sample at any one time. We include detailed questions covering various aspects of a household’s financial footprint. The index measures how households are feeling about their financial health. To calculate the index we ask questions which cover a number of different dimensions. We start by asking households how confident they are feeling about their job security, whether their real income has risen or fallen in the past year, their view on their costs of living over the same period, whether they have increased their loans and other outstanding debts including credit cards and whether they are saving more than last year. Finally we ask about their overall change in net worth over the past 12 months – by net worth we mean net assets less outstanding debts.


Household Financial Security Index Rises, Significantly

The latest edition of the Digital Finance Analytics Household Financial Security Confidence Index (FCI) is released today, to end May 2016. It shows a significant rise in overall confidence levels, up from 89.2, to 94.7 although this is still below the neutral score of 100, which we fell below in 2014.

FCI-May-2016-FCIA number of elements explain the improvement. Looking first at the index by property segment, we see that the property active investor’s score continue to improve, thanks to rising home prices, the likely negation of changes to negative gearing post the election, and falling interest rates on loans. This reflects the heightened demand we identified in our last set of survey results.  The owner occupied home owners score also bounced back, thanks to the cash rate interest rate cut in May feeding through into prospective lower mortgage repayments. Even property inactive households were more confident, and this is associated with recent more positive economic news, and lower rental rates. This break-out trajectory suggests we could be above the long term neutral position soon.

FCI-May-2016-PropertyThis video blog goes though the main points:

But, then again, within the index, we see some more concerning signs. First, stagnant incomes are confirmed, with almost no households reporting real income growth, and around 45% saying their real incomes have fallen.

FCI-May-2016---Income We also noted concerns about the level of income from bank deposits as rates fall, and banks try to manage their net interest margin. I am surprise there is so little coverage of the real impact of falling interest rates on those relying on savings, despite the large number of households which are impacted; all the focus is on property and shares. This fall in rates proportionally impacts more older households.

We also see rising child care costs hitting large numbers of younger households as the latest changes work through.

Finally, we see that households in regional WA and QLD are significantly less confident thanks to pressure on home prices and higher levels of mortgage stress, whereas in NSW and VIC households are relatively more confident. Here they are close to crossing the 100 point Rubicon.

By way of background, these results are derived from our household surveys, averaged across Australia. We have 26,000 households in our sample at any one time. We include detailed questions covering various aspects of a household’s financial footprint. The index measures how households are feeling about their financial health. To calculate the index we ask questions which cover a number of different dimensions. We start by asking households how confident they are feeling about their job security, whether their real income has risen or fallen in the past year, their view on their costs of living over the same period, whether they have increased their loans and other outstanding debts including credit cards and whether they are saving more than last year. Finally we ask about their overall change in net worth over the past 12 months – by net worth we mean net assets less outstanding debts.

Property Investor Confidence Lifts

The latest edition of the Digital Finance Analytics Household Finance Security Index, to end April, released today, shows a lift from 88.14 to 89.20. This is still below the long term neutral score of 100, but is the highest score so far this year.

FCI-APril-2016Of note is the significant spike from 89.67 to 92.45 in confidence among property investors, thanks to the Government stance on negative gearing, the expectation of interest rate cuts, and better news on home price growth. Investor households in NSW and VIC improved the most. Property active owner occupied households saw a small lift from 95.43 to 95.93, thanks to the expectation of lower mortgage rates (though offset by lower returns from those with deposits). Improved stock marker performance assisted. Once again, stronger positive scores in NSW and VIC were somewhat offset by noticeably weaker scores in WA and QLD.

Overall costs of living were flat. We saw a further fall in those who had received a pay rise whilst those with property on average saw their net worth rise again.

There was a noticeable fall in those households who are not property active – either renting or living with family or friends. On average their score fell again, from 84.3 to 83.5. These households are more exposed to costs of living (including rising rentals), have no leverage to the rising property market and are more stressed financially than property holding segments. Around one third of households fall into this group.

By way of background, these results are derived from our household surveys, averaged across Australia. We have 26,000 households in our sample at any one time. We include detailed questions covering various aspects of a household’s financial footprint. The index measures how households are feeling about their financial health. To calculate the index we ask questions which cover a number of different dimensions. We start by asking households how confident they are feeling about their job security, whether their real income has risen or fallen in the past year, their view on their costs of living over the same period, whether they have increased their loans and other outstanding debts including credit cards and whether they are saving more than last year. Finally we ask about their overall change in net worth over the past 12 months – by net worth we mean net assets less outstanding debts.