Unemployment Ticks Up (Seasonally Adjusted)

According to latest figures released by the Australian Bureau of Statistics (ABS), the seasonally adjusted unemployment rate increased to 5.6 per cent and the labour force participation rate increased by less than 0.1 percentage points to 65.7 per cent.  The number of persons employed increased by 18,000 in February 2018.

The preferred monthly trend unemployment rate remained steady at 5.5 per cent in February 2018,

“While the unemployment rate remained steady, the underemployment rate decreased by 0.1 percentage points to 8.3 per cent over the quarter, and is now at its lowest point since November 2015,” the Chief Economist for the ABS, Bruce Hockman, said.

Over the past year, the trend underutilisation rate, which includes both unemployment and underemployment, decreased by 0.6 percentage points to 13.8 per cent.

Employment and hours

Monthly trend full-time employment increased for the 16th straight month in February 2018. Full-time employment grew by a further 8,000 persons in February, while part-time employment increased by 12,000 persons, underpinning a total increase in employment of 19,000 persons.

“Full-time employment has now increased by around 293,000 persons over the past year, and makes up the majority of the 400,000 increase in employment,” Mr Hockman said.

Over the past year, trend employment increased by 3.3 per cent, which is above the average year-on-year growth over the past 20 years (1.9 per cent).

The trend monthly hours worked decreased slightly, by 1.4 million hours (0.1 per cent), with the annual figure continuing to show strong growth (2.7 per cent).

The labour force participation rate increased to 65.7 per cent, the highest it has been since December 2010. The female labour force participation also increased, to a further historical high of 60.6 per cent.

States and Territories

Over the past year, the states and territories with the strongest annual growth in trend employment were the ACT (4.7 per cent) Queensland (4.6 per cent) and New South Wales (3.9 per cent).

US Employment Data Strong Again In February

The latest data from the US Bureau of Labor Statistics for February 2018 shows that total nonfarm payroll employment increased by 313,000 in February, and the unemployment rate was unchanged at 4.1 percent. Employment rose in construction, retail trade, professional and business services, manufacturing, financial activities, and mining.

This is a strong result, and provides further support for potential rate rises this year.  On the other hand, wage growth was a little more contained, alleviating concerns about rising inflation. In February, average hourly earnings for all employees on private nonfarm payrolls rose by 4 cents to $26.75, following a 7-cent gain in January. Over the year, average hourly earnings have increased by 68 cents, or 2.6 percent

The US markets reacted positively.

Here is the release:

Household Survey Data

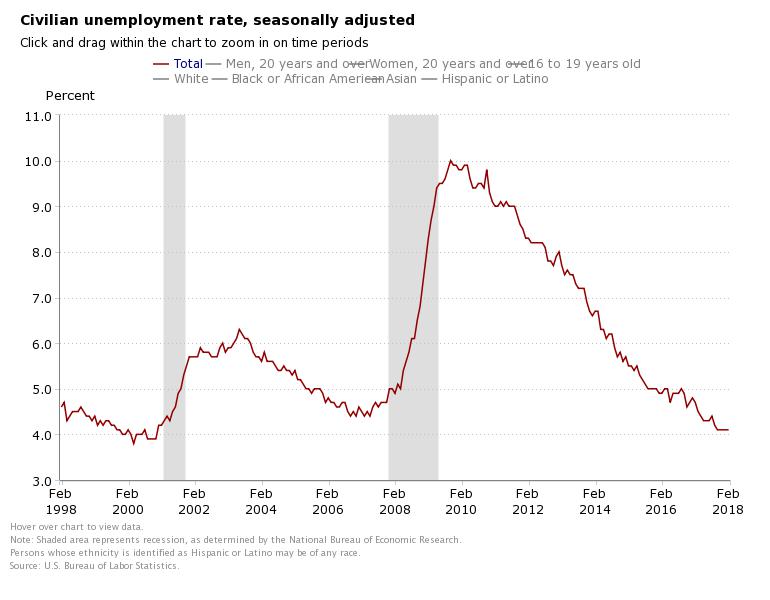
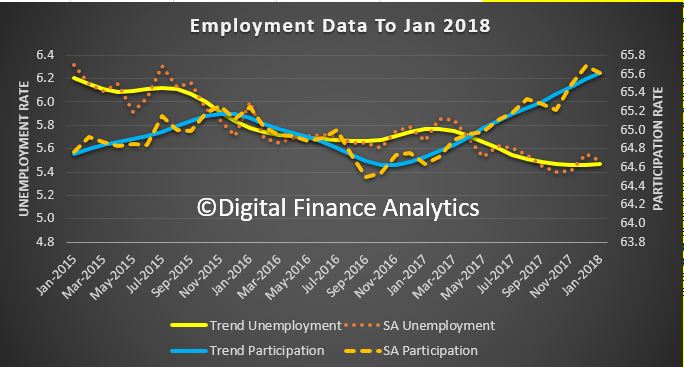
In February, the unemployment rate was 4.1 percent for the fifth consecutive month, and the number of unemployed persons was essentially unchanged at 6.7 million.

Among the major worker groups, the unemployment rate for Blacks declined to 6.9 percent in February, while the jobless rates for adult men (3.7 percent), adult women (3.8 percent), teenagers (14.4 percent), Whites (3.7 percent), Asians (2.9 percent), and Hispanics (4.9 percent) showed little change.

The number of long-term unemployed (those jobless for 27 weeks or more) was essentially unchanged at 1.4 million in February and accounted for 20.7 percent of the unemployed. Over the year, the number of long-term unemployed was down by 369,000.

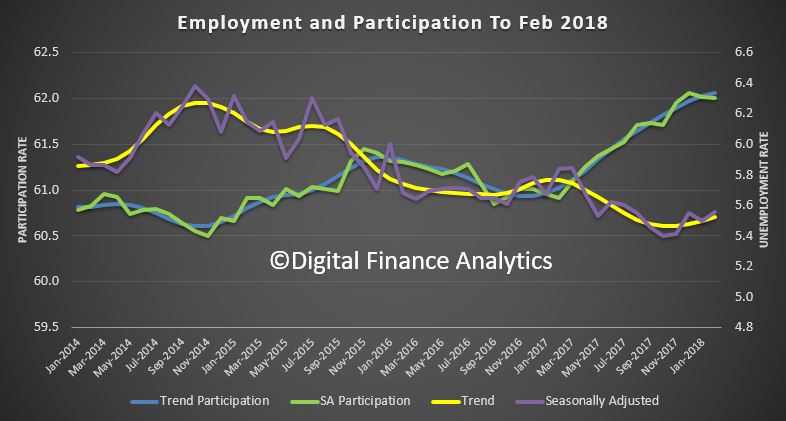
The civilian labor force rose by 806,000 in February. The labor force participation rate increased by 0.3 percentage point over the month to 63.0 percent but changed little over the year.

In February, total employment, as measured by the household survey, rose by 785,000. The employment-population ratio increased by 0.3 percentage point to 60.4 percent in February, following 4 months of little change.

The number of persons employed part time for economic reasons (sometimes referred to as involuntary part-time workers) was little changed at 5.2 million in February. These individuals, who would have preferred full-time employment, were working part time because their hours had been cut or because they were unable to find full-time
jobs.

In February, 1.6 million persons were marginally attached to the labor force, little different from a year earlier. (The data are not seasonally adjusted.) These individuals were not in the labor force, wanted and were available for work, and had looked for a job sometime in the prior 12 months. They were not counted as unemployed because they had not searched for work in the 4 weeks preceding the survey.

Among the marginally attached, there were 373,000 discouraged workers in February, down by 149,000 from a year earlier. (The data are not seasonally adjusted.) Discouraged workers are persons not currently looking for work because they believe no jobs are available for them. The remaining 1.2 million persons marginally attached to the labor force in February had not searched for work for reasons such as school attendance or family responsibilities.

Establishment Survey Data

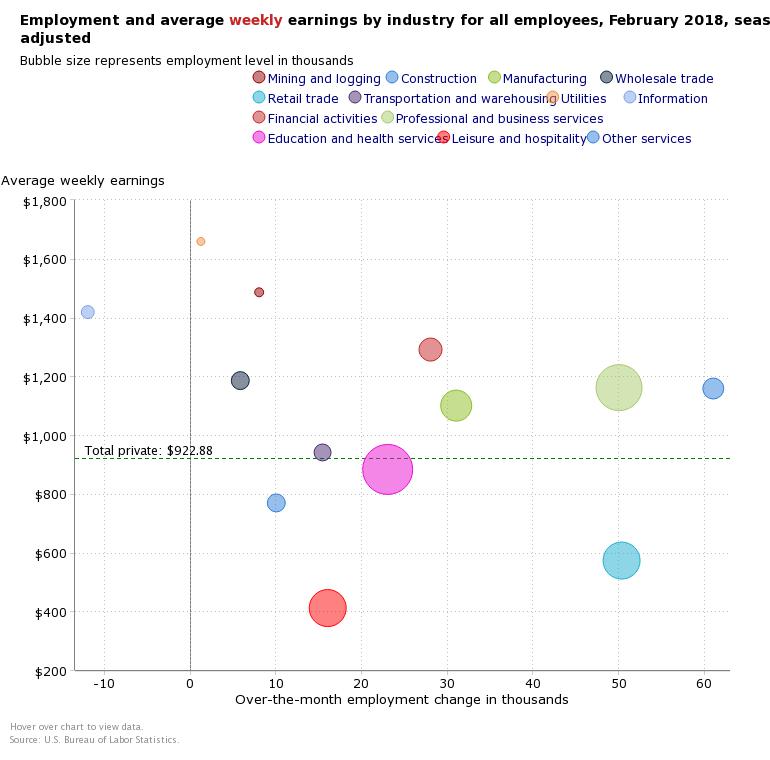
Total nonfarm payroll employment rose by 313,000 in February. Job gains occurred in construction, retail trade, professional and business services, manufacturing, financial activities, and mining.

In February, construction employment increased by 61,000, with gains in specialty trade contractors (+38,000) and construction of buildings (+16,000). Construction has added 185,000 jobs over the past 4 months.

Retail trade employment increased by 50,000 over the month. Within the industry, employment rose in general merchandise stores (+18,000) and in clothing and clothing accessories stores (+15,000). However, over the past 4 months, which traditionally see the bulk of the holiday hiring and layoff, employment in these industries has changed little on net. Elsewhere in retail trade, building material and garden supply stores added jobs over the month (+10,000).

Employment in professional and business services increased by 50,000 in February and has risen by 495,000 over the year. Employment in temporary help services edged up over the month (+27,000).

Manufacturing added 31,000 jobs in February. Within the industry, employment rose in transportation equipment (+8,000), fabricated metal products (+6,000), machinery (+6,000), and primary metals (+4,000). Over the past year, manufacturing has added 224,000 jobs.

Financial activities added 28,000 jobs over the month, with gains in credit intermediation and related activities (+8,000); insurance carriers and related activities (+8,000); and securities, commodity contracts, and investments (+5,000). Over the year, financial activities has added 143,000 jobs.

Employment in mining rose by 9,000 in February, with most of the increase in support activities for mining (+7,000). Since a recent low in October 2016, mining has added 69,000 jobs.

Employment in health care continued to trend up in February (+19,000), with a gain of 9,000 in hospitals. Health care has added 290,000 jobs over the past year.

Employment in other major industries, including wholesale trade, transportation and warehousing, information, leisure and hospitality, and government, showed little change over the month.

The average workweek for all employees on private nonfarm payrolls rose by 0.1 hour to 34.5 hours in February. In manufacturing, the workweek increased by 0.2 hour to 41.0 hours, while overtime edged up by 0.1 hour to 3.6 hours. The average workweek for production and nonsupervisory employees on private nonfarm payrolls increased by 0.2 hour to 33.8 hours.

In February, average hourly earnings for all employees on private nonfarm payrolls rose by 4 cents to $26.75, following a 7-cent gain in January. Over the year, average hourly earnings have increased by 68 cents, or 2.6 percent. Average hourly earnings of private-sector production and nonsupervisory employees increased by 6 cents to $22.40 in February.

The change in total nonfarm payroll employment for December was revised up from +160,000 to +175,000, and the change for January was revised up from +200,000 to +239,000. With these revisions, employment gains in December and January combined were 54,000 more than previously reported. (Monthly revisions result from additional reports received from businesses and government agencies since the last published
estimates and from the recalculation of seasonal factors.) After revisions, job gains have averaged 242,000 over the last 3 months.

Employment Growth Slowing?

The ABS released the January 2018 employment data which shows that the trend unemployment remained steady at 5.5 per cent, where it has hovered for the past seven months.

The ABS says that full-time employment grew by a further 9,000 persons in January, while part-time employment increased by 14,000 persons, underpinning a total increase in employment of 23,000 persons.

Full-time employment has now increased by around 292,000 since January 2017 and makes up the majority of the 395,000 net increase in employment over the period. In line with the increasing female participation in the labour force, female full-time employment accounted for 55 per cent of the full-time employment growth over the past year.

Over the past year, trend employment increased by 3.3 per cent, which is above the average year-on-year growth over the past 20 years (1.9 per cent). Prior to the past two months, the last time it was 3.3 per cent or higher was back in February 2008, before the Global Financial Crisis.

The trend monthly hours worked decreased slightly, by 1.2 million hours (0.1 per cent), with the annual figure continuing to show strong growth (2.7 per cent).

The trend unemployment rate has fallen by 0.3 percentage points over the year but has been at approximately the same level for the past seven months, after the December 2017 figure was revised upward to 5.5 per cent.

Over the past year, the states and territories with the strongest annual growth in trend employment were the ACT (4.8 per cent) Queensland (4.7 per cent) and New South Wales (3.6 per cent).

All states and territories recorded a decrease in their trend unemployment rates, except the Northern Territory and the ACT (which increased 1.1 and 0.3 percentage points respectively).

A More Regional Look At Jobs

CommSec looked at employment across regions over the last year.

Despite the boom in jobs, the regional variations are quite stark, with some areas showing higher rates of unemployment, and difficult economic conditions

There is also a correlation between employment and mortgage stress, more on this when we release our latest monthly stress update next week.

CommSec says:

Generally people in metropolitan areas earn higher incomes than their cousins in the country, but employment outcomes vary considerably.

Unemployment has increased in several Queensland regional centres in recent years. Outback Queensland, which includes western and far north areas of the state, has the worst unemployment rate in the country. That said, Cairns’ average unemployment rate has improved to 5.9 per cent in 2017 from 7.8 per cent a year ago.

Queensland’s coastal regional centres such as Bundaberg, Maryborough, Gympie, Bundaberg and Hervey Bay, known more broadly as Wide Bay (average 9.0 per cent), together with Townsville (albeit lower at 8.5 per cent) have elevated jobless rates. Manufacturing jobs in Wide Bay have declined by 1,306 between 2010 and 2016 according to Regional Development Australia.

The average unemployment rate in Coffs Harbour-Grafton on the NSW Mid-North Coast deteriorated to 8.7 per cent over 2017. Pleasingly, the actual unemployment rate fell to 6.1 per cent by year-end. Construction jobs have increased, underpinned by the $3.3 billion Pacific Highway upgrade between Port Macquarie and Coffs Harbour. A further 2,970 workers are expected to be employed on the $4.36 billion Woolgoolga to Ballina road upgrade.

Unemployment also increased along the suburban fringes and city ‘spines’ such as Ipswich (8.1 per cent) in Brisbane and the western suburbs of Melbourne (9.0 per cent). Around 950 jobs were lost at Holden’s Elizabeth factory in Adelaide’s north in October, pushing up the area’s unemployment rate to 7.7 per cent.

Higher income metropolitan areas, especially in Sydney’s coastal suburbs, dominate the regions with the lowest unemployment rates. However, the corridor between Broken Hill and Dubbo has Australia’s lowest regional unemployment rate at 2.9 per cent, benefitting from agricultural, tourism and mining-related jobs growth.

Melbourne satellite city Ballarat has experienced faster and younger population growth than its regional Victorian peers, supporting jobs growth. The unemployment rate in Ballarat has fallen to 4.1 per cent from 5.3 per cent over the year to December.

In Western Australia, Mandurah, south of Perth, experienced a significant decline in the jobless rate to an average of 7.0 per cent in December from 11.2 per cent a year ago. Mandurah has benefited from job-creating projects such as the Dwellingup National Trails Centre and Quambie Park aged care expansion.


Employment Wobbles In December

The latest ABS data on employment to December 2017, shows the trend unemployment rate decreased slightly to 5.4 per cent in December 2017, after the November 2017 figure was revised up to 5.5 per cent.  The trend unemployment rate was 0.3 percentage points lower than a year ago, and is at its lowest point since January 2013.

The seasonally adjusted number of persons employed increased by 35,000 in December 2017. The seasonally adjusted unemployment rate increased by 0.1 percentage points to 5.5 per cent and the labour force participation rate increased to 65.7 per cent.  The number of hours worked fell.

By state, trend employment rose in NT, WA and SA.  Over the past year, all states and territories recorded a decrease in their trend unemployment rates, except the Northern Territory (which increased 1.6 percentage points). The states and territories with the strongest annual growth in trend employment were Queensland and the ACT (both 4.6 per cent), followed by New South Wales (3.5 per cent).

The ABS says monthly trend full-time employment increased for the 14th straight month in December 2017. Full-time employment grew by a further 17,000 persons in December, while part-time employment increased by 8,000 persons, underpinning a total increase in employment of 25,000 persons.

“Full-time employment has now increased by around 322,000 persons since December 2016, and makes up the majority of the 393,000 net increase in employment over the period,” the Chief Economist for the ABS, Bruce Hockman, said.

Over the past year, trend employment increased by 3.3 per cent, which is above the average year-on-year growth over the past 20 years (1.9 per cent). The last time it was 3.3 per cent or higher was in September 2005.

The trend monthly hours worked increased by 4.0 million hours (0.2 per cent), with the annual figure also reflecting strong growth over the year (3.6 per cent).

The labour force participation rate remained at 65.5 per cent after the November 2017 number was revised up, the highest it has been since March 2011. The female labour force participation rate also increased to a further historical high of 60.4 per cent, having increased steadily over the past year.


US Employment Data December 2017

The US Bureau of Labor Statistics has released data to end December 2017. More evidence of the strength of the US economy, and potential justification for more Fed rate rises.

Total nonfarm payroll employment increased by 148,000 in December, and the unemployment rate was unchanged at 4.1 percent. Employment gains occurred in health care, construction, and manufacturing.

Seasonally adjusted household survey data have been revised using updated seasonal adjustment factors, a procedure done at the end of each calendar year. Seasonally adjusted estimates back to January 2013 were subject to revision.

Household Survey Data

In December, the unemployment rate was 4.1 percent for the third consecutive month. The number of unemployed persons, at 6.6 million, was essentially unchanged over the month. Over the year, the unemployment rate and the number of unemployed persons were down by 0.6 percentage point and 926,000, respectively.

Among the major worker groups, the unemployment rate for teenagers declined to 13.6 percent in December, offsetting an increase in November. In December, the unemployment rates for adult men (3.8 percent), adult women (3.7 percent), Whites (3.7 percent), Blacks (6.8 percent), Asians (2.5 percent), and Hispanics (4.9 percent) showed little or no change.

Among the unemployed, the number of new entrants decreased by 116,000 in December. New entrants are unemployed persons who never previously worked.

The number of long-term unemployed (those jobless for 27 weeks or more) was little changed at 1.5 million in December and accounted for 22.9 percent of the unemployed. Over the year, the number of long-term unemployed declined by 354,000.

The labor force participation rate, at 62.7 percent, was unchanged over the month and over the year. The employment-population ratio was unchanged at 60.1 percent in December but was up by 0.3 percentage point over the year.

The number of persons employed part time for economic reasons (sometimes referred to as involuntary part-time workers) was essentially unchanged at 4.9 million in December but was down by 639,000 over the year. These individuals, who would have preferred full-time employment, were working part time because their hours had been cut back or because they were unable to find a full-time job.

In December, 1.6 million persons were marginally attached to the labor force, about unchanged from a year earlier. (The data are not seasonally adjusted.) These individuals were not in the labor force, wanted and were available for work, and had looked for a job sometime in the prior 12 months. They were not counted as unemployed because they had not searched for work in the 4 weeks preceding the survey.

Among the marginally attached, there were 474,000 discouraged workers in December, little changed from a year earlier. (The data are not seasonally adjusted.) Discouraged workers are persons not currently looking for work because they believe no jobs are available for them. The remaining 1.1 million persons marginally attached to the labor force in December had not searched for work for reasons such as school attendance or family responsibilities.

Establishment Survey Data

Total nonfarm payroll employment rose by 148,000 in December. Job gains occurred in health care, construction, and manufacturing. In 2017, payroll employment growth totaled 2.1 million, compared with a gain of 2.2 million in 2016.

Employment in health care increased by 31,000 in December. Employment continued to trend up in ambulatory health care services (+15,000) and hospitals (+12,000). Health care added 300,000 jobs in 2017, compared with a gain of 379,000 jobs in 2016.

Construction added 30,000 jobs in December, with most of the increase among specialty trade contractors (+24,000). In 2017, construction employment increased by 210,000, compared with a gain of 155,000 in 2016.

In December, manufacturing employment rose by 25,000, largely reflecting a gain in durable goods industries (+21,000). Manufacturing added 196,000 jobs in 2017, following little net change in 2016 (-16,000).

Employment in food services and drinking places changed little in December (+25,000). Over the year, the industry added 249,000 jobs, about in line with an increase of 276,000 in 2016.

In December, employment changed little in professional and business services (+19,000). In 2017, the industry added an average of 44,000 jobs per month, in line with its average monthly gain in 2016.

Employment in retail trade was about unchanged in December (-20,000). Within the industry, employment in general merchandise stores declined by 27,000 over the month. Retail trade employment edged down in 2017 (-67,000), after increasing by 203,000 in 2016.

Employment in other major industries, including mining, wholesale trade, transportation and warehousing, information, financial activities, and government, changed little over the month.

The average workweek for all employees on private nonfarm payrolls was unchanged at 34.5 hours in December. In manufacturing, the workweek edged down by 0.1 hour to 40.8 hours, while overtime remained at 3.5 hours. The average workweek for production and nonsupervisory employees on private nonfarm payrolls was unchanged at 33.8 hours.

In December, average hourly earnings for all employees on private nonfarm payrolls rose by 9 cents to $26.63. Over the year, average hourly earnings have risen by 65 cents, or 2.5 percent. Average hourly earnings of private-sector production and nonsupervisory employees increased by 7 cents to $22.30 in December.

The change in total nonfarm payroll employment for October was revised down from +244,000 to +211,000, and the change for November was revised up from +228,000 to +252,000. With these revisions, employment gains in October and November combined were 9,000 less than previously reported. (Monthly revisions result from additional reports received from businesses and government agencies since the last published estimates and from the recalculation of seasonal factors.) After revisions, job gains have averaged 204,000 over the last 3 months.

Unemployment Remained Steady In November 2017

The ABS released the November 2017 employment data today. Overall, the rates remained steady at 5.4% but in trend and seasonally adjusted terms.  But there are considerable differences across the states, and age groups. Female part-time work grew, while younger persons continued to struggle to find work.

Full-time employment grew by a further 15,000 persons in November, while part-time employment increased by 7,000 persons, underpinning a total increase in employment of 22,000 persons. Over the past year, trend employment increased by 3.1 per cent, which is above the average year-on-year growth over the past 20 years (1.9 per cent).

Trend underemployment rate decreased by 0.2 pts to 8.4% over the quarter and the underutilisation rate decreased by 0.3 pts to 13.8%; both quite high.

The unemployment rate was highest in WA at 6.2% and is still rising, while the lowest was in the ACT at 3.8% and falling.  The rate was 4.6% in NSW, 5.7% in VIC,  5.8% in QLD and SA. TAS was 5.9% and NT 4.6%; all in trend terms.

The ABS said that overall employment increased 22,200 to 12,380,100, unemployment decreased 2,900 to 707,300, the participation rate increased less than 0.1 pts to 65.4% and the monthly hours worked in all jobs increased 3.8 million hours (0.2%) to 1,734.4 million hours.

Trend unemployment rate remains at 5.5 per cent

The monthly trend unemployment rate remained at 5.5 per cent in October 2017, according to figures released by the Australian Bureau of Statistics (ABS) today. This reflects the continued strength in employment growth in the Australian labour market.

Monthly trend full-time employment increased for the 13th straight month in October 2017. Full-time employment grew by a further 16,000 persons in October, while part-time employment increased by 4,000 persons.

“Full-time employment has now increased by around 289,000 persons since October 2016, and makes up the majority of the 347,000 person net increase in employment over the period,” Chief Economist for the ABS, Bruce Hockman, said.

“Over the past year, trend employment increased by 2.9 per cent, which is above the average year-on-year growth over the past 20 years (1.9 per cent).”

The labour force participation rate remained at 65.2 per cent for a second month, the highest it has been since April 2012.

The trend monthly hours worked increased by 3.5 million hours (0.2 per cent), with the annual figure also showing strong growth (3.1 per cent). This is consistent with the continued growth in full-time employment.

Mr Hockman added: “Over the past year, the states and territories with the strongest annual growth in employment were Queensland (4.6 per cent), ACT (3.1 per cent), Tasmania (3.0 per cent) and Victoria (2.8 per cent).”

Trend series smooth the more volatile seasonally adjusted estimates and provide the best measure of the underlying behaviour of the labour market.

The seasonally adjusted number of persons employed increased by 4,000 in October 2017. The seasonally adjusted unemployment rate decreased by 0.1 percentage points to 5.4 per cent and the labour force participation rate decreased to 65.1 per cent.

Trend unemployment rate lowest in 4 years

The monthly trend unemployment rate has decreased by 0.2 per cent over the past year to 5.5 per cent in September 2017, according to figures released by the Australian Bureau of Statistics (ABS) today. This is the lowest rate seen since March 2013 and reflects the strength in employment growth over the past 12 months.

But it is worth noting the underemployment trend rate (proportion of employed persons) rate still does not look that flash, especially in TAS, SA and WA.

“The trend unemployment rate had been hovering in the range of 5.6 to 5.8 per cent for almost two years, but has now dropped to a four year low of 5.5 per cent,” the Chief Economist for the ABS, Bruce Hockman, said.

The trend monthly unemployment rate for both males and females dropped to 5.5 per cent, also for the first time since March 2013.

The trend participation rate remained steady at 65.2 per cent. The male participation rate was 70.8 per cent, while the female participation rate reached a record high of 59.9 per cent.

Monthly trend full-time employment increased for the 12th straight month in September 2017. Full-time employment grew by a further 16,000 persons in September, while part-time employment increased by 8,000 persons, underpinning a total increase in employment of 24,000 persons.

“Full-time employment has now increased by around 271,000 persons since September 2016, and makes up the majority of the 335,000 person net increase in employment over the period,” Mr Hockman said.

Over the past year, trend employment increased by 2.8 per cent, which is above the average year-on-year growth over the past 20 years (1.9 per cent).

Over the past year, the states with the strongest annual growth in employment were Queensland (4.1 per cent), Tasmania (3.9 per cent), Victoria (3.1 per cent) and Western Australia (2.9 per cent).

The trend monthly hours worked increased by 3.1 million hours (0.18 per cent), with the annual figure also showing strong growth (2.9 per cent).

Trend series smooth the more volatile seasonally adjusted estimates and provide the best measure of the underlying behaviour of the labour market.

The seasonally adjusted number of persons employed increased by 20,000 in September 2017. The seasonally adjusted unemployment rate decreased by 0.1 percentage points to 5.5 per cent and the labour force participation rate remained steady at 65.2 per cent.

The Disconnect Between Unemployment and Wages

There is an assumption that as employment rates and growth picks up,  the much needed wage growth will follow. We discussed this on ABC’s The Business last week, with HSBC’s Chief Economist who held the view that the RBA won’t lift the cash rate here until wages growth comes through. We were not so sure.

But an interesting piece from the The IMFBlog suggests there are more fundamental forces at work, especially in terms of employment patterns and the rise of part-time work, which suggests that unemployment and wage growth is more disconnected now. We think underemployment is one of the most critical drives of wage stagnation. If this is true, then wages may be lower for longer, which is not good news for those households with heavy debt burdens, especially if rates rise. We release our September analysis of mortgage stress next week. Here is the IMF commentary:

Over the past three years, labor markets in many advanced economies have shown increasing signs of healing from the Great Recession of 2008-09. Yet, despite falling unemployment rates, wage growth has been subdued–raising a vexing question: Why isn’t a higher demand for workers driving up pay?

Our research in the October 2017 World Economic Outlook sheds light on the sources of subdued nominal wage growth in advanced economies since the Great Recession.  Understanding the drivers of the disconnect between unemployment and wages is important not only for macroeconomic policy, but also for prospects of reducing income inequality and enhancing workers’ security.

Job growth picked up, wage growth less so

In many cases, employment growth has picked up and headline unemployment rates are now back to their pre-Great Recession ranges. Still, nominal wage growth remains well below where it was prior to the recession. Sluggish wages may reflect deliberate efforts to slow down wage growth from unsustainably high levels, as was the case with some countries in Europe. But the pattern is more widespread.

There are several factors at play in explaining this pattern, both cyclical and structural – or slow-moving – in nature.

A key cyclical factor is labor market slack – that is, the excess supply of labor beyond the amount that firms would like to employ.

First off, however, it is important to recognize that headline unemployment rates may not be as indicative of labor market slack as they used to be. Hours per worker have continued to decline (extending a trend that began before the Great Recession).

Several countries have also experienced higher rates of involuntary part-time employment (workers employed for less than 30 hours per week who report they would like to work longer) and an increased share of temporary employment contracts These developments in part reflect continued weak demand for labor (itself a reflection of weak final demand for goods and services).

Another key driver of wage growth is the widely-recognized slowdown in trend productivity growth. Sustained weakness in output per hour worked can squeeze business profitability and eventually weigh on wage growth as firms becomes less willing to accommodate fast increases in compensation.

Slower-moving factors

Besides these forces, slower-moving factors such as ongoing automation (proxied by the falling relative price of investment goods) and diminished medium-term growth expectations also appear to hold back wage growth. However, our analysis suggests that automation may not have made a large contribution to subdued wage dynamics following the Great Recession.

The analysis also indicates sizable common global factors behind wage weakness in the aftermath of the Great Recession and especially during 2014–16. In other words, labor market conditions in other countries appear to have a growing effect on wage setting in any given economy. This points to the possible roles of the threat of plant relocation across borders, or an increase in the effective worldwide supply of labor in a context of closer international economic integration.

Putting it all together

The relative roles of labor market slack and productivity growth vary across countries. In economies where unemployment rates are still appreciably above their averages before the Great Recession (such as Italy, Portugal, and Spain), high unemployment can explain about half of the slowdown in nominal wage growth since 2007, with involuntary part-time employment acting as a further drag on wages. Wage growth is therefore unlikely to pick up until slack diminishes meaningfully—an outcome that requires continued accommodative policies to boost aggregate demand.

In economies where unemployment rates are below their averages before the Great Recession (such as Germany, Japan, the United States, and the United Kingdom), slow productivity growth can account for about two-thirds of the slowdown in nominal wage growth since 2007. Even here, however, involuntary part-time employment appears to be weighing on wage growth, suggesting greater slack in the labor market than headline unemployment rates capture. Assessing the true degree of slack in these economies will be important when determining the appropriate pace of exit from accommodative monetary policies.

Broader changes in the labor market

Our research further indicates that sluggish wage growth has occurred in a context of broader changes in the labor market. The increase in involuntary part-time employment itself, for example, is in part explained by cyclically-weak demand.  Accommodative policies that help lift aggregate demand would therefore lower involuntary part-time employment. But it is also associated with slower-moving factors such as automation, diminished medium-term growth expectations, and the growing importance of the service sector.

Some of these developments represent persistent changes in relationships between firms and workers that mirror underlying shifts in the economy – with the emergence of the gig economy and shrinkage of traditional sectors such as manufacturing. Policymakers may therefore need to enhance efforts to address the vulnerabilities that part-time workers face. Examples of possible measures include broadening minimum wage coverage where it does not currently include part-time workers; securing parity with full-time workers by extending pro-rated annual, family, and sick leave; and strengthening secondary and tertiary education to upgrade skills over the longer term.