
Watch Thursday 12:30.
Tag: DFA Research
Decoding 60 Minutes
A quick review of the DFA contribution to 60 Minutes aired last night.
We covered the issues of home price falls, negative equity and property construction standards.
See our more detailed post on negative equity.
Decoding Property Buying Intentions – “You Ain’t Seen Nothing Yet”
We look at the results from our latest household surveys. Who is intending to buy and sell in the current climate?

Please consider supporting our work via Patreon
Please share this post to help to spread the word about the state of things….

/
RSS Feed
Decoding Property Buying Intentions – “You Ain’t Seen Nothing Yet”
We have completed the latest round of our 52,000 household surveys, and today we discuss the results relating to property buying intentions by extracting the data from our Core Market Model. It was this data six months back which enabled us to predict the currently observed slowdown in sales, auction clearances and home prices.
So what is in store for the next few months? Well, in short its more of the same, only more so, with more households reporting difficulties in obtaining finance, fewer expecting to transact in the next year and to see home prices rise.
So we start with transaction intentions. The first startling observation is the fall in the number of property investors, including those who hold portfolios of investment properties intending to transact. 20% of portfolio investors are expecting to transact, and the bulk of these intend to sell a property, compared with a year ago when 50% said they would transact, and most were looking to add to their portfolios. Most solo property investors are now on the side lines, with around 10% expecting to transact, and most of these on the sell side. Demand for investment property will continue to fall, as rental yields and capital appreciation fall.
![]() On the other hand, the number of people trading down is rising, with more than 50% of these looking to sell before prices fall further. There is some demand from first time buyers, and up-traders, but the net conclusion is there will be more property coming to market and fewer buyer, so prices are set to fall further, and quite quickly. The spring season appears all but shot.
On the other hand, the number of people trading down is rising, with more than 50% of these looking to sell before prices fall further. There is some demand from first time buyers, and up-traders, but the net conclusion is there will be more property coming to market and fewer buyer, so prices are set to fall further, and quite quickly. The spring season appears all but shot.
These trends are mirrored in the demand for credit. Property investors are now less likely to borrow, while those trading-up and first time buyers are still in the market (but in terms of volumes this is a smaller group). Refinance households are still in the market for a replacement loan, but these do not add to new demand for credit.
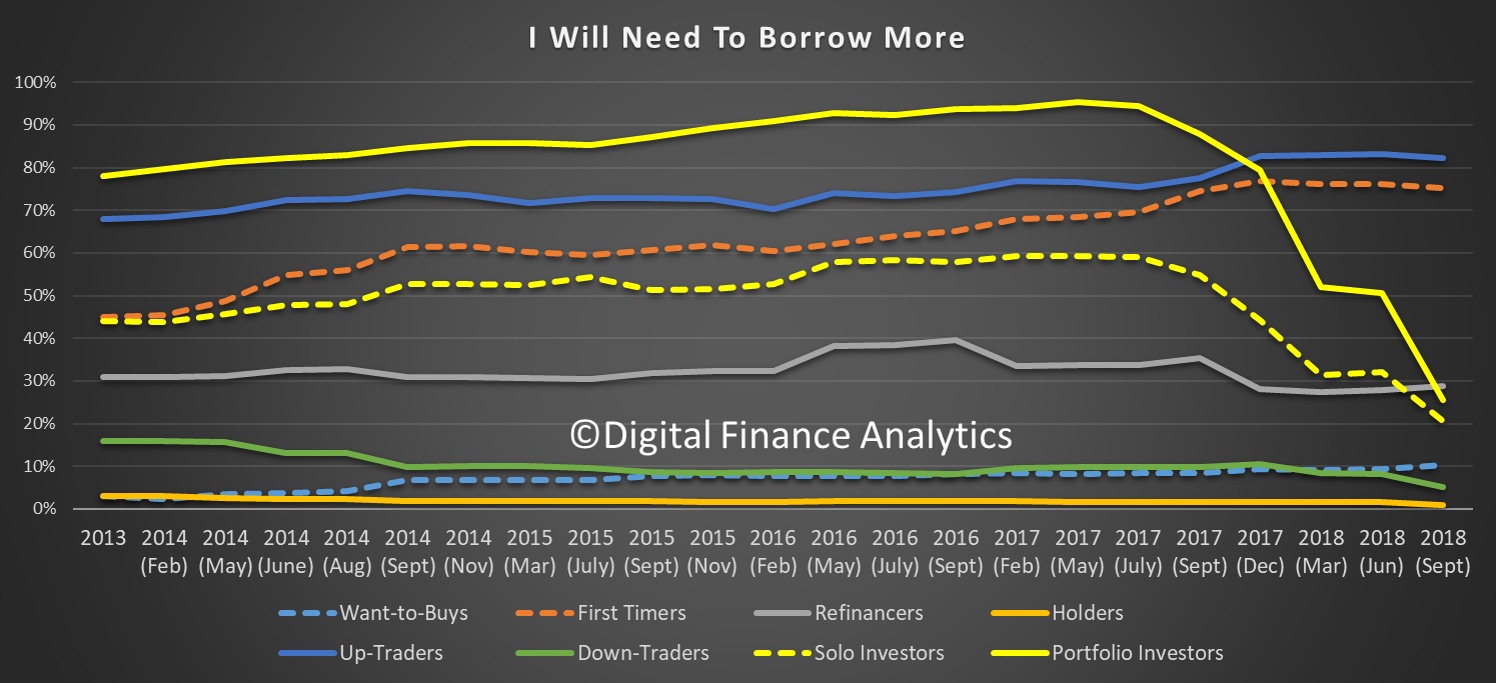 As a result, we expect demand for credit to wilt further in the months ahead. Of course for the banks to maintain their profit output they need to see real growth in new credit, we do not expect that will eventuate, so credit will continue to ease.
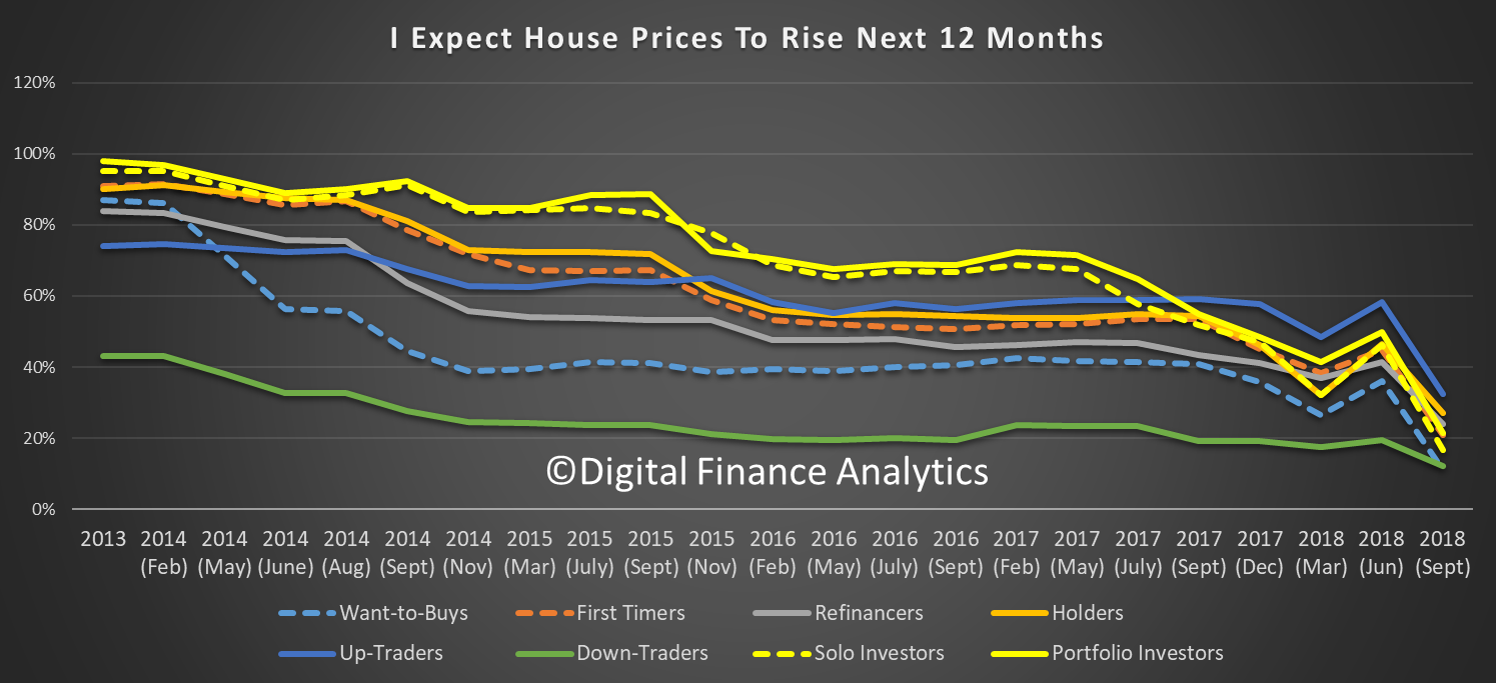
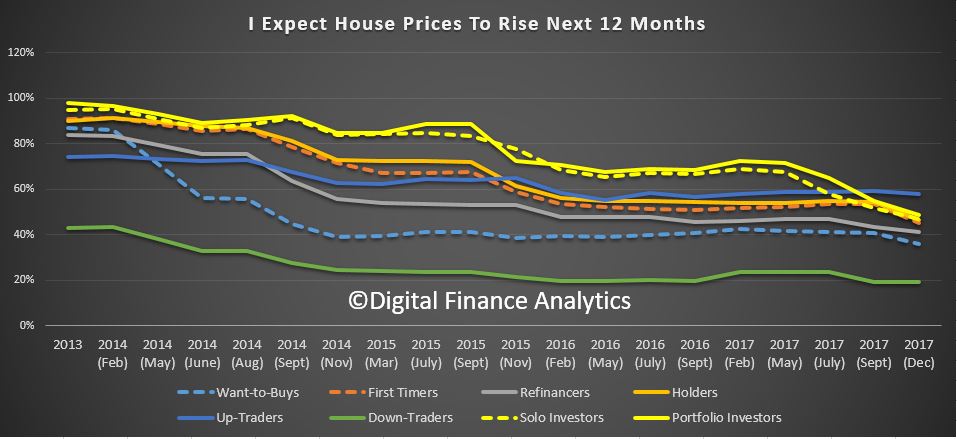
Universally, households are less bullish on home price growth, than a year ago, with a sharp down turn since June 2018. Down traders are the least likely to expect rises at 18%, while 35% of those trading up were bullish on home price values. Property investors are getting less and less positive about future price accumulation.
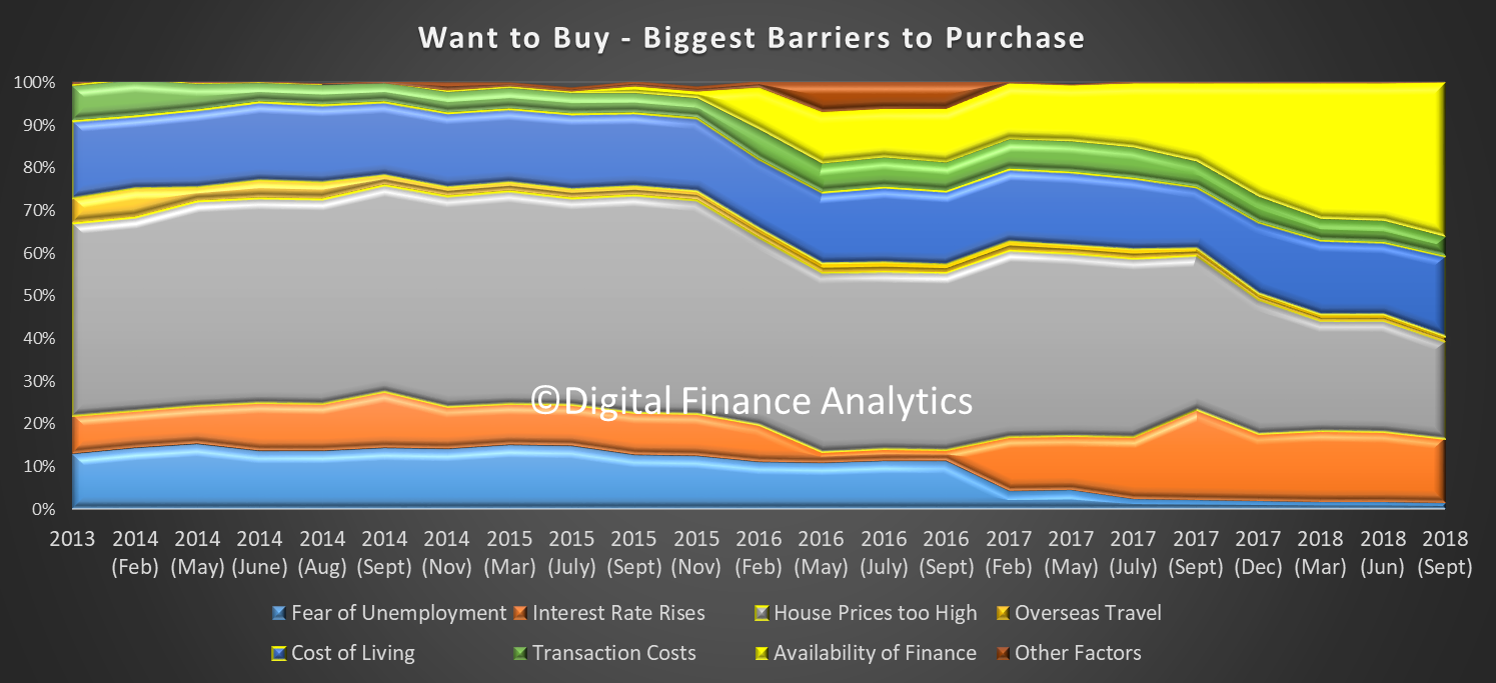
 Turning to the specific segments, 36% of those wanting to buy, but who cannot, reported their barrier related to the (non) availability of finance. This is a record, and reflects the tighter underwriting standards now in force.
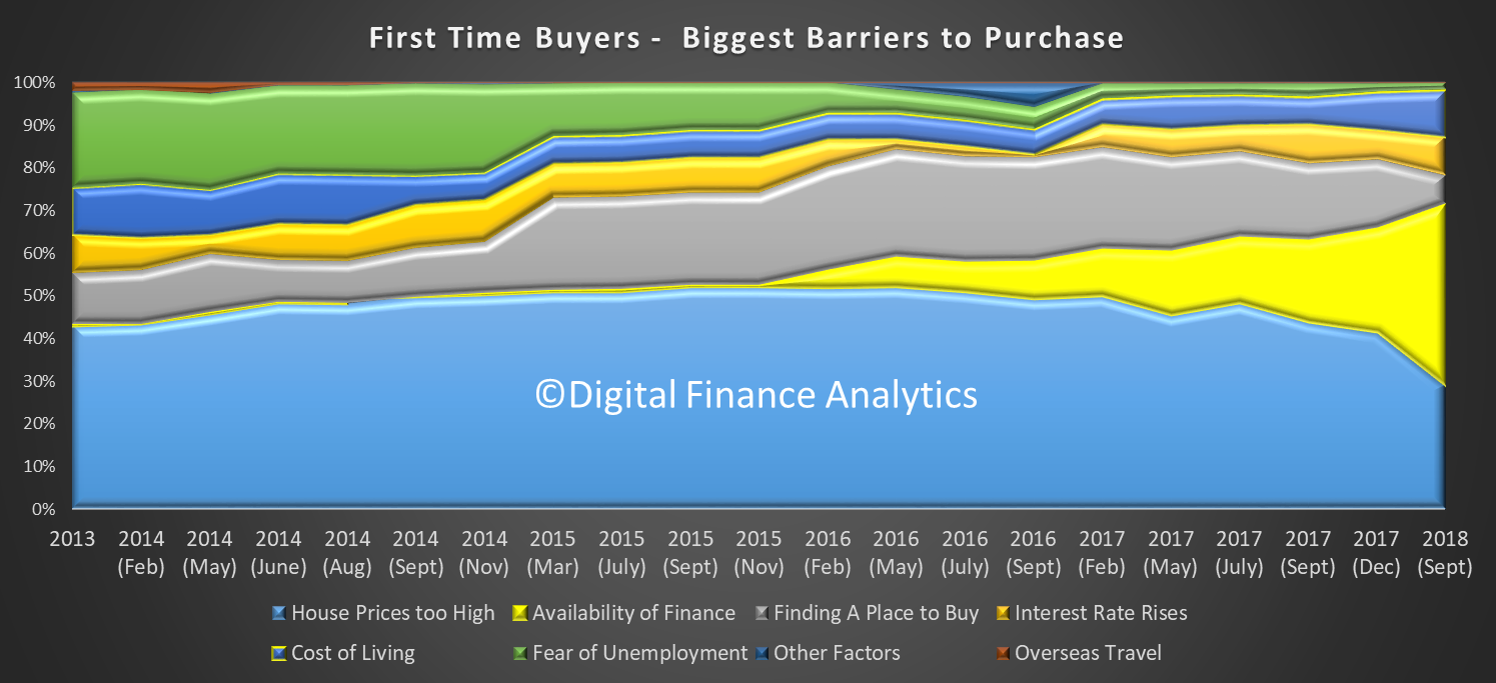
 We find the same thematic among first time buyers where 42% report a problem with finance availability, a record.
 Investors have a similar problem with 36% saying they have issues with finance, and more are now concerned about potential changes in regulation (including Labor’s changes to negative gearing).
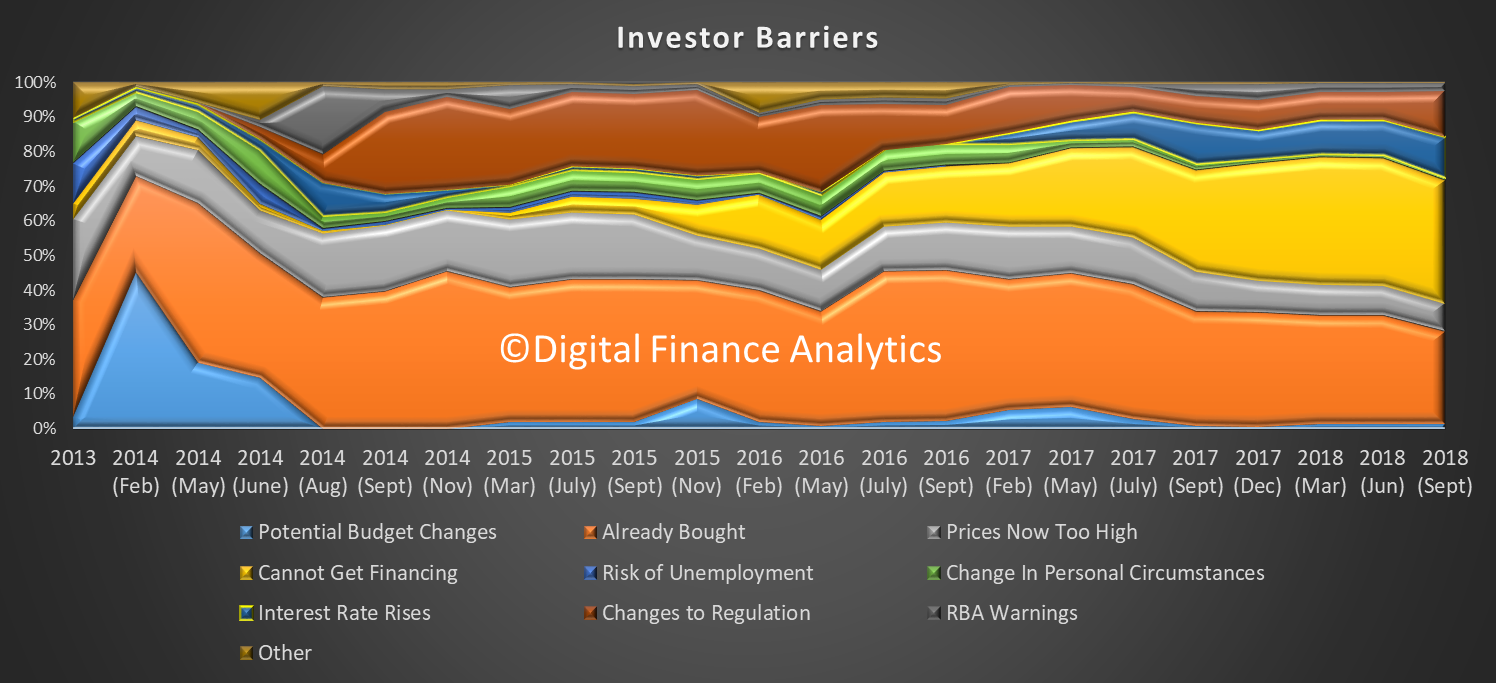 In fact, Investors are ever more reliant on the tax breaks, as capital growth eases. 40% are banking on the tax benefits, while 15% expect future capital appreciation.
When we look at the motivations of those seeking to trade down, 48% are looking to capital release, and now few are interested in acquiring an investment property. Increased convenience remains a significant driver.
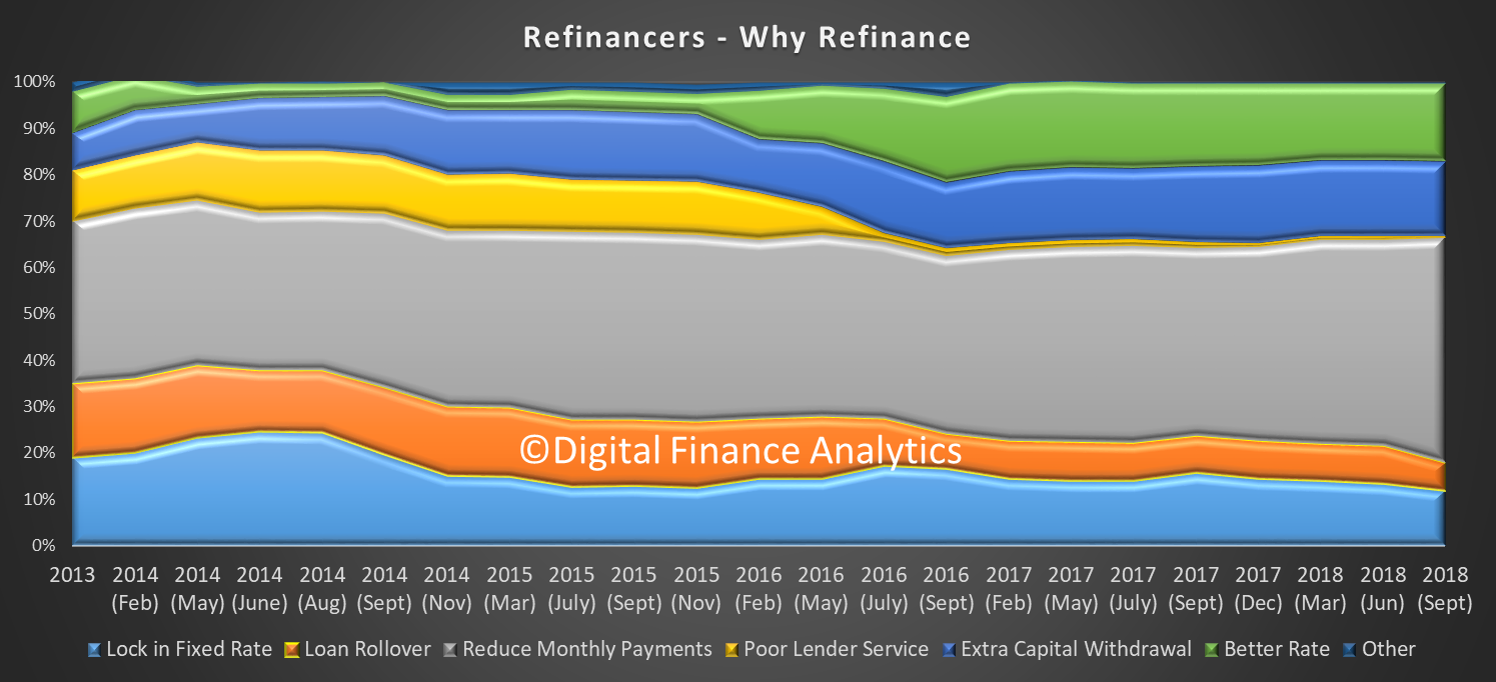
Households seeking to refinance are mainly being driven by a quest to reduce monthly repayments (49%) and there is a high correlation with those experiencing mortgage stress, as we reported yesterday. Lender service, or the lack of it, does not seem to count for much.
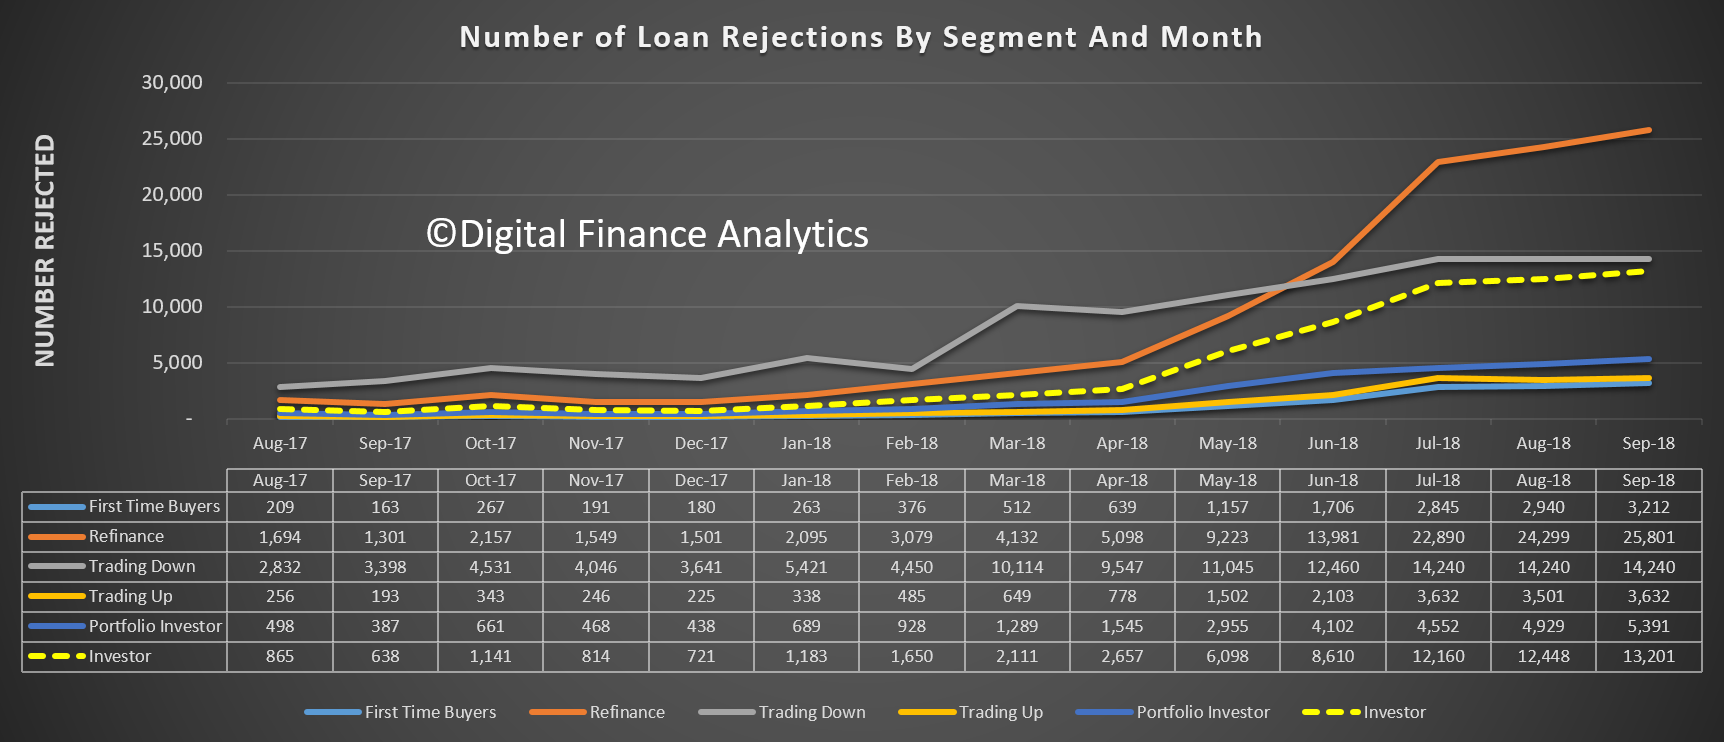
 And finally, to ice the cake, as it were, the number of loan rejections continues to rise, especially among refinance and investor cohorts.
 Add this new data to the other factors:
- Tighter Lending Standards – focus on income AND expenses, not HEM
- Mortgage Borrowing Power dropped up to 40%
- Foreign Buyers dropped 35%, and significant hike in extra fees and taxes
- SMSF borrowing restricted
- Interest Only Borrowing Restricted ($120 billion for reset each year)
- Investors less likely to transact, as capital growth reverses
- Tighter returns on rentals (half under water in cash flow terms)
- Higher interbank funding costs
- Rising mortgage costs and rates (NAB holds)
- Risk from Class Actions and Royal Commission
- Etc…
and there is plenty to suggest further home price falls are in the offing. We will add this new set of data into our scenarios, and we will update our findings in a future post.
But our conclusion is “you ain’t seen nothing yet” to quote an old Bachman Turner Overdrive song from 1974!
A Summary Of My Current Views
Caddie’s Content and Engagement Manager, Chris Barnett, recently caught up with Founding Principal of Digital Finance Analytics, Martin North, to get his insights on the current economic landscape, including the RBA, interest-only loans, the housing market and plenty more.

Read on to find out what Martin had to say…
Chris: The Reserve Bank recently set the Australian record for the longest consecutive period without a rate movement. There is no consensus in the industry as to when rates will rise, some are predicting spring, other say it won’t be till 2020. When do you forecast rates will rise and why?
Martin: The RBA is driven most strongly by its inflation mandate, plus the desire for financial stability.
Their public statements are to the effect that the next rate move is likely to be up, not down.
But given the current economic and employment data, plus wages growth we see little evidence that a rate rise will happen any time soon.
However, there are more risks on the downside, as the FED lifts rates in the US, and so flows through to the capital markets.
This could translate to banks here needing to lift their mortgage rates (the BBSW has been somewhat higher of late).
Of more concern would be a local or global economic shock, requiring a rate cut. Given the number of uncertainties (from the middle east, North Korea, Italy, Trade Wars etc.) the RBA may have to react to a downturn.
So the RBA may cut rates to counteract this effect, as they are conscious of the pressure on household budgets.
That said, rates are low now, so there is little wriggle room, and banks may not pass on cuts at these low levels.
Our central scenario is no movement for at least the next 12 months.
Chris: One of the buzz words in the property market is “interest only loans”, you have regularly written about the risk these loans pose to the property market. What key warning indicators should Financial Advisers been look for regarding a client’s interest only loan?
Martin: Interest only loans were in vogue up until a few months back, thanks to lower servicing costs and the ability to maximise the interest tax offset by keeping capital repayments to a minimum.
At an industry level more than 40% of loans were being written as interest only loans, mainly to property investors. Some lenders have more than half their loan portfolios in interest only.
However, there are higher risks to interest only lending, especially if a slowing market, because the assumption often is that the capital, which needs to be repaid at some point, requires the sale of the asset.
In a falling market this may not work, and from our surveys around half of interest only borrowers have no firm plans as to how to repay.
Others may not be aware they have an interest only loan.
APRA came to this late but has since specified tighter lending criteria, for example, a 20% hair cut on rental streams, the need to ignore any potential tax breaks, and the requirements to assess a loan on a principal and repayment basis on review (which often is a 5-year fixed term).
In addition, lenders are required to document the firm plans a borrower has to repay later.
So we estimate around $120 billion of ~$700 billion interest only loans will not be refinanced on next reset, requiring the borrower to agree to a more expensive principal and interest loans (monthly repayments would rise by 20% or more).
Most of these problem loans will hit in the next 2 -3 years.
Whilst there are some mitigating offsets – for example that the interest rate on a principal and interest loan are lower – this has the potential to become a structural issue for investors in Australia.
Some will be forced to sell, as happened in the UK when they executed a similar strategy a few years ago.
So Advisers need to consider whether borrowers have firm repayment plans, can service the loan assessed on a principal and interest basis, and the implication of the 20% haircut on rental streams.
Some potential borrowers may not meet current requirements, and risk being sold unsuitable loans, with the potential of litigation later.
Chris: Based off your industry analysis what do you expect from the housing market in the next 12 to 24 months. Will it grow, will it contract, or will it remain steady and how by what percentage do you expect the market to shift?
Martin: My central scenario is home prices will fall 15-20% over the next couple of years as lending rules are tightened, thus reducing credit availability.
Credit is by far the strongest influence of home price movements.
Demand from investors, both local and foreign buyers, is falling, and while there is a small uptick in first time buyers, this is not sufficient to keep prices going higher.
Migration alone won’t hold the market up. We have already see a fall in auction clearance rates to mid-50’s down from mid-70’s last year.
Our worst case scenario is a fall of up to 40%, with the top of the market dropping the fastest.
It is unlikely that extra incentives to, for example first time buyers will change this outcome.
Thus we expect building approvals to be weaker in the months ahead.
Chris: A follow on from the above, do you expect the movement in the housing market will be uniformed across Australia or do you expect some capital cities or regional areas to buck the trend?
Martin: Prices will fall fastest in Sydney, then Melbourne, where rises have been strong in recent years, but because of the size of these relative markets, there will be a spill over effect elsewhere.
Regional prices, which have not risen so fast recently may be more resilient.
We do not expect Perth, which has languished in recent years to buck the national trends.
Chris: The Australian property market is quite diverse regarding who owns property, you have retirees, mums and dads, first home buyers, investors and many more.Which demographic do you think is most at risk in the current market and why?
Martin: Property investors are most at risk, and most fickle in a down turn. We are already seeing some selling before prices fall further, especially in Sydney.
In addition, prospective investors are sitting on the sidelines believing that prices will fall further.
There are more than 1.2 million down traders – people seeking to sell to release capital, and these are a risk, if prices fall.
Many need to sell to fund their retirement, or other investments.
First time buyers need to be careful buying in at the top of the market. They might prefer to wait to prices to fall further, as we think they will.
People living in a property, wishing to move, however should still do so, assuming the market is not frozen, because the value of one house, is the value of one house.
If you sell and buy at the same time, the relative movement of prices is less significant.
Finally, those seeking to trade up, to buy a larger place, may prefer to wait, again because relatively the top end of the market is likely to fall fastest.
Chris: Final question for the day – You have been involved in Financial sector for over 25 years now, if you could go back in time and give yourself once piece of advice when you first started out, what would that advice be?
Martin: First, understand the power of compounding – interest on interest – time in market is your friend. So be in the market, and stay in the market.
Second, no one knows the future – it’s all a guess, and mostly people will be wrong. This includes the experts. Be skeptical.
Third, fees in particular erode returns, and so do consider ongoing fees and charges – even small changes to fees have a significant impact on results.
Fourth – build a cash flow so you understand your finances – only half of households have any real sense of their net available cash flow after outgoings. You cannot manage what you do now know.
Finally, diversify – do not just bet on say property or shares, best to spread the risk. And keep some funds liquid so you are not forced to transact in a falling market.
Latest Survey Results Are In – The Great Property Rotation Is On
Digital Finance Analytics has completed the analysis of our latest household surveys, to December 2017. We see some significant shifts in sentiment, which we will discuss in more detail over the next few days. These results will inform our option of likely developments in 2018. But here is a summary.
- First, obtaining finance for a mortgage is getting harder – this is especially the case for some property investors, as well as those seeking to buy for the first time; and those seeking to trade up. Clearly the tightening of lending standards is having a dampening effect. As a result, demand for mortgage finance looks set to ease as we go into 2018 and mortgage growth rates therefore will slide below 6%.
- Next, overall expectations of future price gains have moderated significantly, and property investors are now less expectant of future capital growth in particular. This is significant, as the main driver for investors now is simply access to tax breaks. As a result, we expect home prices to drift lower as demand weakens.
- Mortgage rates have moved deferentially for different segments, with first time buyers and low LVR refinance households getting good deals, while investors are paying significantly more. This is causing the market to rotate.
- Net rental returns are narrowing, so more investors are underwater, pre-tax. So the question becomes, at what point will they decide to exit the market?
Here are some summary slides. We see a falling expectation of home price rises in the next 12 months, across all the DFA household segments. Property Investors are clearly re-calibrating their views, which could have a profound impact on the market. Those seeking to Trade Up are most positive of future capital growth.
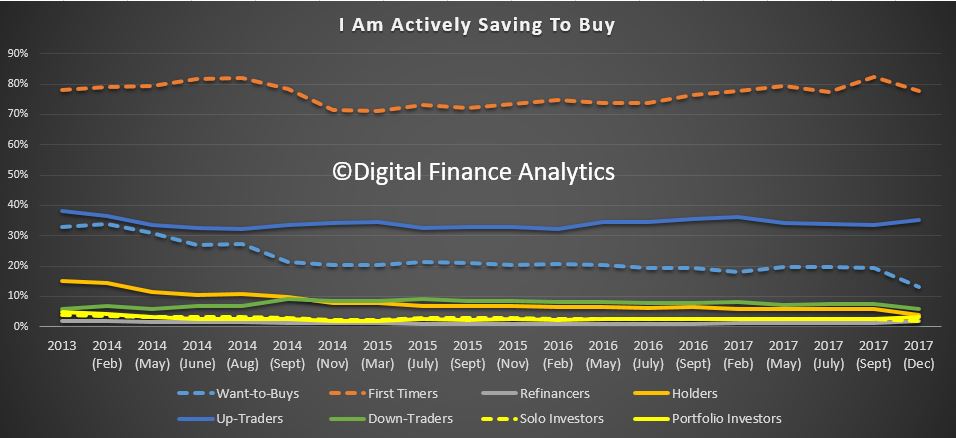
 First time buyers remain the most committed to saving for a deposit, while those who desire to buy, but cannot are saving less.
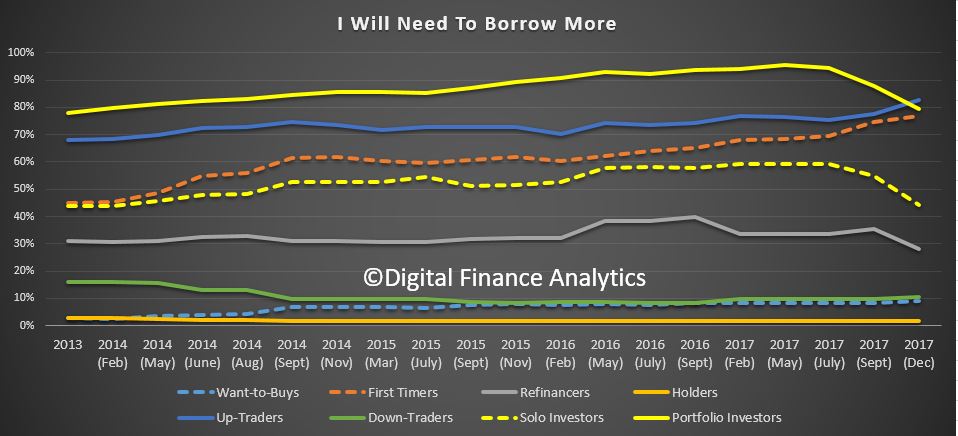
 We see a significant slide in the proportion of property investors and portfolio investors who are looking to borrow more. We will explore the reasons for this change in a later post.
 As a result, the proportion of investors expecting to transact in the next year has fallen. In fact, only Down Traders are slightly more likely to purchase than last time.
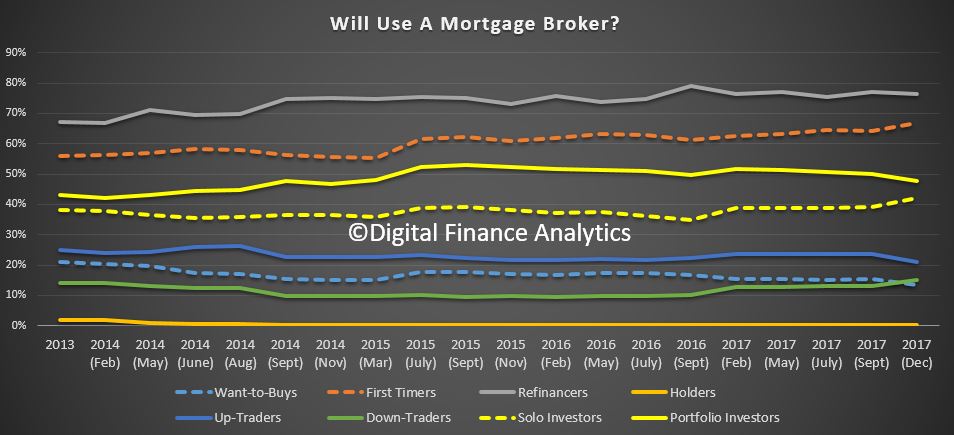
![]() Finally, for today, we see minor changes in the intention to use a mortgage broker.
Finally, for today, we see minor changes in the intention to use a mortgage broker.

We continue to see a pattern where those seeking to refinance, and first time buyers are most likely to turn to a broker. Some other segments are less likely to use the channel to obtain a loan.
 Next time we will look in more detail at the segment specific data. But we can certainly say there is strong evidence now that the property market is rotating, away from investors, and towards owner occupied borrowers. There will be consequences for the market.
Household Financial Security Takes Another Hit In November
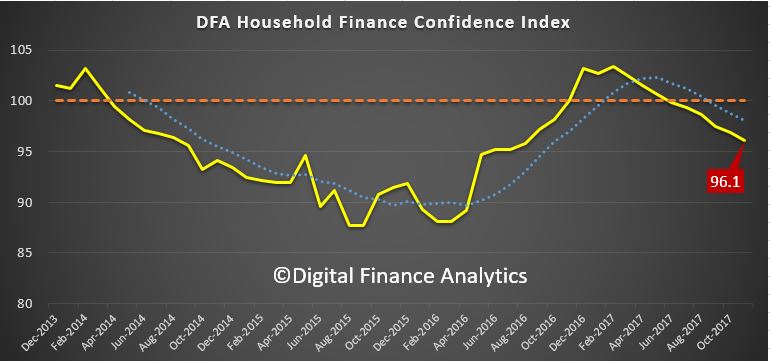
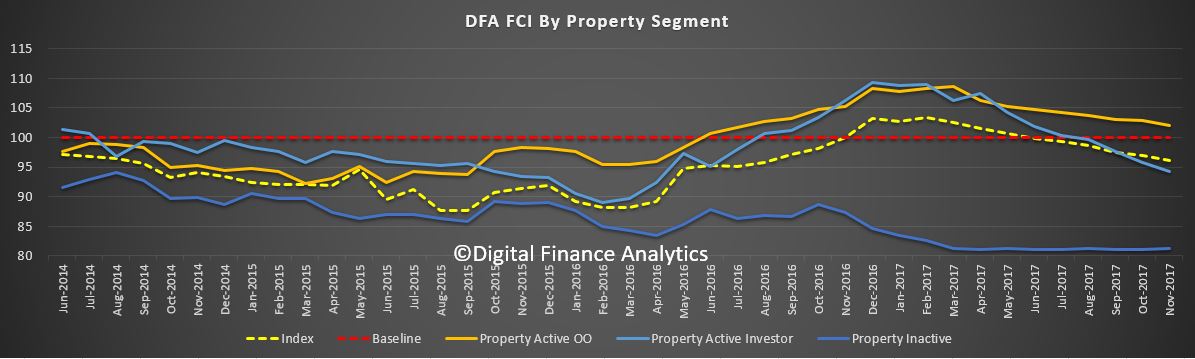
Digital Finance Analytics has released the November 2017 results from our Household Financial Security Index. The index uses data from our household surveys to assess households level of financial comfort.
The index fell to 96.1, which is below the 100 neutral metric, down from 96.9 in October 2017. This is the sixth month in succession the index has been below the neutral point.
 Watch the video or read the transcript.
Owner Occupied households are the most positive, scoring 102, whilst those with investment property are at 94.3, as they react to higher mortgage repayments (rate rises and switching from interest only mortgages), while rental yields fall, and capital growth is stalling, especially in Sydney). Households who are not holding property – our Property Inactive segment – will be renting or living with friends or family, and they scored 81.2. So those with property are still more positive overall.
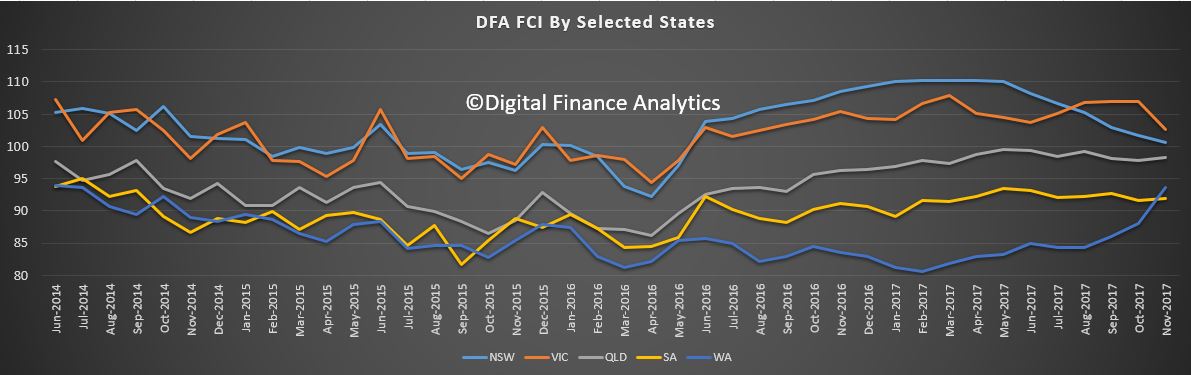
 Looking across the states, households in NSW and VIC are just above the neutral setting, but continue to slipping lower. Households in QLD are below the 100, but up a little, as are those in SA and WA. Western Australian households are the least positive, but somewhat improved.
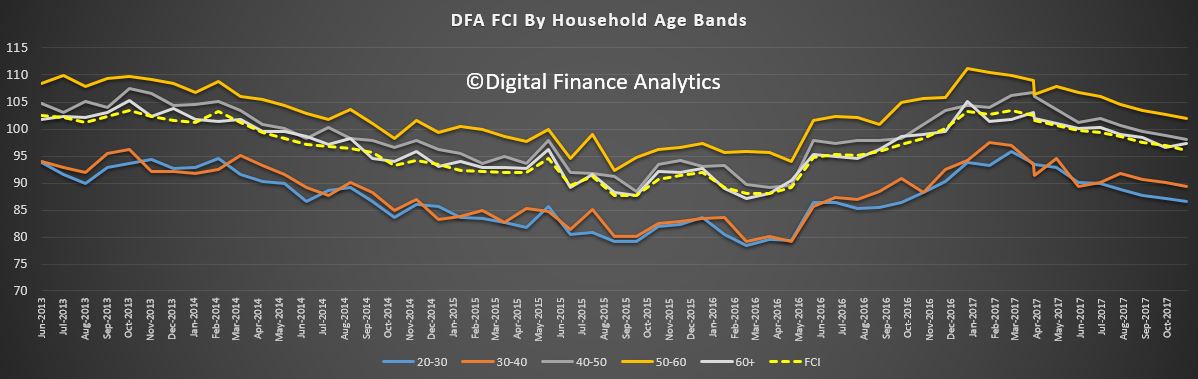
 Looking across the age ranges, younger households are the least positive, and all ages banks fell, other than those over 60 years which saw a small rise.
 Looking at the FCI score card, job security is on the improve, reflecting rising employment participation, and the lower unemployment rate. Around 20% of households feel less secure, especially those with multiple part time jobs.
Savings are being depleted to fill the gap between income and expenditure – as we see in the falling savings ratio. As a result, nearly 40% of households are less comfortable with the amount they are saving. This is reinforced by the lower returns on deposit accounts as banks seek to protect margins.
More households are uncomfortable with the amount of debt they hold with 40% of households concerned. The pressure of higher interest rates on loans, tighter lending conditions, and low income growth all adds to the discomfort. More households reported their real incomes had fallen in the part year, with 50% seeing a fall, while 40% see no change. Only those on very high incomes reported real income growth.
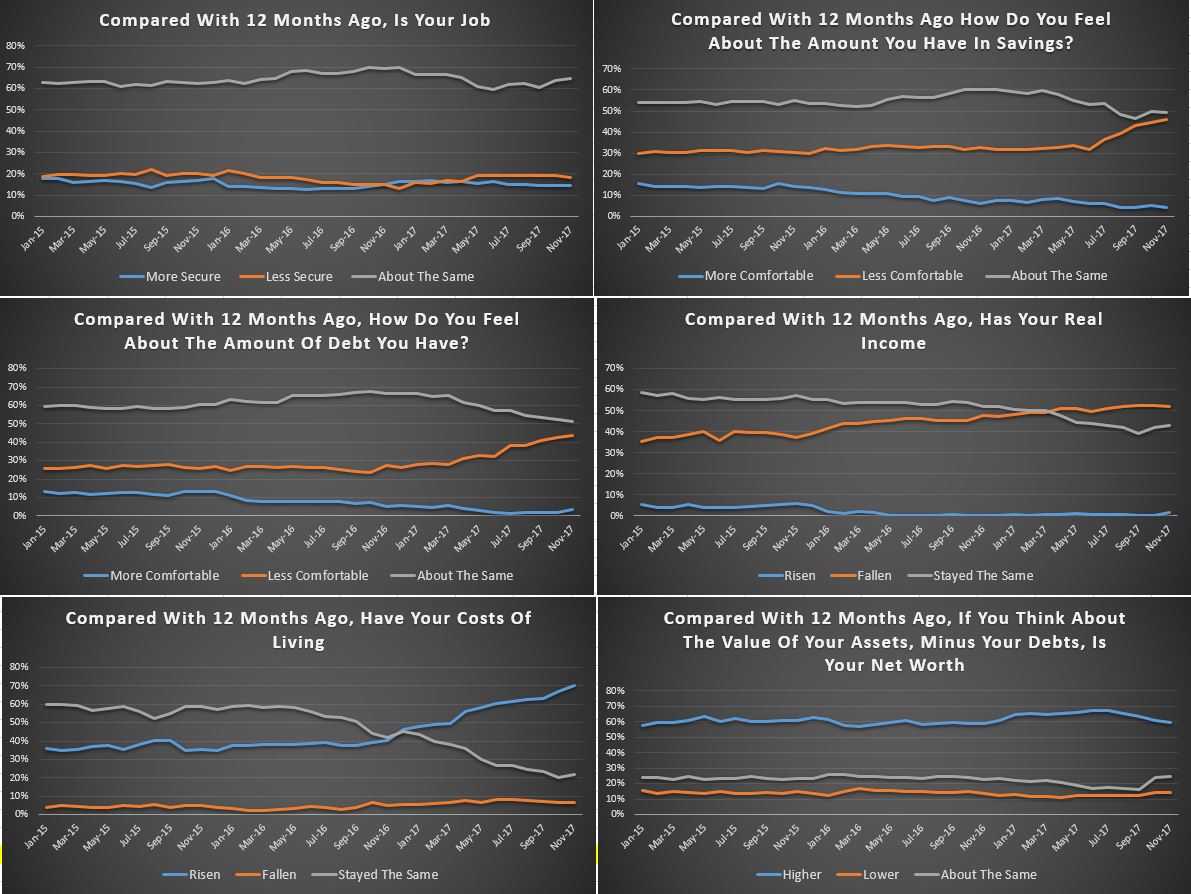 More households reported a rise in their costs of living, and this month this included higher school fees and child care costs, energy bills and fuel costs. The average cpi of around 2% appears to understate the real life experience of many households.
Finally, household net worth improved for more than 60% of households, but there is a rise in those seeing no growth, mainly as home price growth eases back. Those with share market investments have done quite well in recent months.
Looking ahead, we expect the overall index to trend lower, as incomes remain constrained, and costs of living grow. The property market has a big impact on households level of confidence and the leading indicators are flagging lower outcomes ahead. However, home prices would need to fall significantly to allow many of those currently unable to afford to buy in to the market.
By way of background, these results are derived from our household surveys, averaged across Australia. We have 52,000 households in our sample at any one time. We include detailed questions covering various aspects of a household’s financial footprint. The index measures how households are feeling about their financial health. To calculate the index we ask questions which cover a number of different dimensions. We start by asking households how confident they are feeling about their job security, whether their real income has risen or fallen in the past year, their view on their costs of living over the same period, whether they have increased their loans and other outstanding debts including credit cards and whether they are saving more than last year. Finally we ask about their overall change in net worth over the past 12 months – by net worth we mean net assets less outstanding debts.
We will update the results again next month.
The Property Imperative Weekly To 27 May 2017
Are First Time Buyers really under the affordability gun? What will the impact of the surprising slowdown in residential construction be? And how will the bank levy play out in the light of this week’s ratings downgrades? Find out as you watch the latest edition of the Property Imperative weekly.
First, are first time buyers are really finding it more difficult to enter the property market at the moment? The most recent statistics showed there was a bounce in the number of buyers, and this has been attributed to low interest rates, stagnating property price growth and enhanced first home buyer incentives. This despite property investors beating other purchasers to the punch.
Genworth, the Lender Mortgage Insurer, changed their underwriting guidelines to include the First Home Owner Grant as an acceptable source if other true ‘genuine savings’ cannot be found. Genworth’s new conditions also places responsibility on the lender to ensure the borrower is eligible to receive a FHOG at the time of the application.
Demographer Bernard Salt’s jocular observation of young adults wasting money on smashed avocado has been put into perspective. Even if young Australian do give up extravagant brunches and put the funds towards saving for a house, it will take years, or even decades, to accumulate enough cash for the deposit and stamp duty on a home. A 20% deposit and stamp duty required to buy a house in Sydney is $159,000, based on new data from CoreLogic. That’s equivalent to 20 years’ worth of smashed avo.
But then again, do first time buyers really need a 20% deposit? Back in 2015, the Reserve Bank noted: “the deposit required of a first home buyer is more often in the 5–10 per cent range.” Whilst regulators have tightened the screws since then, there are still mortgages with below 20 per cent deposits to be found, according to data from RMIT’s Centre for Urban Research. Many of these rely on access to Lenders Mortgage Insurance, which of course protects the bank, not the borrower directly.
A report from Standard and Poor’s highlighted the risks in the Australian mortgage sector, and said that LMI’s might get squeezed by tightening lending restrictions and elevated claims, especially from loans in Western Australia and Queensland.
Our survey data on First Time Buyers indicates that there is incredibly strong demand for property, from both new migrants and existing residents. But that they are finding it harder to get funding, despite some grants being available, thanks to low returns on deposits, and low or no wage growth which is making it harder to save in the first place. We do see some lenders loosening their lending criteria for first time buyers with a saving history, but they are looking harder at household expenses, so overall funding is still harder to come by than a year ago. Our data shows this clearly, and our latest core market data is available now for paying clients.
So back to the Standard and Poor’s assessment of the housing sector, and their rating of the banks. Some were surprised when the ratings agency came out with an assessment before the latest round of house price data is out, but their latest assessment is finely balanced, on one hand calling out the elevated risks emanating from rising household debt and risks of a property correction, whilst on the other suggesting that recent regulatory intervention should help to manage the adjustment.
But overall, risks are higher and their revised credit profiles reflect this with more than 20 entities downgraded. Whilst the majors rating has not changed – reflecting the implicit government guarantee that their “too-big-to-fail” status gives them, and Suncorp remains at its current rating, despite a tough quarter; both Bendgio Bank and Bank of Queensland took a downgrade.
The consequence for these regionals is that funding costs just went up (and probably by more than a 6 basis point tax on the majors would have given in relative benefit). They have high customer deposits, but again the regional bank playing field is tilting against them when it comes to long term funding. This put the bank tax into a different light, as the Government argued the tax would help level the playing field.
In addition, the big banks came out with an estimate of the impact of the proposed tax. The budget papers estimated it would yield more than $6 billion over 4 years, based on a 6 basis charge on selected liabilities. The banks say on an annual pre-tax basis they would pay around $1.38 billion annually, but only $965m post tax (as the tax would be an allowable expense). The Government confirmed the tax would be tax deductable.
So, the tax won’t deliver the planned revenue, and the 6 basis points benefit the regional banks might have been expected to see relative to the majors has been more than offset by the credit downgrades. This has led to calls to lift the tax to deliver the full planned value, and also extend it to large foreign banks operating here.
But there is a broader point to consider. The majors are protected by the implicit guarantee that if they got into financial difficulty, the Government would bail them out. S&P explained this is why they were not downgraded, but went on to say if Australia’s country rating fell, they would be. It seems clear that as the levy is making the implicit guarantee more explicit, (such that Macquarie who is caught by the levy, got a ratings upgrade, whilst others like Bendigo and Adelaide Bank did not); the reach of this implicit guarantee is in question. To put it sharply, would the Government really let Bendigo fall over; we think not. So the whole question of who has and who does not have this protection is in the air. This all has a direct impact on funding costs, and product pricing. So how this plays out will directly impact the interest rates paid by mortgage holders and to savers. We think the need for a proper inquiry into the bank tax just got stronger. It’s worth remembering the UK’s approach to a bank tax took three goes to get right!
What seems to have been a late play for more revenue from the Government has descended into the complexity of bank funding and risk.
Finally, ten years on from the 2007 Global Financial Crisis, there were a number of good summaries of what we have learnt. One of the best was from the St. Louis Federal Reserve. They said the root causes of the crisis could be traced to excessive mortgage debt, sharply higher mortgage rates, an overheated housing market and a lack of broad oversight/insight.
Stepping forward to the current situation in Australia, it seems to me these factors are alive and well here. Household debt has never been higher, mortgage rates are set to rise further whilst incomes are squeezed, home prices are too high on any measure, and the regulators only recently started to react to the true impact of debt exposed households. This, in the week the latest personal insolvency data showed a significant rise, not just in WA, but across the nation and residential construction slowed last quarter, suggesting the number of new starts will continue to fall.
There was an excellent research piece from institutional investment fund JCP Investment Partners, picked up in the AFR. Their granular analysis of the mortgage sector (including leveraging our data), underscores the risks in the mortgage books, and explains the RBA’s recent change of tune on household finances. Critically, they showed that many households have very high loan to income ratios.
In the light of this, we think S&P called the market right, and it’s now a question of whether we will get an orderly adjustment or not. The jury is out, but the latest home price data is also suggesting a fall, despite ongoing high auction clearance rates.
At best, we remain on a knife edge. Check back next week for our latest update.
Household Finance Confidence Slips After Christmas Binge
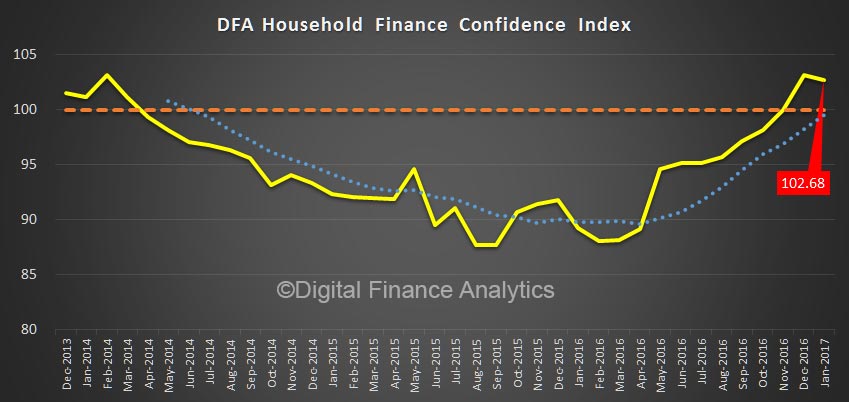
We have released the latest edition of the Digital Finance Analytics Household Finance Confidence Index, to end January 2017 today, which is a barometer of households attitudes towards their finances, derived from our rolling household surveys.
The aggregate index fell slightly from 103.2 in December to 102.68 during January, but is still sitting above a neutral measure of 100, and the trend remains positive. However there are a number of significant variations within the index as we look across states and household segments. These variations are important
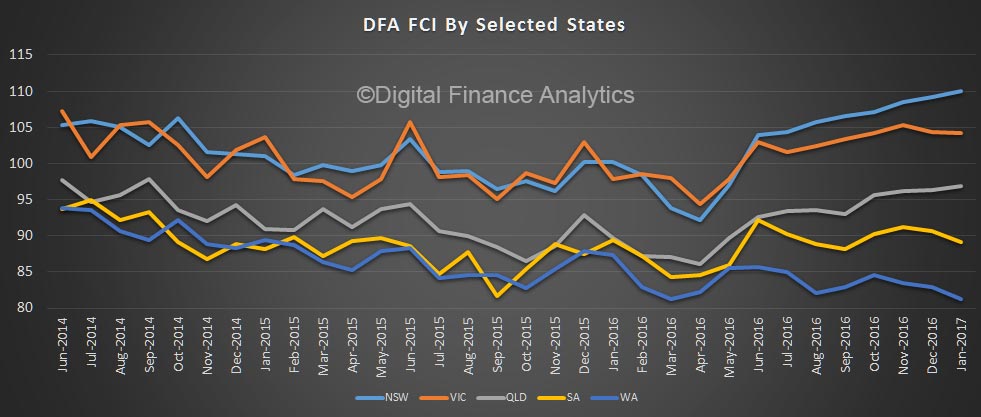
 First, the state scores are wider now than they have ever been, with households in NSW the most positive, at 110, whilst households in WA slip further to 81. Households in VIC and SA also slipped a little, whilst households in QLD were a little more positive.
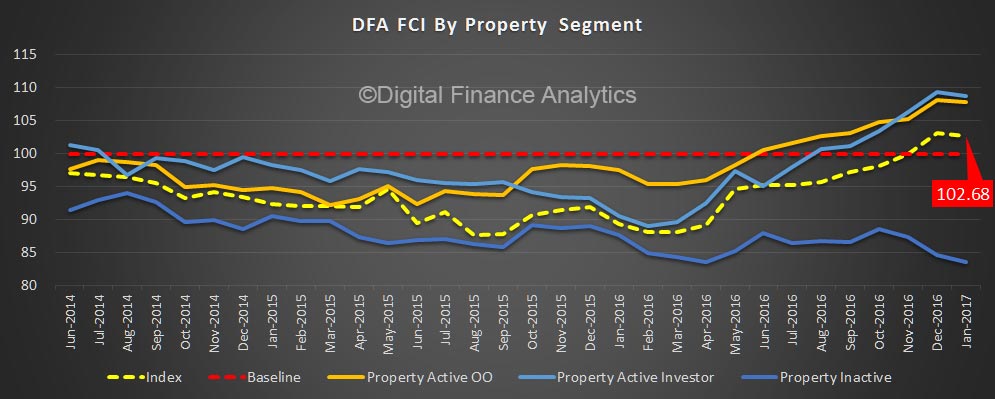
 The performance of the property market is the key determinate of the outcomes of household finance confidence, with those holding investment property slightly more positive than owner occupied property owners, whilst those who are renting, or living with family or friends are significantly less positive. Whilst some mortgage holders have received or expect to see a lift in their mortgage rate, this is offset by strong capital growth in recent months. The NSW property holders, especially in greater Sydney are by far the most positive. Renters in regional WA, where employment prospects are weaker, are the least positive.
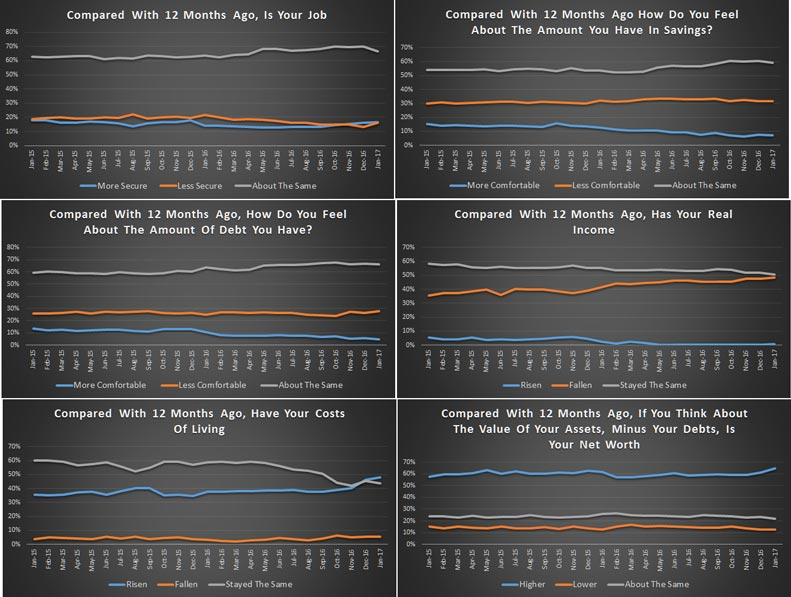
 Looking in detail at the drivers of the index, we see a rise by 1% of households who are felling less secure about their employment prospects – especially those in part-time jobs – and more are saying they are under employed.
In terms of the debt burden, there was a 4% rise in those less comfortable about the debt they hold, thanks to rising mortgages, the Christmas spending binge and higher mortgage rates.
More household are saying their real incomes have fallen, up 3%, whilst those who say their costs of living have risen was up 8%.
To offset these negative indicators however, some households reported better returns from term deposits and shares, as well as a significant boost to capital values on their property. Those who said their net worth had risen stood at 64%, up 5% from last month. The property sector is firmly linked to household confidence, and vice-versa.
 By way of background, these results are derived from our household surveys, averaged across Australia. We have 26,000 households in our sample at any one time. We include detailed questions covering various aspects of a household’s financial footprint. The index measures how households are feeling about their financial health. To calculate the index we ask questions which cover a number of different dimensions. We start by asking households how confident they are feeling about their job security, whether their real income has risen or fallen in the past year, their view on their costs of living over the same period, whether they have increased their loans and other outstanding debts including credit cards and whether they are saving more than last year. Finally we ask about their overall change in net worth over the past 12 months – by net worth we mean net assets less outstanding debts.
New DFA Video Blog – Household Mortgage Stress and Defaults
Using data from our household surveys in this new video blog we discuss the findings from our latest modelling. More than 22% of households are currently in mortgage stress, and 1.9% of households are likely to default. Both are likely to rise next year.