How millennials are affecting the price of your home

From The US Conversation.

It used to be that everyone wanted to buy a home, seeking pleasure and security, as well as the potential for future wealth.

But younger Americans are buying homes far less often than their elders’ generations did, and that puts a large sector of the U.S. economy at risk.

Millennial home ownership levels are dramatically lower than the those of previous generations at a similar age. In 1985, 45.5% of 25- to 34-year-olds owned homes in the U.S. By 2015, this had fallen about 25%.

Since the housing industry currently accounts for 15% to 18% of the nation’s gross domestic product, any change in established behavior could have substantial consequences on the larger economy.

Researchers like me who are interested in the future of the U.S. economy are faced with some difficult questions about how millennials’ behavior is changing the housing market.

My recent research suggests that both increases and decreases in home prices can be directly tied to where millennials choose to live. If a long-term behavioral change is afoot, and this generation continues not to buy homes, it will very directly impact GDP.

Homeownership

Research has shown that younger generations lag behind previous generations in terms of milestones like homeownership and marriage.

One of the assets that set previous generations apart is home equity. In 2001, Gen-Xers held an average of US$130,000 in assets, compared to millennials in 2016 that held almost 31% less.

However, assets attributed to home equity are subject to the whims of the housing market. Just ask anyone still underwater on a home purchased before the financial crisis.

And home equity isn’t just vulnerable to large-scale economic upheavals. In fact, it’s constantly fluctuating.

Age and cost

I analyzed data from the U.S. Census Bureau and American Community Survey from about 800 of the most populous counties in the U.S., or about 85% of the population, in a study that has not yet been published. The data show a rather disconcerting trend.

If no one ever moved from one county to another, almost all counties would gradually grow older in terms of average age.

However, the migration of primarily younger individuals has caused an escalation in this aging shift. Some areas are aging much more quickly than expected. In those areas, home prices have been vulnerable to long-term declines.

In other words, the trend of rising or falling home values follows patterns of migration in the U.S.

From 2010 to 2016, counties with aging populations were about 50% more likely to have experienced a decline in home values than those counties that were becoming “younger.” Not surprisingly, counties that were becoming younger were often experiencing increases in both populations and in the prices of homes.

Two areas that provide an illustration of this are key to the oil and gas industry: the Midland-Odessa area of Texas and Ward County, North Dakota. Both areas have experienced not only a net decrease in the age of residents, but also a net increase in population.

This is far from a rural phenomenon. In Allegheny County, the Pennsylvania county that’s home to Pittsburgh, a similar increase in population has also decreased the average age of its residents.

The cost of a home

Millennials’ migration to particular counties has fueled speculative real estate transactions.

In 2018, such transactions are reaching levels just below the pre-crisis highs, accounting for almost 11% of all homes sold last year. The prices are inflated by buyers looking to “flip” houses. This forces younger buyers to compete with the professionals, pushing them out of the markets they are migrating to.

Younger buyers are further frustrated by the cost of what economists refer to as frictions. Frictions include commissions that average 5% to 6% of the purchase price, myriad inspection and appraisal fees, as well as mortgage and title insurance. All of this runs counter to the transparency and ease of access many millennials have become used to in the modern world.

Since the younger generation is better educated, one might expect significant wage increases to counter some of these frictions. But recent graduates between the ages of 22 and 27 earn about 2% less than their predecessors did in 1990.

If home prices had also stayed relatively flat, this likely wouldn’t be an issue. However, from 2000 to the present, average home prices have increased by about 3.8% annually, though this varies dramatically from county to county.

As urban areas continue to attract more new residents, many young people may need to reassess the true value that home ownership offers. Meanwhile, older generations are likely just becoming aware of the impact of millennial migration on the American dream. If you live in an area that is aging faster than the natural rate, the probability of your home value decreasing is very real.

Why Are Interest Rates So Low? – Don’t Blame Central Banks

Yesterday we discussed a BIS working paper which suggested that Central Banker’s monetary policy have driven real interest rates lower, rather than demographics.

So, highlighting that modelling can prove anything, another working paper, this time from the Bank of England, comes down on the other side of the argument.  The paper “Demographic trends and the real interest rate” says two-thirds of the fall in rates is attributable to demographic changes (in which case Central Bankers are responding, not leading rates lower). In fact, pressure towards even lower rates will continue to increase.

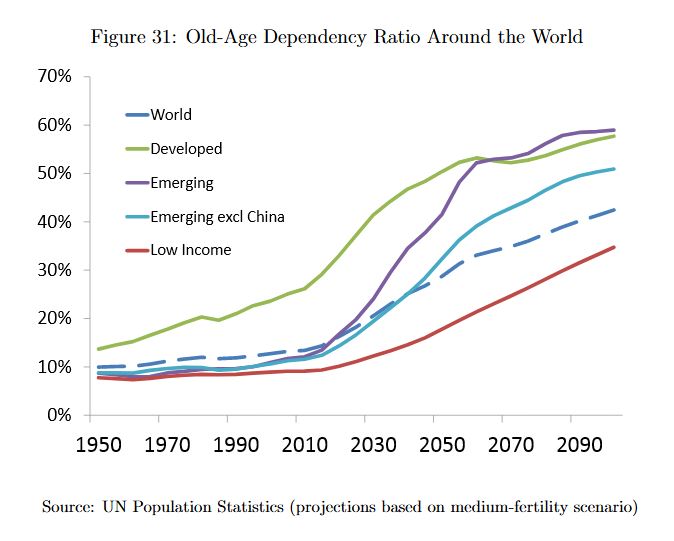
In the 2010s, advanced countries’ long-term real interest rates fell well below zero, to levels unprecedented in a period of peacetime and stable inflation. While the global financial crisis has played a part, this was the continuation of a downward trend that began at least two decades previously. At the same time, the population of advanced countries has continued to age, with life expectancy and the old-age dependency ratio reaching new highs. This paper quantifies the link between these two important trends. The advanced world is in the midst of a rapid and unprecedented ageing of its population, driven by a fall in birth rates and, more importantly, a rise in life expectancy.

When old-age pensions were first institutionalised in the early 20th century, the chance of reaching pensionable age, and residual life expectancy at that point, were relatively low. In contrast, the overwhelming majority of the population can now expect to retire for several decades. Households need to accumulate increased resources through their working lives to fund at least part of this. Furthermore, as household wealth tends to fall only slowly over retirement, more of the population will be at relatively high-wealth stages of life. This rise in the population’s effective propensity to hold wealth will in turn have profound effects on the financial system, its key relative price – the real interest rate – and the prices of other assets. To the extent that these trends are stronger or weaker in different countries, they will also give rise to international payments imbalances.

We use an overlapping generations model, calibrated to advanced country data, to assess the contribution of population ageing to the fall in real interest rates which the world has seen over the past three decades. We find that global demographic change can explain three-quarters of the 210bp fall in global real interest rates since 1980, and larger fractions of the rises in house prices and debt. Importantly, the sign of these effects will not reverse as the baby-boomer generation retires: demographic change is forecast to reduce rates by a further 37 bp by 2050.

Note: Staff Working Papers describe research in progress by the author(s) and are published to elicit comments and to further debate. Any views expressed are solely those of the author(s) and so cannot be taken to represent those of the Bank of England or to state Bank of England policy. This paper should therefore not be reported as representing the views of the Bank of England or members of the Monetary Policy Committee, Financial Policy Committee or Prudential Regulation Committee.

A Floor Under Property Price Falls

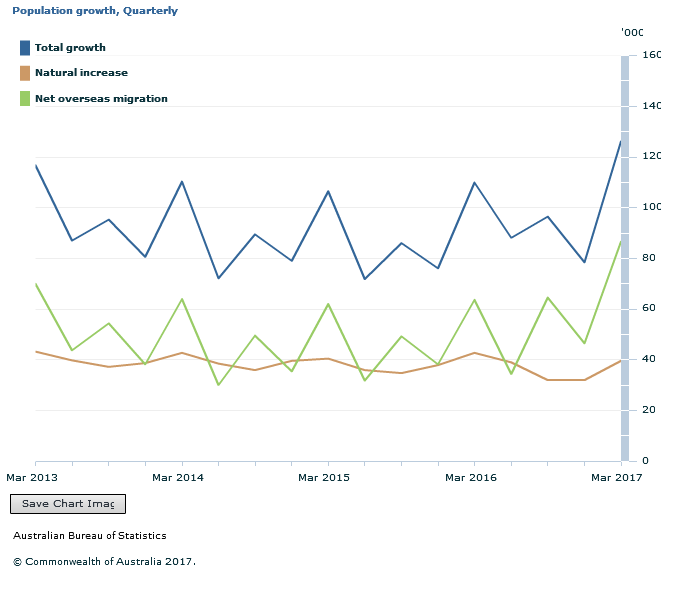
The ABS today released March 2017 demographic statistics, which shows that natural population growth is being dwarfed by net overseas migration. All these new households will need somewhere to live, so they be competing with existing residents for property, both in the rental sector, and for purchase. This is likely to put a floor under property demand and so home prices.

Bottom line, there is a strong link between home prices and population growth.  So, one lever which should be considered to take the sting out of the property cycle is to reduce net migration. Politically speaking, this appears unlikely as a “big Australia” strategy lays behind much of current public discourse.

The ABS says that the preliminary estimated resident population (ERP) of Australia at 31 March 2017 was 24,511,800 people. This is an increase of 389,100 people since 31 March 2016, and 126,100 people since 31 December 2016.

Within that, the preliminary estimate of natural increase for the year ended 31 March 2017 (142,400 people) was 5.8%, or 8,800 people lower than the natural increase recorded for the year ended 31 March 2016 (151,300 people).

The preliminary estimate of net overseas migration (NOM) for the year ended 31 March 2017 (231,900 people) was 26.9%, or 49,100 people higher than the net overseas migration recorded for the year ended 31 March 2016 (182,800 people).

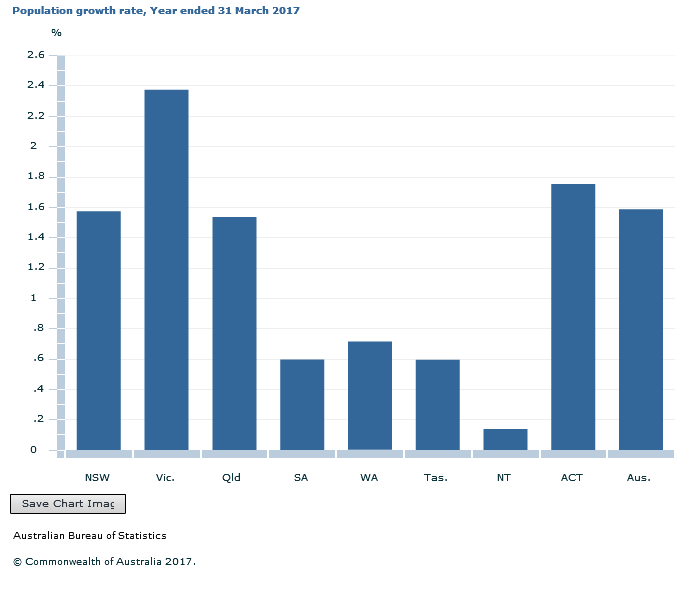
Significantly, the state with the highest growth rate was Victoria, which is currently seeing the strongest auction clearance rates, strong demand, and home price growth. This is not a surprise, given the high migration

The ABS says Australia’s population grew by 1.6% during the year ended 31 March 2017. Natural increase and NOM contributed 36.6% and 59.6% respectively to total population growth for the year ended 31 March 2017 with intercensal difference accounting for the remainder. All states and territories recorded positive population growth in the year ended 31 March 2017. Victoria recorded the highest growth rate of all states and territories at 2.4%. The Northern Territory recorded the lowest growth rate at 0.1%.


ASIC Launches a ‘Women’s Money Toolkit’

ASIC has launched a ‘Women’s Money Toolkit’, a free online resource designed to help Australian women manage their finances, make money decisions at key life stages and enhance their financial wellbeing.

The toolkit was developed in response to the particular needs of women who face financial issues and challenges as a result of factors such as their greater likelihood of variable workforce participation, longer life expectancy and on average lower superannuation balances. Research suggests there are differences in the way that women and men generally interact with finances, indicating the need for a tailored approach to financial education.

The Women’s Money Toolkit is available on ASIC’s MoneySmart website at moneysmart.gov.au.

Image of the Womens Money Toolkit

Relevant facts and figures that informed the development of ASIC’s Women’s money toolkit:

  • 46.1% of women in employment work part time hours, compared to 16.8% of men.
  • In 2013, the life expectancy of Australian women was 84.3 and the life expectancy of men was 80.1
  • At age 60-64, women have on average $104,734 in their super balance while men have $197,054).

The ANZ’s Survey of Adult Financial Literacy in Australia revealed differences in the financial attitudes and behaviours of Australian women and men including:

  • Women aged 28 to 59 had higher scores than men on keeping track of finances
  • Women of all ages were more likely than men of all ages to agree that ‘money dealing is stressful’
  • Women of all ages had lower scores than men on impulsivity.