House Prices Lift In February

CoreLogic RP Data February Home Value Index results released today showed that Australia’s combined capital cities have seen dwelling values rise by a further 0.3 per cent in February taking home values 8.3 per cent higher over the past twelve months. The monthly rate of growth slowed from 1.3 per cent in January and 0.9 per cent in December, however the growth trend remains strong, particularly in Sydney and Melbourne.

Sydney is once again the clear standout with dwelling values 13.7 per cent higher while Melbourne values are 7.4 per cent higher. Australia’s third largest city, Brisbane, recorded the third highest rate of annual capital gain with dwelling values up 5.9 per cent. In contrast, dwelling values have increased by less than four per cent in every other capital city over the year.

Since the beginning of the growth cycle in June 2012, dwelling values have moved 22.6 per cent higher across the combined capital cities.  However in Sydney values are up 34.8 per cent cumulatively over the cycle to date across Australia’s largest capital city.

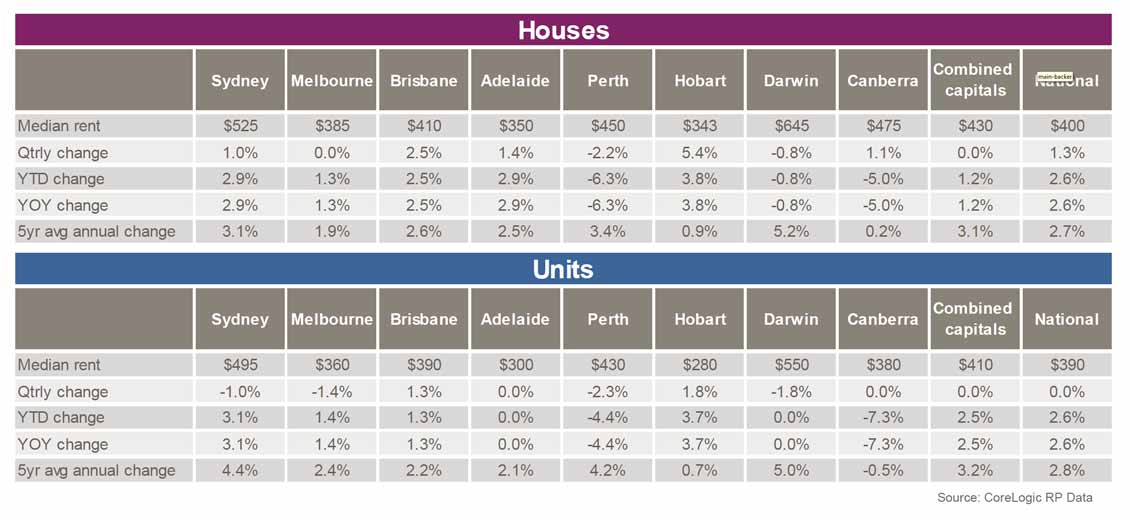
Evidence of compressed rental yields is continuing across each of the capital city markets. A year ago the gross rental yield for a capital city dwelling was averaging 4.3 per cent; by the end of February the typical gross yield has been eroded down to just 3.7 per cent – due largely to the consistent high rate of dwelling value growth relative to rental growth. In Melbourne, the yield profile is the lowest of any capital city with the typical Melbourne dwelling showing a gross yield of just 3.3 per cent. Sydney isn’t far behind with a gross dwelling yield of 3.6 per cent.

Total returns in Sydney are approaching the 20 per cent mark over the past twelve months, substantially outperforming other asset classes.  This compares with 11.1 per cent in Melbourne and 10.9 per cent in Brisbane. Given low returns from bank deposits, and full share prices it is not surprising to see continued momentum in the investment sector.

DFA believes these trends suggest the RBA should hold off on a further rate cut tomorrow, unless, and until macroprudential levers can be pulled to take some of the exuberance from the market.

Residential Land Prices Rise Again

The latest HIA-RP Data Residential Land Report provided by the Housing Industry Association, and CoreLogic RP Data, show that acute supply bottlenecks continue to affect Australia’s residential land market. Land prices reached an all-time high in both the capital city and regional markets.

Turnover in the national land market declined by some 16.7 per cent during the September 2014 quarter. At the same time, price growth accelerated to 3.3 per cent over the quarter.

During the September 2014 quarter the weighted median price of residential land rose by 3.3 per cent to $212,727 per lot. This represents an all-time high for land prices nationally. Capital city land prices saw growth of 4.7 per cent during the quarter, and were 10.0 per cent higher than twelve months earlier, however some of this was due to an increase in the size of land lots transacted. In regional Australia, land prices rose by 0.7 per cent during the quarter and were 3.5 per cent higher compared with a year earlier.

The supply and price issues flow directly into helping to drive house prices higher.

Q4 Capital City Rentals Static

CoreLogic RP Data just released their rental data to December 2014. Over the 2014 calendar year, advertised rental rates on a national basis increased by 2.6 per cent for both houses and units. At a capital city level, the rental performance across the different housing stocks was more varied. House rents rose by 1.2 per cent over the year, while unit rents outperformed the detached housing market, up 2.5 per cent over the 12 months to December 2014.

RPDataRentalsDec2014Quarterly movements. Capital city advertised rents remained unchanged over the final quarter of 2014, with house rents steady at $430 per week and unit rents recorded at $410 per week. Across Australia, house rents increased by 1.3 per cent to $400 per week, while unit rents were unchanged over the three months to December at $390 per week.

For houses, the performance across each individual capital city market was varied. Hobart houses saw rents rise by the most, up 5.4 per cent over the three month period, while Brisbane (2.5 per cent), Adelaide (1.4 per cent), Canberra (1.1 per cent) and Sydney (1.0 per cent) saw rents rise by a more moderate amount. Perth (-2.2 per cent) and Darwin (-0.8 per cent) were the weakest performing rental markets for houses over the three month period. Melbourne was the only capital city market to record no change, with weekly rents for houses stable at $385 per week. The performance across the unit market at a capital city level was somewhat weaker. Hobart (1.8 per cent) and Brisbane (1.3 per cent) were the only capital cities in which rents rose over the three months to December, while all other cities saw rents fall over the last quarter of 2014 with the exception of Adelaide and Canberra where no change was recorded.

Annual movements. Nationally, advertised rents are 2.6 per cent higher than they were in December 2013 for both houses and units, while across the combined capital cities house rents have risen by 1.2 per cent, compared to a stronger level of growth for unit rents which rose by 2.5 per cent. Over the year to December 2014, for houses, the strongest performing capital city market in terms of rental increases was Hobart, where the median advertised weekly rental rate was 3.8 per cent higher. Sydney, Adelaide (both 2.9 per cent), Brisbane (2.5 per cent) and Melbourne (1.3 per cent) all had rents higher in December 2014 when compared to December 2013. Perth (-6.3 per cent) and Canberra (-5.0 per cent) were by far the weakest performing capital city markets for growth in advertised house rents.

Similar to houses, Canberra (-7.3 per cent) and Perth (-4.4 per cent) were the weakest performers amongst the capital city unit rental markets and were the only two cities to see rents fall over 2014. Unit rents for both Adelaide and Darwin remained unchanged over the year, while Hobart (3.7 per cent) and Sydney (3.1 per cent) were the strongest performers.