Dwelling Approvals Rise 0.7 per cent in October Thanks to Victoria

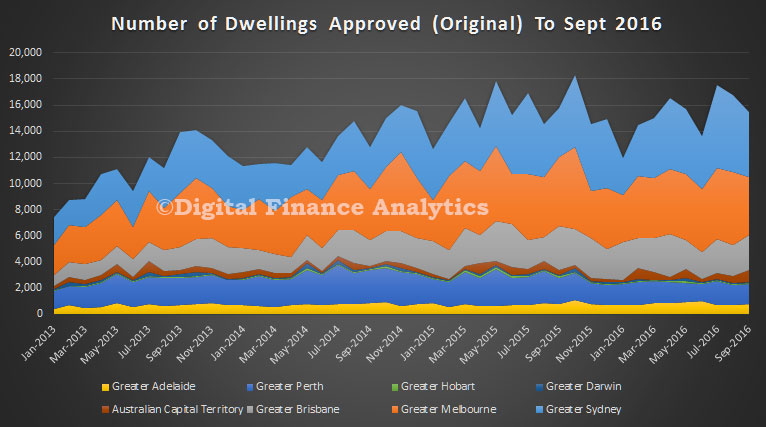
Growth in Victoria has driven total dwelling approvals higher in October (up by more than 20% in that state), whilst there was a fall in New South Wales.  We are still seeing the strongest demand for property in VIC, thanks to strong migration, though supply and demand is patchy as the recent ANU study highlighted.

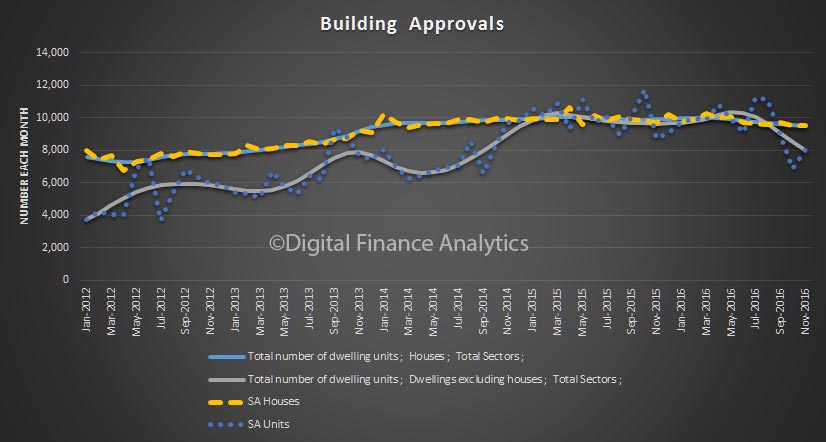
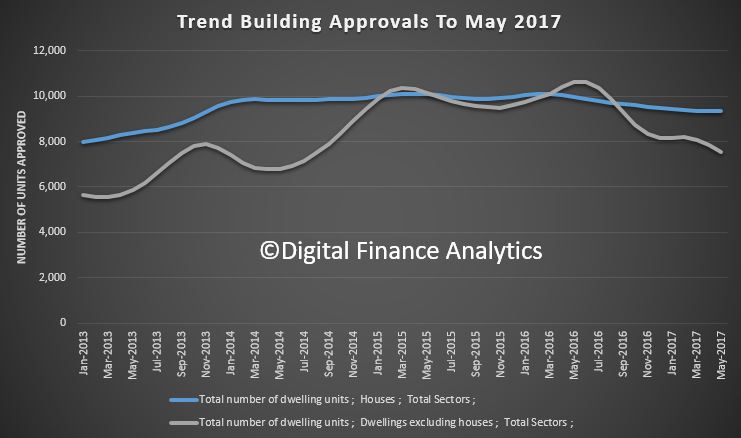
The number of dwellings approved rose 0.7 per cent in October 2017, in trend terms, and has risen for nine months, according to data released by the Australian Bureau of Statistics (ABS) today.

“Dwelling approvals have continued to strengthen in recent months, rising above 19,000 dwellings in October 2017,” said Justin Lokhorst, Director of Construction Statistics at the ABS. “This is the first time the series has reached this level since August 2016.”

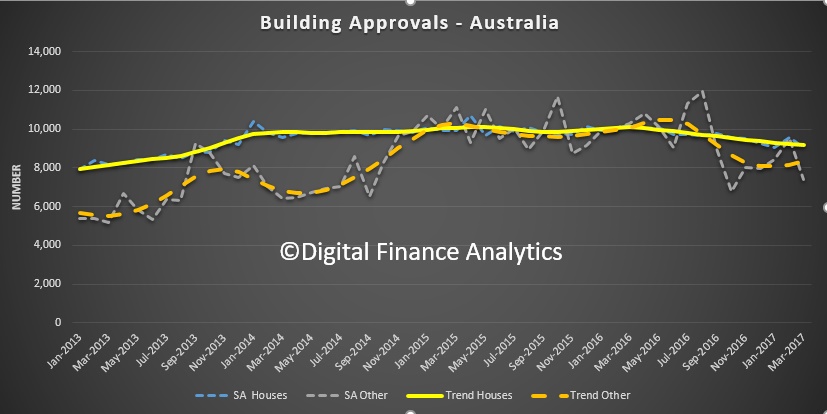
Dwelling approvals increased in October in Tasmania (4.1 per cent), Victoria (3.8 per cent), South Australia (0.6 per cent), Western Australia (0.3 per cent) and Northern Territory (0.3 per cent), but decreased in the Australian Capital Territory (5.3 per cent), Queensland (1.7 per cent) and New South Wales (0.3 per cent) in trend terms.

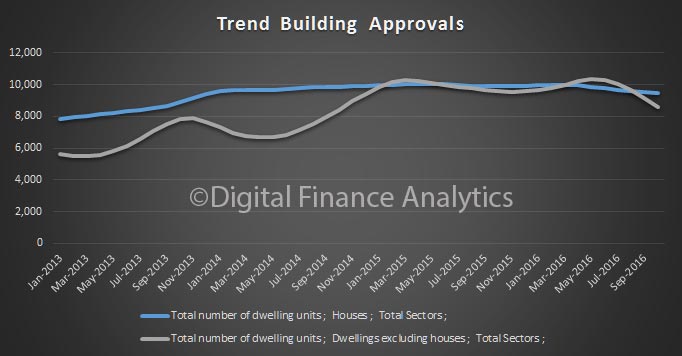
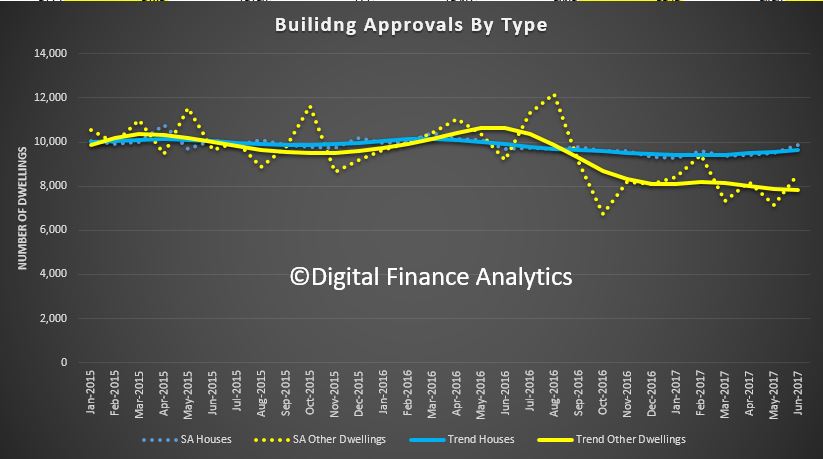
In trend terms, approvals for private sector houses rose 0.6 per cent in October. Private sector house approvals rose in Queensland (1.4 per cent), Victoria (1.2 per cent) and South Australia (1.0 per cent), but fell in Western Australia (1.0 per cent) and New South Wales (0.7 per cent).

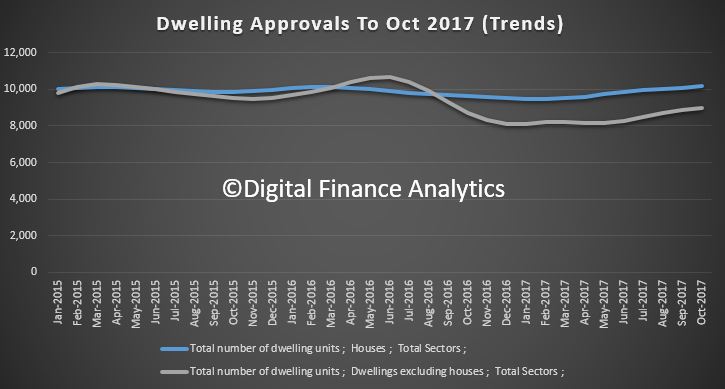
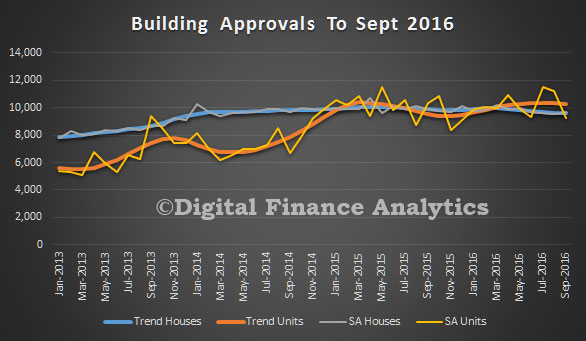
In seasonally adjusted terms, dwelling approvals increased by 0.9 per cent in October, driven by a rise in private house approvals (1.5 per cent), while private dwellings excluding houses fell 1.0 per cent.

The value of total building approved rose 0.5 per cent in October, in trend terms, and has risen for 10 months. The value of residential building rose 0.8 per cent while non-residential building was flat.

Trend dwelling approvals rise 1.1 per cent in August

The number of dwellings approved rose 1.1 per cent in August 2017, in trend terms, and has risen for seven months, according to data released by the Australian Bureau of Statistics (ABS) today.

In trend terms, approvals for private sector houses rose 0.9 per cent in August. Private sector house approvals rose in Queensland (2.0 per cent), South Australia (1.4 per cent), Victoria (1.1 per cent) and Western Australia (0.3 per cent), but fell in New South Wales (0.3 per cent).


Dwelling approvals increased in August in the Australian Capital Territory (8.9 per cent), Northern Territory (8.3 per cent), Victoria (1.5 per cent), Tasmania (1.2 per cent), Queensland (1.0 per cent), South Australia (0.9 per cent) and New South Wales (0.7 per cent), but decreased in Western Australia (0.8 per cent) in trend terms.

“Dwelling approvals have shown signs of strength in recent months, although are still below the record high in 2016,” said Bill Becker, Assistant Director of Construction Statistics at the ABS. “The August 2017 data showed that the number of dwellings approved is now 6.5 per cent lower than in the same month last year, in trend terms.”

In seasonally adjusted terms, dwelling approvals increased by 0.4 per cent in August, driven by a rise in private dwellings excluding houses (4.8 per cent), while private house approvals fell 0.6 per cent.

The value of total building approved fell 0.3 per cent in August, in trend terms, after rising for six months. The value of residential building rose 0.7 per cent while non-residential building fell 1.8 per cent.

Building Approvals Rose In July

The number of dwellings approved rose 0.7 per cent in July 2017, in trend terms, and has risen for three months, according to data released by the Australian Bureau of Statistics (ABS) today.

Dwelling approvals increased in July in the Australian Capital Territory (8.8 per cent), Victoria (1.0 per cent), Western Australia (0.8 per cent), South Australia (0.8 per cent), New South Wales (0.4 per cent) and Queensland (0.2 per cent), but decreased in the Northern Territory (9.7 per cent) and Tasmania (1.0 per cent) in trend terms.

In trend terms, approvals for private sector houses rose 1.0 per cent in July. Private sector house approvals rose in Queensland (1.5 per cent), Victoria (1.1 per cent), South Australia (0.9 per cent) and New South Wales (0.8 per cent), but fell in Western Australia (0.1 per cent).

In seasonally adjusted terms, dwelling approvals decreased by 1.7 per cent in July, driven by a fall in private dwellings excluding houses (6.7 per cent), while private house approvals were flat.

The value of total building approved rose 1.3 per cent in July, in trend terms, and has risen for six months. The value of non-residential building rose 3.1 per cent while residential building was flat.

“The value of non-residential building approvals have risen for the past six months, in trend terms, reaching a record high in July 2017,” said Daniel Rossi, Director of Construction Statistics at the ABS.

“The strength in non-residential building has been driven by approvals in New South Wales and Victoria, where a number of office and education buildings have been approved in recent months.”

Commenting on the figures, the HIA said:

“Today’s building approval figures show that the detached house building sector has plateaued at a high level while the building of multi-unit projects is sliding, was confirmed by ABS data today,” stated Tim Reardon, HIA’s Principal Economist.

The ABS released July Building Approval data today which shows that the paths of detached and multiunit residential building continue to diverge as the industry’s contribution to GDP is set to fall.

“Multi-unit sector approvals fell by 3.3 per cent to be 27.5 per cent lower than twelve months ago while detached house building approvals remained constant over the year.

“Detached home approvals were 2.4 per cent better in July this year than compared with July 2016.

“The slowdown in the multi-unit sector is also showing up in the amount of work done on all residential sites has fallen by 3.2 per cent in the first half of this year, based on the construction data also released by ABS today.

“This slowdown in on-site activity is likely to see residential building have a negative impact on GDP growth for the June quarter.

“There is also significant variation in residential building conditions around the country.

“Compared with a year ago multi-unit approvals in July were down by 20 per cent or more in all the eastern states while movements in detached home approvals included a 9.6 per cent increase in South Australia to a fall of 8.7 per cent in Western Australia.

“The significant variation in industry conditions between the multi-unit sector and detached homes and around the states is likely to continue for some time consistent with HIA’s latest forecasts”, Mr Reardon concluded.

Building Approvals Just A Little Stronger

The number of dwellings approved rose 0.1 per cent in June 2017, in trend terms, after falling for three months, according to data released by the Australian Bureau of Statistics (ABS) today.

Dwelling approvals increased in June in the Australian Capital Territory (5.9 per cent), South Australia (3.2 per cent), Western Australia (1.7 per cent), Queensland (1.1 per cent) and Tasmania (0.7 per cent), but decreased in the Northern Territory (2.7 per cent) and Victoria (1.9 per cent) in trend terms. Dwelling approvals were flat in New South Wales.

In trend terms, approvals for private sector houses rose 0.8 per cent in June. Private sector house approvals rose in Queensland (1.8 per cent), New South Wales (1.1 per cent) and Victoria (0.5 per cent), but fell in Western Australia (0.6 per cent) and South Australia (0.1 per cent).

In seasonally adjusted terms, dwelling approvals increased by 10.9 per cent in June, driven by a rise in total dwellings excluding houses (20.1 per cent), while total house approvals rose 4.0 per cent.

The value of total building approved rose 1.3 per cent in June, in trend terms, and has risen for five months. The value of non-residential building rose 3.4 per cent while residential building fell 0.1 per cent.

“Dwelling approvals have been relatively stable in trend terms over the first six months of the year, after falling from record highs in mid-2016,” said Daniel Rossi, Director of Construction Statistics at the ABS. “The June 2017 data showed that the number of dwellings approved is now 15 per cent below the peak in May 2016”.

Trend dwelling approvals fall 1.9 per cent in May

The number of dwellings approved fell 1.9 per cent in May 2017, in trend terms, and has fallen for three months, according to data released by the Australian Bureau of Statistics (ABS) today.

The peak in multi-unit construction is well and duly done, down 27% on a year ago. We are looking at approvals, and of course there is significant building underway at the moment, but this may ease later.

“Dwelling approvals continue to weaken in trend terms, falling by around 700 dwellings over the past three months,” said Daniel Rossi, Director of Construction Statistics at the ABS. “The May 2017 data showed that the number of dwellings approved is now 18 per cent below the peak in May 2016”.

Dwelling approvals decreased in May in the Australian Capital Territory (8.2 per cent), Victoria (3.9 per cent), Western Australia (3.7 per cent) and New South Wales (2.6 per cent), but increased in Queensland (2.2 per cent), Northern Territory (2.1 per cent), South Australia (1.6 per cent) and Tasmania (1.5 per cent) in trend terms.

In trend terms, approvals for private sector houses were flat in May. Private sector house approvals rose in South Australia (1.0 per cent), New South Wales (0.4 per cent) and Victoria (0.2 per cent), but fell in Queensland (0.9 per cent) and Western Australia (0.6 per cent).

In seasonally adjusted terms, dwelling approvals decreased by 5.6 per cent in May, driven by a fall in total dwellings excluding houses (12.6 per cent), while total house approvals rose 0.4 per cent.

The value of total building approved rose 0.8 per cent in May, in trend terms, and has risen for five months. The value of non-residential building rose 4.6 per cent while residential building fell 1.5 per cent.

Trend Dwelling Approvals Rise 0.8% in March, But…

The number of dwellings approved in Australia rose 0.8 per cent in March 2017, in trend terms, after falling for nine months, according to data released by the Australian Bureau of Statistics (ABS) today. However the more volatile seasonally adjusted series took another fall.

Dwelling approvals increased in March in New South Wales (3.0 per cent), Tasmania (1.6 per cent), Queensland (0.5 per cent) and Victoria (0.3 per cent), but decreased in the Northern Territory (19.1 per cent), Australian Capital Territory (7.1 per cent), Western Australia (1.9 per cent) and South Australia (0.1 per cent) in trend terms.

In trend terms, approvals for private sector houses fell 0.6 per cent in March. Private sector house approvals fell in Queensland (2.0 per cent), South Australia (0.4 per cent) and Victoria (0.3 per cent), but rose in New South Wales (0.3 per cent) and Western Australia (0.1 per cent).

In seasonally adjusted terms, dwelling approvals decreased by 13.4 per cent in March, driven by a fall in total dwellings excluding houses (22.0 per cent) and total house approvals (5.0 per cent).

The value of total buildings approved rose 0.1 per cent in March, in trend terms, after falling for seven months. The value of residential building approved rose 1.0 per cent while non-residential building approved fell 1.9 per cent.

Building Approvals Higher In February

The ABS data released today shows that the trend estimate for total dwellings approved rose 0.8% in February after falling for eight months. The trend estimate for private sector houses approved fell 0.6% in February and has fallen for 12 months.  The trend estimate for private sector dwellings excluding houses rose 2.4% in February and has risen for two months.

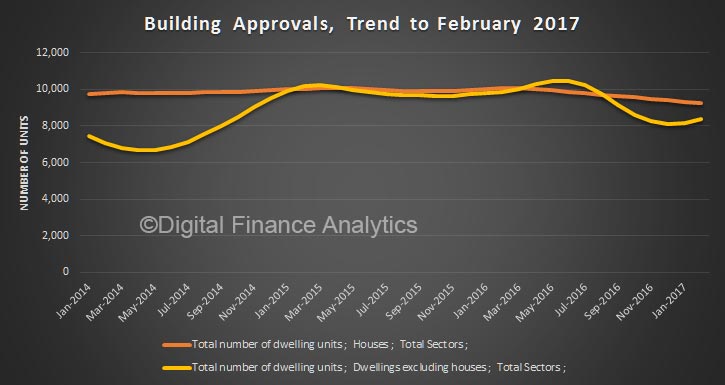
The trend estimate of the value of total building approved fell 0.1% in February and has fallen for seven months. The value of residential building rose 1.5% and has risen for two months. The value of non-residential building fell 3.3% and has fallen for six months.

The seasonally adjusted estimate for total dwellings approved rose 8.3% in February and has risen for two months. The seasonally adjusted estimate for private sector houses rose 5.3% in February after falling for two months. The seasonally adjusted estimate for private sector dwellings excluding houses rose 10.9% in February and has risen for two months.

The seasonally adjusted estimate of the value of total building approved rose 19.9% in February following a fall of 3.0% in the previous month. The value of residential building rose 13.9% and has risen for four months. The value of non-residential building rose 34.5% following a fall of 16.9% in the previous month.

The HIA pointed out that during the month of February 2017, total seasonally-adjusted new home building approvals only increased in two states: Queensland (+33.7 per cent) and New South Wales (+19.6 per cent). The largest reduction occurred in Tasmania (-14.7 per cent), followed by Victoria (-8.8 per cent). Approvals also fell back in South Australia (-2.5 per cent) and Western Australia (-5.5 per cent).

In trend terms, approvals contracted by 13.0 per cent in the Northern Territory with a decline of 15.7 per cent occurring in the Australian Capital Territory.

Building Approvals In November

The number of dwellings approved fell 2.9 per cent in November 2016, in trend terms, and has fallen for six months, according to data released by the Australian Bureau of Statistics (ABS) today. This is our preferred measure as it irons out some of the monthly data bumps.


In November dwelling approvals decreased, in trend terms, in the Northern Territory (5.0 per cent), New South Wales (4.3 per cent), Queensland (3.9 per cent), the Australian Capital Territory (3.4 per cent), Victoria (2.5 per cent) and South Australia (1.1 per cent). Dwelling approvals increased, in trend terms, in Western Australia (1.9 per cent) and were flat in Tasmania.

In trend terms, approvals for private sector houses fell 0.4 per cent in November. Private sector house approvals fell in New South Wales (1.0 per cent), Victoria (0.6 per cent) and South Australia (0.4 per cent), but rose in Queensland (0.3 per cent) and Western Australia (0.3 per cent).

In seasonally adjusted terms, dwelling approvals increased by 7.0 per cent in November, driven by a rise in total dwellings excluding houses (17.3 per cent). Total house approvals fell 0.4 per cent.

The value of total building approved fell 2.6 per cent in November, in trend terms, and has fallen for four months. The value of residential building fell 2.8 per cent while non-residential building fell 2.3 per cent.

However, the Housing Industry Association focused on the seasonally adjusted series saying that the volume of approvals for new dwellings bounced back strongly during the month of November, particularly on the multi-unit side.

“November was a particularly good month on the multi-unit side of the market with approvals increasing by 17.3 per cent during the month following a big fall in October. However, we anticipate that new dwelling starts will decline over the next 12 months, with this likely to be felt on the ground towards the end of this year”.


Dwelling Approvals Fell In October

The ABS released their building approvals data for October today. The number of dwellings approved fell 3.3 per cent in October 2016, in trend terms, and has fallen for five months.

building-approvals-oct16

In trend terms, dwelling approvals decreased in October in South Australia (4.6 per cent), New South Wales (3.8 per cent), Queensland (3.6 per cent), Victoria (3.3 per cent), Western Australia (3.0 per cent), Tasmania (2.6 per cent) and Northern Territory (0.2 per cent), but increased in the Australian Capital Territory (4.5 per cent).

Approvals for private sector houses fell 0.6 per cent in October, in trend terms. Private sector house approvals fell in South Australia (2.5 per cent), Western Australia (2.3 per cent), New South Wales (0.5 per cent) and Victoria (0.1 per cent), but rose in Queensland (0.4 per cent).

In seasonally adjusted terms, dwelling approvals decreased 12.6 per cent in October, driven by a fall in total other residential dwellings (23.5 per cent). Total house approvals fell 2.5 per cent.

The value of total building approved fell 1.7 per cent in October, in trend terms, and has fallen for three months. The value of residential building fell 3.2 per cent while non-residential building rose 0.8 per cent.

Building Approvals Fall Again

The momentum of building approvals continued to ease in September especially in Sydney and Melbourne, indicating the massive construction bulge in residential building – especially apartments –  may be shrinking.

The latest data from the ABS show that building approvals to end September 2016 fell again. The trend estimate for total dwellings approved fell 0.6% in September and has fallen for four months. The seasonally adjusted estimate for total dwellings approved fell 8.7% in September and has fallen for two months.

Moreover, in seasonally adjusted terms, whilst private house approvals rose by 2.3% to 9,605, dwellings excluding houses, i.e. apartments, crashed by 16.3% to 9,166. Unit counts have been very volatile. In trend terms we are still building more units than houses nationally.

building-approvals-sept-2016Looking at the approvals (in original terms) across the main urban centres, in Greater Sydney approvals fell 16%, in Great Melbourne they were down 21%, in Great Brisbane they rose 12%, in Adelaide they were up 9%, whilst they fell in Perth.

building-approvals-sept-2016-stateThe trend estimate of the value of total building approved rose 2.1% in September and has risen for 10 months. The value of residential building fell 0.1% and has fallen for two months. The value of non-residential building rose 6.0% and has risen for eight months.

The seasonally adjusted estimate of the value of total building approved rose 29.9% in September following a fall of 7.7% in the previous month. The value of residential building fell 4.4% after rising for two months. The value of non-residential building rose 118.9% after falling for two months.