We look at the May 2019 stats from the ABS, and examine how they have been interpreted.
 Blog")
/
RSS Feed
Digital Finance Analytics (DFA) Blog
"Intelligent Insight"

We look at the May 2019 stats from the ABS, and examine how they have been interpreted.
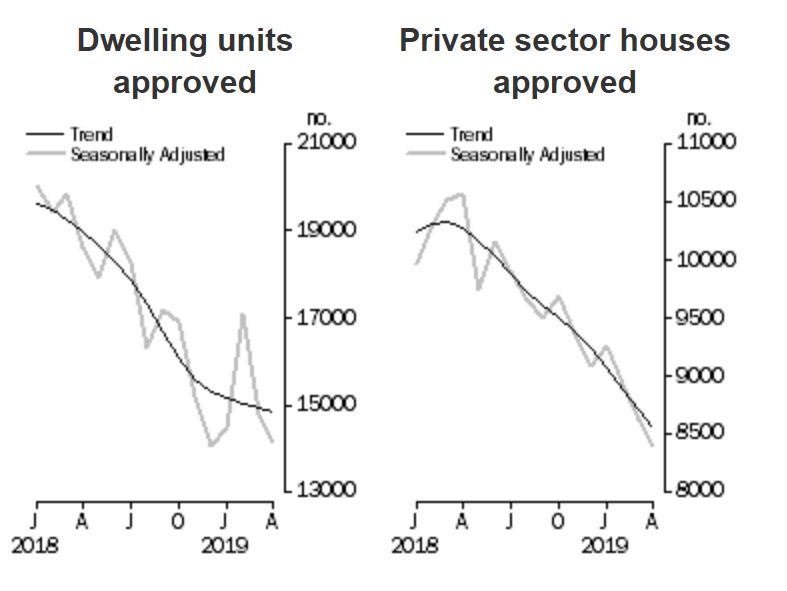
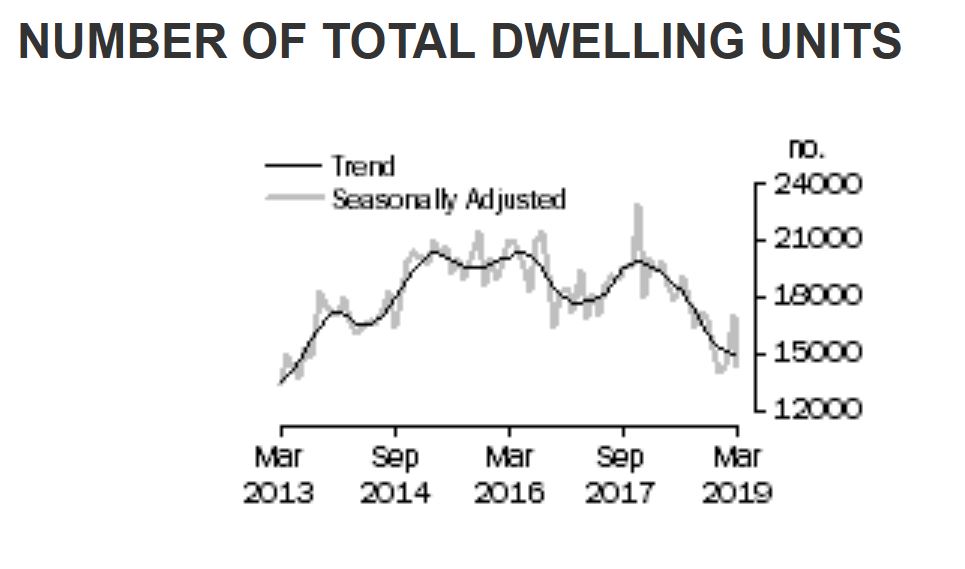
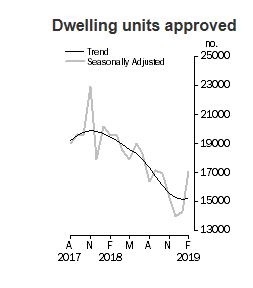
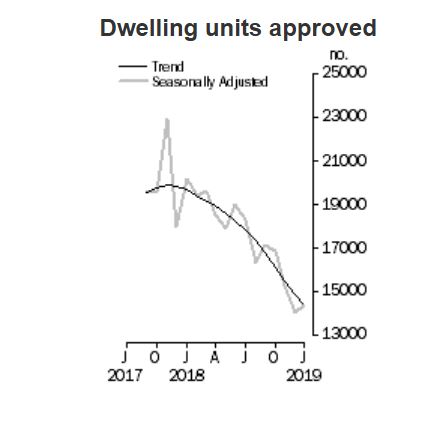
The ABS released their May 2019 Building Approvals data today. The trend estimate for total dwellings approved fell 0.5% in May, while the less reliable seasonally adjusted estimate for total dwellings approved rose 0.7% in May.
As you know DFA uses the trend series in our analysis and modelling.
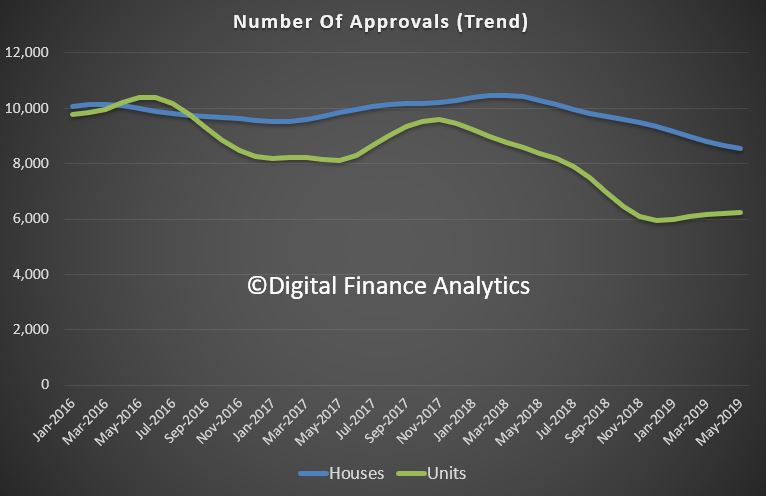
However, most reports will pick the seasonally adjusted series and claim a “rebound” in approvals.
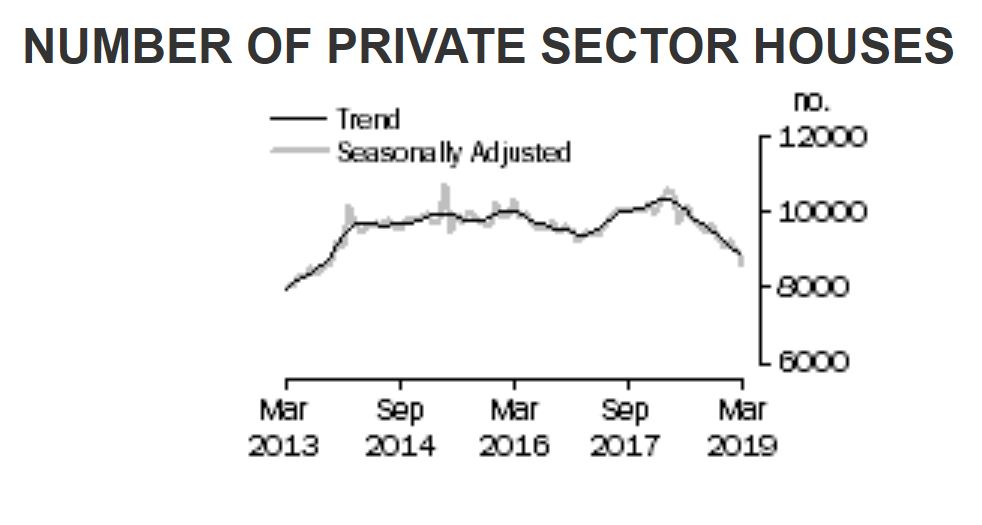
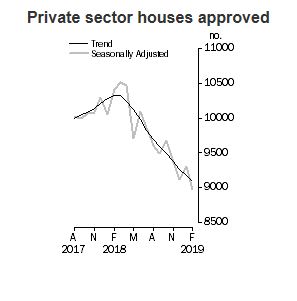
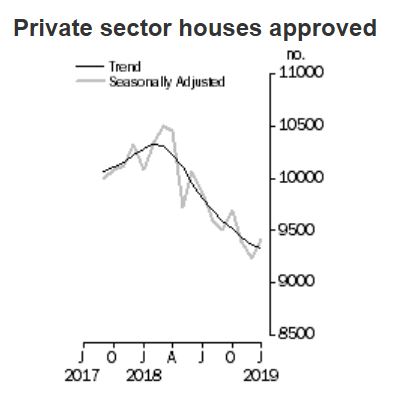
In fact, on both trend and seasonally adjusted measures, private sector house approvals fell, by 1.3% in trend terms and 0.3% in seasonally adjusted terms.
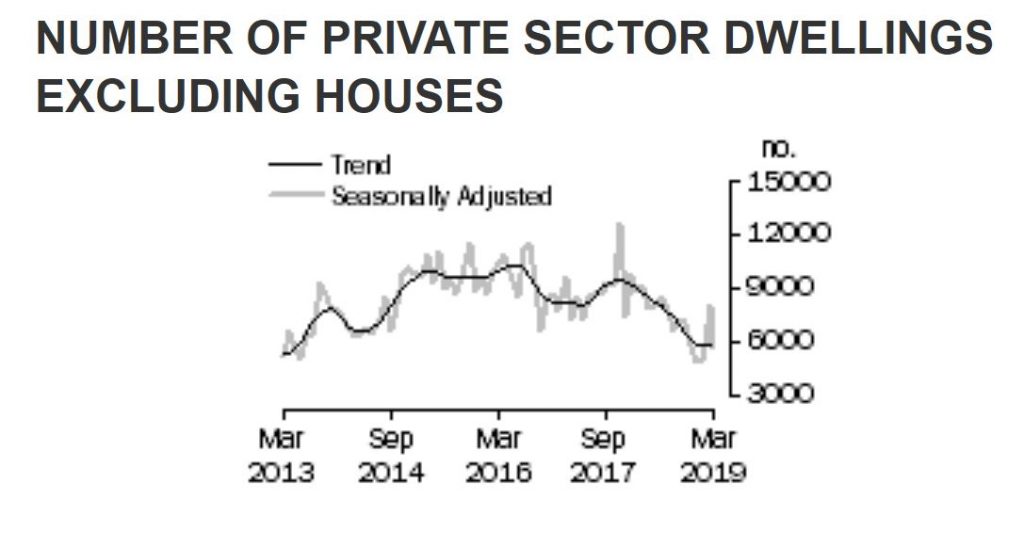
On the other hand, private sector dwellings excluding houses rose 0.6% in trend terms. while the seasonally adjusted estimate rose 1.2%.
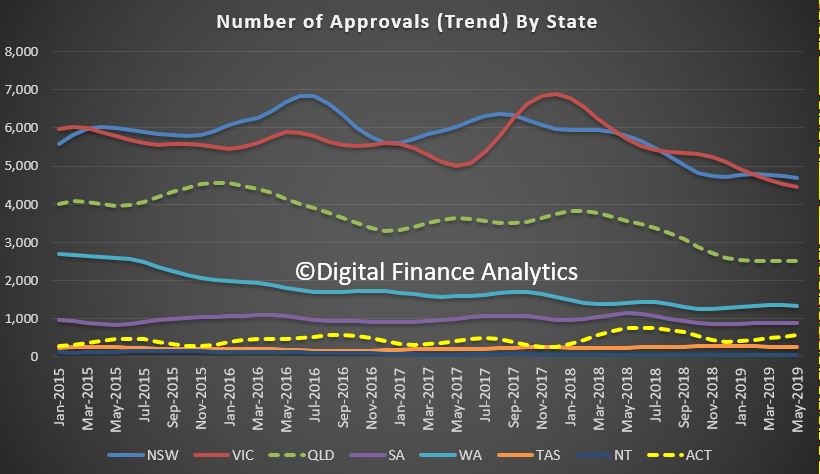
Across the states, total approvals rose a little in Queensland and South Australia, together with a big hike in Canberra (on small volumes), while there was a percentage fall in New South Wales and Victoria, as well as Western Australia and the Northern Territories.
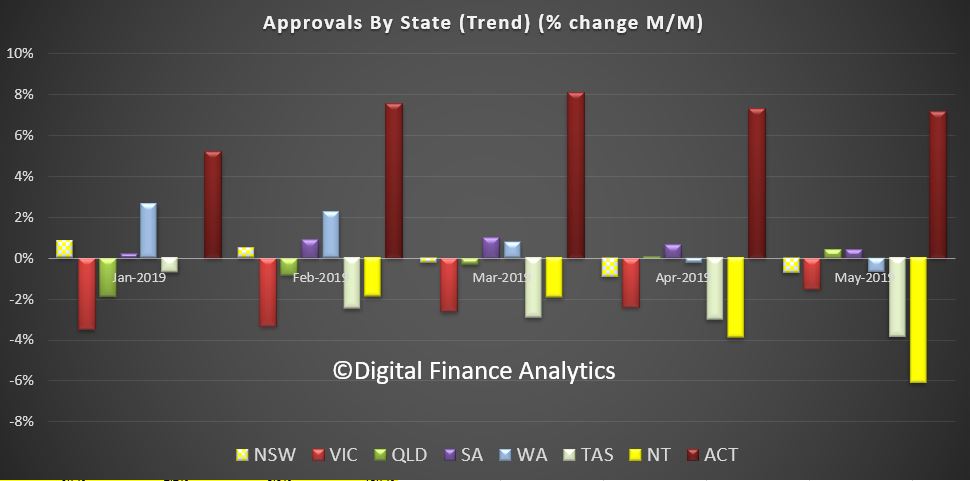
The volume trends really highlight the declines in New South Wales and Victoria, which are not offsetting the small rises elsewhere, especially in the ACT.
In New South Wales the trend estimate for total number of dwelling units approved fell 0.7% in May, while the number of private sector houses fell 2.9%.
In Victoria the trend estimate for total number of dwelling units approved fell 1.5% in May, while the number of private sector houses fell 1.3%.
In Queensland, the trend estimate for total number of dwelling units approved rose 0.4% in May, while the number of private sector houses fell 0.1% in May.
And in South Australia, the trend estimate for total number of dwelling units approved rose 0.4% in May, while the number of private sector houses was flat in May.
Finally, In Western Australia, the trend estimate for total number of dwelling units approved fell 0.7% in May and the number of private sector houses fell 0.7% in May.
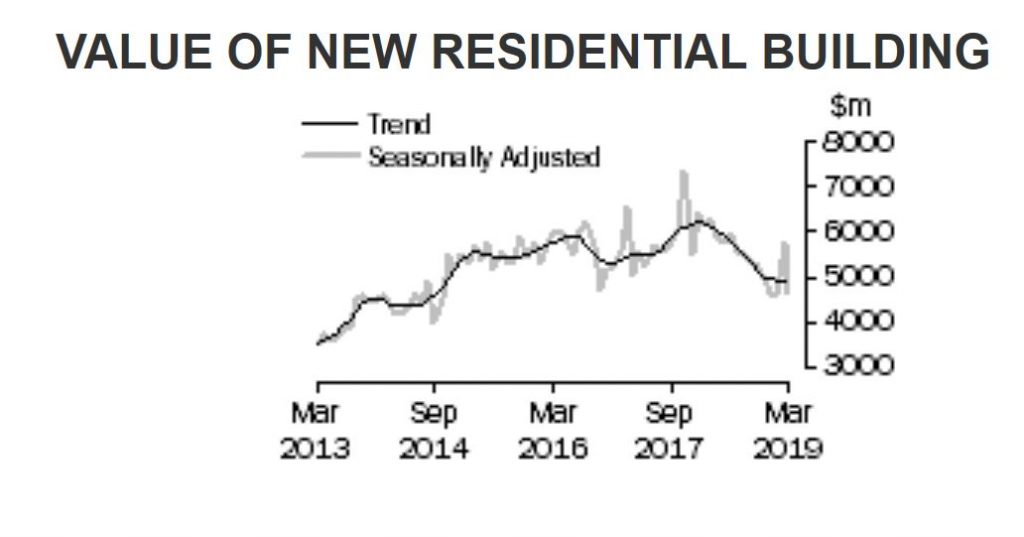
The trend estimate of the value of total building approved fell 0.2% in May and has fallen for three months. The value of residential building fell 0.6% and has fallen for 16 months. The value of non-residential building rose 0.3% and has risen for nine months.
The seasonally adjusted estimate of the value of total building approved fell 0.2% in May. The value of residential building rose 4.7%, while the value of non-residential building fell 6.7%.
The HIA said “The decline in dwelling approvals appears to be losing momentum. This is a welcome reprieve for the housing industry after the persistent declines measured throughout 2018”.
“Recent positive news relating to house prices and new home sales has started filtering through. Even if this isn’t the bottom of the cycle the pick-up in new home sales in May suggests the pace of decline is slowing”.
Westpac said ” Overall the May update was a touch firmer than expected but the detail was not great with clear questions around the sustainability of the gain in high rise approvals and weakness elsewhere”.
That is closer to the mark. Little here, yet to argue for a shift in gears.
As Westpac put it ” All of this still predates several positive developments for housing, in particular: the Federal election result, which has removed the threat of tax policy changes around negative gearing and capital gains tax; and the RBA’s interest rate cuts in June and July. More timely market measures suggest wider housing market conditions have improved, especially in Sydney and Melbourne. We suspect that shift will be slow to flow through to new dwelling construction with an overhang of stock in some segments and financing issues likely to continue restraining activity near term.
Certainly the major markets of Sydney, Melbourne and Brisbane all have a way to go before we can claim a rebound, and of course there is a significant oversupply of new high-rise under construction in these centres, despite the worries about construction standards, and the disappearing indemnity insurance in the sector.
To be a registered surveyor with the Victorian Building Authority (VBA) a person must have professional indemnity insurance, without any exemptions.
The same rule applies in NSW and Queensland.
But insurance companies are no longer providing this option and the industry is warning work on buildings may simply stop.
Other surveyors have reported that the cost of their insurance premiums and excesses have more than quadrupled.
Building surveyors are responsible for signing off on buildings, including building permits and occupancy permits.
While local government building surveyors can also sign off on permits, private building surveyors have been the preferred option for most of the building industry.
The chief executive of the Australian Institute of Building Surveyors, Brett Mace, warned the building industry could start to slow down over the next year.
“We think it’s a huge crisis,” Mr Mace said.
“If building surveyors are unable to be registered then you’re not going to be able to provide approvals and the construction industry will come to a stop.”
The Master Builders Association (MBA) said up to 30 per cent of building surveyors are required to renew their insurance by the end of June.
“If they are unable to obtain insurance or the insurance offered to them is non-compliant due to exclusions being imposed, many building projects could come to a standstill,” the MBA said in a statement.
One more reason to be cautious about a lift in approvals ahead.
The number of dwellings approved in Australia fell by 0.6 per cent in April, in trend terms, according to data released by the Australian Bureau of Statistics (ABS) today.
“The overall decrease was led by private sector houses, which declined 1.9 per cent in trend terms,” said Justin Lokhorst, Director of Construction Statistics at the ABS. “Meanwhile, private dwellings excluding houses rose by 1.2 per cent.”
Among the states and territories, total dwelling approvals fell in Victoria (2.8 per cent), Tasmania (2.2 per cent), the Northern Territory (2.0 per cent) and New South Wales (0.4 per cent), in trend terms. Increases were recorded in the Australian Capital Territory (7.7 per cent), South Australia (1.8 per cent) and Western Australia (1.3 per cent), while Queensland was flat.
Approvals for private sector houses fell 1.9 per cent in trend terms, largely driven by falls in the eastern states. Declines were recorded in New South Wales (3.8 per cent), Victoria (2.7 per cent), Queensland (0.8 per cent) and South Australia (0.1 per cent), while Western Australia recorded a 0.5 per cent increase.
In seasonally adjusted terms, total dwellings declined by 4.7 per cent in April, driven by falls in Tasmania (19.1 per cent,), Victoria (16.1 per cent), Western Australia (6.7 per cent) and South Australia (3.3 per cent). Private dwellings excluding houses fell 6.5 per cent, while private house approvals decreased 2.6 per cent.
The value of total building approved fell 0.2 per cent in April, in trend terms. The value of residential building declined 0.9 per cent, while non-residential building rose 1.0 per cent.
As Westpac put it ” Overall the update again points to weakening momentum, the composition pointing to a weaker construction profile through the middle of the year. The main caveat is around the timing of public holidays which may mean April figures are overstating weakness”.
The number of dwellings approved in Australia fell by 0.6 per cent in March 2019, in trend terms, according to data released by the Australian Bureau of Statistics (ABS) today. This won’t help the GDP or construction employment.
“The overall decrease was driven by private sector houses, which declined 1.4 per cent in trend terms,” said Justin Lokhorst, Director of Construction Statistics at the ABS. “
However, private dwellings excluding houses rose by 0.8 per cent”.
Among the states and territories, total dwelling approvals fell in Victoria (3.5 per cent) and Queensland (1.4 per cent) in trend terms. Increases were recorded in the Australian Capital Territory (4.8 per cent), the Northern Territory (3.9 per cent), Western Australia (3.8 per cent), New South Wales (0.8 per cent) and South Australia (0.4 per cent). Tasmania was flat.
Approvals for private sector houses fell 1.4 per cent nationally in trend terms. Declines were recorded in the three largest states: New South Wales (3.4 per cent), Victoria (1.8 per cent) and Queensland (0.9 per cent), while increases were recorded in Western Australia (1.0 per cent) and South Australia (0.9 per cent).
In seasonally adjusted terms, total dwellings declined by 15.5 per cent in March, largely driven by falls in New South Wales (27.4 per cent) and Victoria (27.0 per cent). The decline was led by private dwellings excluding houses which fell 30.6 per cent, while private house approvals decreased 3.2 per cent.
The value of total building approved was flat in March, in trend terms. The value of residential building rose 0.4 per cent, while non-residential building fell 0.6 per cent.
A rise in building approvals for apartments and townhouses has driven a 0.4 per cent increase in the total number of dwellings approved in Australia in February 2019, in trend terms, according to data released by the Australian Bureau of Statistics (ABS) today.
“Building approvals for private dwellings excluding houses rose 2.6 per cent in February.” said Justin Lokhorst, Director of Construction Statistics at the ABS. “Meanwhile, private houses fell a further 0.8 per cent”.
Among the states and territories, total dwelling approvals rose in February in New South Wales (3.1 per cent) and Western Australia (2.0 per cent), in trend terms. Falls were recorded in the Northern Territory (6.5 per cent), the Australian Capital Territory (6.3 per cent), Queensland (2.0 per cent), South Australia (1.1 per cent) and Victoria (0.8 per cent). Tasmania was flat.
Declines in approvals for private houses were recorded in New South Wales (2.0 per cent), Victoria (1.1 per cent) and Queensland (0.8 per cent), while increases were recorded in South Australia (2.0 per cent) and Western Australia (0.5 per cent).
In seasonally adjusted terms, total dwellings rose by 19.1 per cent in February, largely driven by rises in Victoria (37.3 per cent) and New South Wales (25.2 per cent). Private dwellings excluding houses rose 64.6 per cent, while private houses decreased by 3.6 per cent.
The value of total building approved rose 1.3 per cent in February, in trend terms. The value of non-residential building rose 1.9 per cent, while residential building increased 0.8 per cent.
The number of dwellings approved in Australia fell by 3.2 per cent in January 2019, in trend terms, according to data released by the Australian Bureau of Statistics (ABS) today.
“The trend for the total dwelling approvals series has steadily declined over the past year,” said Justin Lokhorst, Director of Construction Statistics at the ABS. “The series is now at its lowest level since May 2013.”
The decrease in January was driven by private sector dwellings excluding houses (e.g. townhouses and apartments), which fell 8.1 per cent in trend terms.
Private sector houses also declined, by 0.4 per cent.
Among the states and territories, total dwelling approvals fell in January in the Australian Capital Territory (19.8 per cent), the Northern Territory (8.0 per cent), Victoria (4.5 per cent), Queensland (3.9 per cent), New South Wales (2.3 per cent) and South Australia (0.8 per cent) in trend terms. Western Australia (2.2 per cent) and Tasmania (1.4 per cent) recorded increases.
Approvals for private sector houses fell 0.4 per cent in January in trend terms. Queensland (1.4 per cent), New South Wales (0.6 per cent) and Victoria (0.3 per cent) declined, while increases were recorded in South Australia (2.3 per cent) and Western Australia (0.2 per cent).
In seasonally adjusted terms, total dwellings rose by 2.5 per cent in January, driven by rises in Western Australia (28.8 per cent), Tasmania (15.4 per cent) and New South Wales (12.0 per cent). Private dwellings excluding houses rose 2.7 per cent, while private houses also increased (by 2.1 per cent).
But as Westpac put it ” As a rule, January housing data should be taken with a large grain of salt – the low flows through the holiday period mean any month to month noise is amplified by seasonal adjustment”.
The value of total building approved fell 1.5 per cent in January, in trend terms, and has fallen for 14 months. The value of residential building fell 2.7 per cent, while non-residential building rose 0.4 per cent.
The number of dwellings approved in Australia fell by 4.1 per cent in December 2018, in trend terms, according to data released by the Australian Bureau of Statistics (ABS) today.

“The trend for the total dwelling approvals series has continued to decline over the past year,” said Daniel Rossi, Director of Construction Statistics at the ABS. “The series is now at its lowest level since June 2013.”
The decrease in December was driven by private sector dwellings excluding houses (e.g. townhouses and apartments), which fell 8.5 per cent. Private sector houses also declined, by 1.1 per cent.
Among the states and territories, dwelling approvals fell in December in the Australian Capital Territory (21.3 per cent), Queensland (6.5 per cent), New South Wales (5.0 per cent), Western Australia (3.8 per cent), South Australia (1.5 per cent) and Victoria (1.4 per cent) in trend terms. The Northern Territory (1.7 per cent) and Tasmania (1.1 per cent) recorded increases.
Approvals for private sector houses fell 1.1 per cent in December in trend terms. Queensland (3.6 per cent), New South Wales (1.6 per cent) and Western Australia (0.6 per cent) declined, while increases were recorded in South Australia (0.6 per cent) and Victoria (0.2 per cent).
In seasonally adjusted terms, total dwellings fell by 8.4 per cent in December, driven by a 18.8 per cent decrease in private dwellings excluding houses. Private houses also fell 2.2 per cent.
The value of total building approved fell 1.5 per cent in December, in trend terms, and has fallen for the past 13 months. The value of residential building fell 2.6 per cent, while non-residential building rose 0.2 per cent.
The number of dwellings approved in Australia fell by 2.3 per cent in November 2018, in trend terms, according to data released by the Australian Bureau of Statistics (ABS) today.
“The trend for total dwellings has been steadily declining over the past twelve months,” said Justin Lokhorst, Director of Construction Statistics at the ABS. “The series is now 18.3 per cent lower than at the same time last year.”
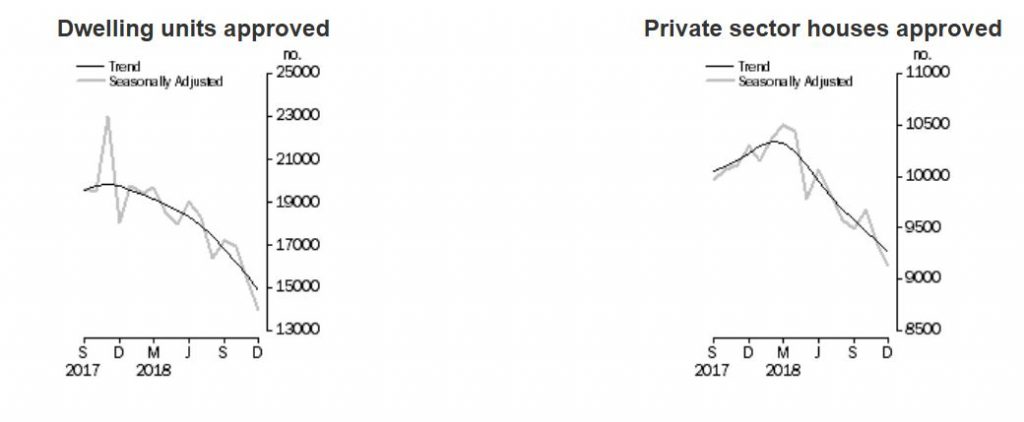
NUMBER OF TOTAL DWELLING UNITS
The trend estimate for total dwellings approved fell 2.3% in November.
NUMBER OF PRIVATE SECTOR HOUSES
The trend estimate for private sector houses approved fell 0.3% in November.
NUMBER OF PRIVATE SECTOR DWELLINGS EXCLUDING HOUSES
The decrease in November was driven by private sector dwellings excluding houses (e.g. townhouses and apartments), which fell 5.0 per cent. Private sector houses also declined, by 0.3 per cent.
Among the states and territories, dwelling approvals fell in November in the Australian Capital Territory (9.5 per cent), South Australia (6.2 per cent), Western Australia (4.5 per cent), Queensland (3.4 per cent) and New South Wales (3.1 per cent) in trend terms. Tasmania (3.5 per cent) and Victoria (0.6 per cent) were the only states to record increases, while the Northern Territory was flat.
Approvals for private sector houses fell 0.3 per cent in November in trend terms. Victoria (0.7 per cent) and New South Wales (0.1 per cent) rose, while decreases were recorded in Queensland (1.8 per cent), South Australia (1.0 per cent) and Western Australia (0.7 per cent).
In seasonally adjusted terms, total dwellings fell by 9.1 per cent in November, driven by a 17.9 per cent decrease in private dwellings excluding houses. Private houses fell 2.6 per cent in seasonally adjusted terms.
The value of total building approved fell 0.8 per cent in November, in trend terms, and has fallen for 12 months. The value of residential building fell 1.6 per cent, while non-residential building rose 0.6 per cent.
HIA Blames Credit Supply
The HIA were quick to blame tighter lending, blaming the banks for tightening too far. No, HIA, they are now obeying the law!
“This weak result shows just how much the current credit squeeze is weighing on the home building sector.
“The credit squeeze is happening at the behest of the banks’ own lending practices which have been tightened above and beyond APRA’s requirements.
“HIA research has found that the time taken to gain approval for a loan to build a new home has blown out from around two weeks to more than two months.
“APRA’s decision late last year to lift its 30 per cent cap on banks’ interest-only lending is a welcome development, but more needs to be done to mitigate the growing risks of a hard-landing in the housing market.
“Policy makers and lenders alike need to be cognisant that ordinary home buyers are now facing blow- outs in loan processing times and also much greater rates of flat-out loan rejection. Today’s results show how this is weighing substantially on the new home building sector.
“We’ve long been anticipating the current downturn in new home building, but there is a risk it could develop more quickly and strongly than expected.
“In particular policy makers and lenders will need to respond judiciously to the pending release of the Banking Royal Commission’s recommendations.”
The number of dwellings approved in Australia fell by 1.1 per cent in October 2018 in trend terms, according to data released by the Australian Bureau of Statistics (ABS) today.
NUMBER OF TOTAL DWELLING UNITS
The trend estimate for total dwellings fell 1.1% in October.
NUMBER OF PRIVATE SECTOR HOUSES
The trend estimate for private sector houses approved fell 0.5% in October.
NUMBER OF PRIVATE SECTOR DWELLINGS EXCLUDING HOUSES
The trend estimate for private sector dwellings excluding houses fell 1.8% in October.
VALUE OF NEW RESIDENTIAL BUILDING
The trend estimate for value of new residential building approved fell 1.5% in October and has fallen for ten months.
“The trend for total dwellings has been steadily declining over the past twelve months,” said Justin Lokhorst, Director of Construction Statistics at the ABS. “The decrease in October was mainly driven by private sector dwellings excluding houses, which fell 1.8 per cent. Private sector houses also declined, by 0.5 per cent.”
Among the states and territories, dwelling approvals fell in October in the Northern Territory (12.5 per cent), South Australia (5.0 per cent), Western Australia (4.4 per cent), Queensland (2.9 per cent) and New South Wales (2.3 per cent) in trend terms. Victoria (2.4 per cent) and the Australian Capital Territory (0.8 per cent) were the only states to record an increase in dwelling approvals in trend terms, while Tasmania was flat.
NEW SOUTH WALES
The trend estimate for total number of dwelling units in New South Wales fell 2.3% in October. The trend estimate for private sector houses rose 0.2% in October.
VICTORIA
The trend estimate for total number of dwelling units in Victoria rose 2.4% in October. The trend estimate for private sector houses rose 0.6% in October.
QUEENSLAND
The trend estimate for total number of dwelling units in Queensland fell 2.9% in October. The trend estimate for private sector houses fell 1.3% in October.
SOUTH AUSTRALIA
The trend estimate for total number of dwelling units in South Australia fell 5.0% in October. The trend estimate for private sector houses fell 2.6% in October.
WESTERN AUSTRALIA
The trend estimate for total number of dwelling units in Western Australia fell 4.4% in October. The trend estimate for private sector houses fell 3.7% in October.
Approvals for private sector houses fell 0.5 per cent in October in trend terms. Private sector house approvals fell in Western Australia (3.7 per cent), South Australia (2.6 per cent) and Queensland (1.3 per cent). Victoria (0.6 per cent) and New South Wales (0.2 per cent) recorded increases.
In seasonally adjusted terms, total dwellings fell by 1.5 per cent in October, driven by a 4.8 per cent decrease in private dwellings excluding houses. Private houses rose 2.7 per cent in seasonally adjusted terms.
The value of total building approved fell 1.5 per cent in October, in trend terms, and has fallen for twelve months. The value of residential building fell 1.4 per cent while non-residential building fell 1.8 per cent.
The number of dwellings approved in Australia fell by 1.9 per cent in September 2018 in trend terms, according to data released by the Australian Bureau of Statistics (ABS) today.
Dwelling units approved
“The fall was mainly driven by private dwellings excluding houses, which decreased by 2.7 per cent in September,” said Daniel Rossi, Director of Construction Statistics at the ABS. “Private sector houses also fell, by 1.5 per cent.”
Among the states and territories, dwelling approvals fell in September in the Australian Capital Territory (8.4 per cent), Northern Territory (6.9 per cent), South Australia (3.9 per cent), Queensland (2.3 per cent), Western Australia (2.1 per cent), New South Wales (1.3 per cent) and Victoria (1.0 per cent) in trend terms. Tasmania was the only state to see an increase in dwelling approvals (1.5 per cent) in trend terms.
Approvals for private sector houses fell 1.5 per cent in September in trend terms. Private sector house approvals fell in Queensland (3.1 per cent), South Australia (3.0 per cent), Western Australia (2.2 per cent) and Victoria (1.7 per cent). New South Wales recorded an increase of 0.5 per cent.
In seasonally adjusted terms, total dwellings rose by 3.3 per cent in September, driven by a 9.2 per cent increase in private dwellings excluding houses. Private houses fell 2.7 per cent in seasonally adjusted terms.
The value of total building approved fell 1.3 per cent in September, in trend terms, and has fallen for eleven months. The value of residential building fell 1.7 per cent while non-residential building fell 0.7 per cent.