Banks like RBS still look risky, but getting too tough could cause greater problems

From The Conversation.

Even in less politically volatile times, the news that the UK’s biggest bank, RBS, failed the Bank of England’s toughest everstress tests” would have dampened financial spirits. The bank must now raise an extra £2 billion to protect itself from future downturns. This may be made easier because RBS is 73% publicly owned, but that’s an unwelcome legacy of its exceptionally poor condition after the crash of 2007-08.

Meanwhile, the Bank of England (BoE) singled out two other banks – Barclays and Standard Chartered – for having “some capital inadequacies”. So why haven’t eight years of economic recovery cured the banks’ woes?

Banks remain solvent as long as their assets, the money they’ve lent to borrowers or invested, exceed their liabilities, the money they’ve borrowed from depositors or other lenders. If the economy worsens, a bank’s assets can fall because their investments lose value and “non-performing” loans have to be written off.

For this reason, the core “equity” capital that banks have raised from shareholders is regarded as a safety margin between assets and liabilities; unlike loans, it never has to be repaid. For building societies, accumulated reserves take the place of shareholders’ equity in providing this buffer.

Stressful times

Stress tests calculate the fall in a bank’s asset values under various adverse economic scenarios. If a shock looks big enough to wipe out the “Tier 1 capital” safety margin, the bank is asked to raise more capital and/or boost the value of assets or make them better hedged against losing value. The BoE and European Central Bank are among the institutions that have regularly conducted these tests since banks were caught with their capital ratios down in 2008.

Downturn became crisis in 2007-08 because, in the unusually long and placid upturn beforehand, banks ran their core capital to dangerously low levels. Regulators found Tier 1 capital in some cases to be worth just 1-2% of assets, once they removed permitted adjustments that exaggerated the capital and understated the risks to asset value.

The Bank of International Settlements (BIS), the central bank for central banks, duly imposed stricter requirements. These included core capital equal to at least 8% of what are known as risk-weighted assets – a system that sets lower capital requirements for assets considered less risky. Acknowledging that this system had itself contributed to risk being underestimated, the BIS also recommended a minimum “leverage ratio” of capital to total assets. (The BoE has continued to argue over the terms of this, fearing it could erode the cushion of reserves it’s supposed to promote.)

Alarm bells?

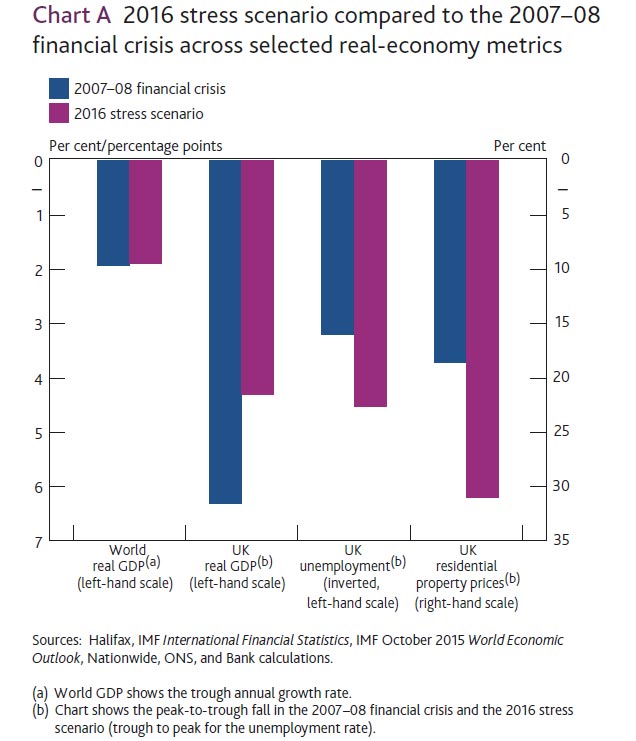
RBS failed the latest test, having passed in previous years, because the terms have been toughened. That’s a recognition that simultaneous setbacks could hit the world’s major economies before the BIS reforms are fully in place in 2019. If loans to businesses, individuals and governments in multiple countries all started going bad, banks’ assets fall much further than if it’s just one sector in one country. Countries’ problems became contagious in 2008 when household and corporate assets, especially property, plunged on both sides of the Atlantic.

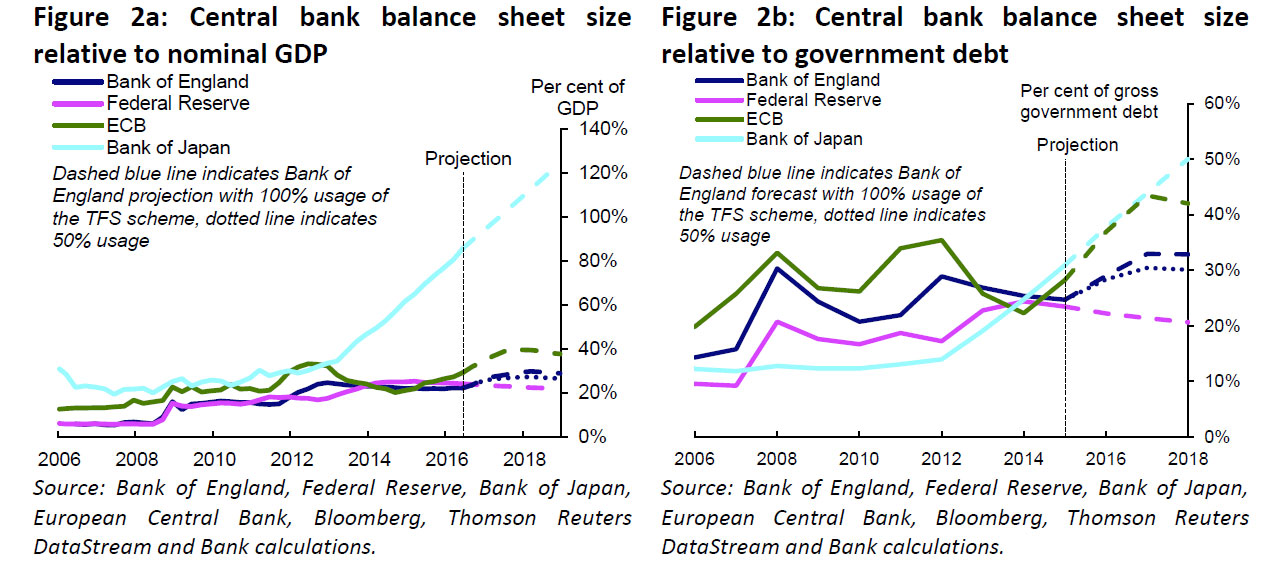
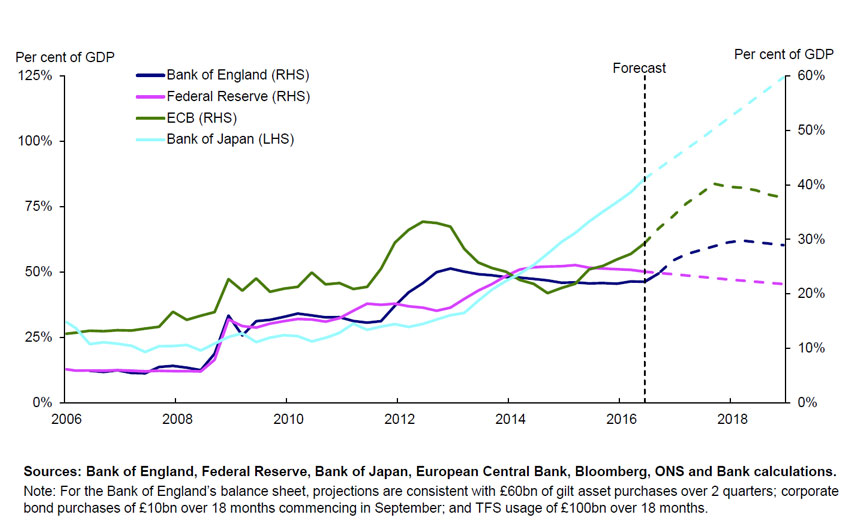
Policy measures taken to calm the last crisis might have raised the risks of another. Low interest rates and “quantitative easing” have encouraged more household and commercial debt, driving up property and financial asset prices. China, whose property bubble looks particularly pronounced, is among the greatest worries. Governments have also exacerbated their debts by spending to try to stop national output and price levels falling, leaving them ill-equipped to rescue collapsing banks again.

American economist, Irving Fisher.

These worries are deepened by the possibility that banks’ capital and reserves are still too low to withstand shocks. Some experts believe they need to rise by a factor of ten or more in relation to assets for the system to be totally safe. That view, pioneered by the American economist Irving Fisher, who identified the dangers of “debt deflation” in the 1930s, now has a range of powerful advocates including distinguished commentator Martin Wolf.

Wolf was a member of the UK’s Independent Commission on Banking, which in 2011 accepted the BIS’s recommendation of raising core capital to 8% of risk-weighted assets. More recently he argued it should be 100%. Where the current system reflects the fact that banks create money when they lend it, this “full reserve banking” would mean they could only lend what they had raised from the markets.

Regulatory dilemmas

Critics counter that such a radical move could bring the stability of the graveyard. It would give governments (via their central banks) complete control over their economies’ supply of money. Whereas banks currently generate most of the money supply by lending, they would be reduced to intermediaries channelling savings into investment.

For economic liberals, this would give the state an unacceptable monopoly over money – unless it returned to a gold standard that tied its currency to precious metals, which would effectively put a ceiling on how much money it could create. Others fear any substantial move away from the present “fractional reserve” system would cause a huge downturn while banks run down their lending and boost their capital.

Even then, central banks might be no better than now at phasing credit growth with economic growth to keep prices and production stable. And a gold standard might be inherently deflationary, unless breakthroughs in mining (or alchemy) kept precious metal stocks expanding in step with national output.


From out of the shadows … Inhabitant

But above all, private enterprise would always innovate to break this public monopoly. This is already visible in the rise of “shadow banking” – loans by institutions like hedge funds and private equity funds that escape bank regulation because they technically aren’t banks. Official statistics, which may understate the true situation, show shadow banking assets rising steadily to 12% of the total since regulation began tightening, mostly in rich economies where banking rules are tightest.

If once aberrant lenders like RBS are forced to mend their ways too radically, the next boom might just be powered from the shadows, causing new bubbles to burst in an even darker place. So central banks will stick to their present plan for gradual increases in capital, hoping any coming slowdown in growth won’t topple the banks that proved unstressed by their latest test.

Author: Alan Shipman, Lecturer in Economics, The Open University

Some UK Banks Fail Latest Stress Tests

The results of the 2016 UK Bank stress testing has been released by the Prudential Regulation Authority (PRA). The test did not reveal capital inadequacies for four out of the seven participating banks but the Royal Bank of Scotland Group (RBS), Barclays and Standard Chartered revealed some capital inadequacies and remedial work is required.

However, the PRA concluded that given the results, no system-wide macroprudential actions on bank capital were required in response to the 2016 stress test. Despite a more severe scenario, the aggregate low points for CET1 capital and Tier 1 leverage ratios were higher than in the 2014 and 2015 tests.

Background

In March 2016, the Bank of England launched its third concurrent stress test of the UK banking system. The 2016 stress test covered seven major UK banks and building societies (hereafter referred to as ‘banks’), accounting for around 80% of PRA-regulated banks’ lending to the UK real economy.

The 2016 stress-test scenario was designed under the Bank’s new approach to stress testing. Under this framework, the stress being tested against will generally be severe and broad, in order to assess the resilience of major UK banks to ‘tail risk’ events. Its precise severity will reflect the risk assessment of the FPC and PRA Board.

uk-stress-2016As such, the 2016 test was more severe than earlier tests. The severity of the stress in the 2016 scenario is based on the risk assessment the FPC and PRA Board made in March 2016 — that overall risks to global activity associated with credit, financial and other asset markets were elevated, and that risks associated with domestic credit were no longer subdued but
were not yet elevated.

The 2016 annual cyclical scenario incorporates a very severe, synchronised UK and global economic recession, a congruent financial market shock and a separate misconduct cost stress. Annual global GDP growth troughs at -1.9%, as it did during the 2008 global financial crisis. Annual growth in Chinese real GDP is materially weaker than in the financial crisis and troughs at -0.5%. The level of UK GDP falls by 4.3%, accompanied by a 4.5 percentage point rise in the unemployment rate. Overall, the UK stress is roughly equivalent to that experienced during the financial crisis, albeit with a shallower fall in domestic output, and a more severe rise in unemployment and fall in residential property prices.

The stress test also includes a traded risk scenario that is constructed to be congruent with this macroeconomic stress. Having fallen significantly during 2015, the price of oil reaches a low of US$20 per barrel, reflecting the slowdown in world demand. Investors’ risk appetite diminishes more generally and financial market participants attempt to de-risk their portfolios, generating volatility. The VIX index averages 37 during the first year of the stress, which compares to a quarterly average of around 40 between 2008 H2 and 2009 H1.

Interest rates facing some households and businesses increase in the early part of the stress, partly reflecting a rise in term premia on long-term government debt. Credit spreads on corporate bonds rise sharply, with spreads on US investment-grade corporate bonds, for example, rising from around 170 basis points to 500 basis points at the peak of the stress. Meanwhile, policymakers pursue additional monetary stimulus, which starts to reduce long-term interest rates.

Residential property and commercial real estate (CRE) prices also fall. Following rapid recent growth, these falls are particularly pronounced for property markets in China and Hong Kong, with residential property prices falling by around 35% and 50%, respectively. In the United Kingdom, house prices fall by 31% and average CRE prices fall by 42%. These falls are even greater for prime CRE, reflecting the fact that prices of these properties have risen more robustly since the financial crisis.

The 2016 stress test also incorporates stressed projections, generated by Bank staff, for potential misconduct costs, beyond those paid or provided for by the end of 2015. These stressed misconduct cost projections are not a central forecast of such costs. They are a simultaneous, but unrelated, stress alongside the macroeconomic stress and traded risk scenario incorporated in the 2016 test.

Impact of the stress scenario on the banking system

The stress scenario is estimated to lead to system-wide losses of £44 billion over the first two years of the stress, around five times the net losses incurred by the same banks as a group over 2008–09. Based on the Bank’s projections, the 2016 stress scenario would reduce the aggregate CET1 capital ratio across the seven participating banks from 12.6% at the end of 2015 to a low point of 8.8% in 2017, after factoring in the impact of management actions and the conversion of AT1 instruments into CET1 capital (Table 1).(1) The aggregate Tier 1 leverage ratio falls from 4.9% at the end of 2015 to a low point of 3.9% in 2017.

Compared to previous tests, the fall in the aggregate CET1 capital ratio from start to stressed low point was larger in the 2016 stress test, reflecting the greater severity of the stress scenario. Nevertheless, at 8.8% that low point was well above the 7.6% low point reached in 2014 and 2015.

Lloyds Banking Group and Santander UK cut their ordinary dividends to zero by the low point of the stress, in line with their published payout policies.(1) In reaction to losses made during both the first and second years of the stress, HSBC makes a substantial discretionary cut in ordinary dividend payments in 2016 and then pays no ordinary dividend in 2017,
as it makes a loss and becomes subject to CRD IV distribution restrictions. Meanwhile, Barclays and Standard Chartered are loss-making during the first two years of the stress and cut their ordinary dividend payments to zero as they become subject to CRD IV distribution restrictions. The Royal Bank of Scotland Group does not pay an ordinary dividend in any year
of the stress scenario. Nationwide continues to make distributions on its Core Capital Deferred Shares (CCDS).

In general, the stress has the greatest impact on those banks with significant international and corporate exposures. The three banks operating principally in domestic markets — Lloyds Banking Group, Nationwide and Santander UK — remain well above their hurdle rates throughout the stress. This reflects, in part, improvements in the asset quality of banks’ core UK mortgage businesses, through a combination of rising property prices, which have bolstered the value of collateral backing loans, as well as banks adopting more prudent new lending standards.

The PRA Board judged that:

  • The test did not reveal capital inadequacies for four out of the seven participating banks, based on their balance sheets at end-2015 (HSBC, Lloyds Banking Group, Nationwide Building Society and Santander UK).
  • The Royal Bank of Scotland Group (RBS) did not meet its common equity Tier 1 (CET1) capital or Tier 1 leverage hurdle rates before additional Tier 1 (AT1) conversion in this scenario. After AT1 conversion, it did not meet its CET1 systemic reference point or Tier 1 leverage ratio hurdle rate. Based on RBS’s own assessment of its resilience identified during the stress-testing process, RBS has already updated its capital plan to incorporate further capital strengthening actions and this revised plan has been accepted by the PRA Board. The PRA will continue to monitor RBS’s progress against its revised capital plan.
  • Barclays did not meet its CET1 systemic reference point before AT1 conversion in this scenario. In light of the steps that Barclays had
    already announced to strengthen its capital position, the PRA Board did not require Barclays to submit a revised capital plan. While these steps are being executed, its AT1 capital provides some additional resilience to very severe shocks.
  • Standard Chartered met all of its hurdle rates and systemic reference points in this scenario. However, it did not meet its Tier 1 minimum capital requirement (including Pillar 2A). In light of the steps that Standard Chartered is already taking to strengthen its capital position, including the AT1 it has issued during 2016, the PRA Board did not require Standard Chartered to submit a revised capital plan.
  • The FPC judged that the system should be capitalised to withstand a test of this severity, given the risks it faced. It therefore welcomed the actions by some banks to improve their capital positions. Despite a more severe scenario, the aggregate low points for CET1 capital and Tier 1 leverage ratios were higher than in the 2014 and 2015 tests. The FPC noted the increased resilience to stress provided by banks’ AT1 capital positions and banks’ stated intention to reduce dividends in stress. It also noted the strong performance of the most domestically focused banks. Given the results, no system-wide macroprudential actions on bank capital were required in response to the 2016 stress test.
  • The FPC is maintaining the UK countercyclical capital buffer rate at 0% and reaffirms that it expects, absent any material change in the outlook, to maintain this rate until at least June 2017. This reflects developments since the stress test was launched in March, which suggest greater uncertainty around the UK economic outlook and an increased possibility that material domestic risks could crystallise in the near term. The FPC was concerned that banks could respond to these developments by hoarding capital and restricting lending. That position has not changed.

Why are interest rates low?

In a speech at the University of Manchester on Wednesday, Bank of England Deputy Governor for Financial Stability, Sir Jon Cunliffe, discusses the factors that have influenced the level of interest rates over the recent past. He examines the policy challenges posed by a prolonged period of low underlying interest rates, and looks ahead at the trade-offs that the Monetary Policy Committee will have to make to bring inflation back to target.

Bank-Of-England

Jon explains that in order to understand why official rates are so low, it is necessary to analyse the drivers of two concepts of interest rate: the trend real rate of interest and the natural real interest rate (R*).

The trend real rate is a longer-term measure which balances the demand for investment with the supply of saving when the economy is growing at trend. Over the years, this has been depressed by a glut of savings, reduction in investment opportunities and expectations of a lower rate of real global economic growth. The natural real interest rate, meanwhile, is a shorter-term concept and is necessary to offset the impact of unexpected shocks hitting the economy. It is useful as a reference point for policymakers to assess the tightness or looseness of the monetary policy stance.

“It is generally acknowledged that the exceptional monetary policies implemented in the years immediately following the crisis were necessary. However we are now eight years on and monetary policy still appears to many exceptionally loose by reference to historical rates of interest. Can this still be justified by reference to the natural rate? My own view is that it can.”

Jon explains that while the natural rate has risen since 2012 from its post-crisis trough, it is now closer to the zero mark and is still likely to be negative. This is due to headwinds to demand from fiscal tightening, weakness in the global economy, restoration of credit spreads to more sustainable levels and elevated risk aversion. A further reason may be a drop in the trend real rate itself.

Jon identifies two main implications for central banks if the natural rate remains around zero and does not rise even as headwinds abate.

First, is that policy rates will remain low and will rise slowly and to levels materially below those that prevailed before the crisis; second, the tools deployed by central banks to offset shocks to the real economy will have more complex effects on the financial sector and the price of financial assets.

He observes that even if policy is following the natural rate of interest, the effects can be felt more powerfully when policy rates are at what appear to be very high or very low absolute levels. Central banks are mandated to make difficult trade-offs: most notably, when inflation is off-track, they have to balance the speed with which it is brought back to target against the impact on growth. However, it is not for central banks to make more granular judgements on the distributional effects of policy: such decisions should remain the province of elected authorities that have many instruments to address these issues.

The impact of the depreciation of sterling on future inflation has increased the salience of such a trade-off for the MPC, Jon notes.

“As the Committee has made clear, there are limits to the extent to which above-target inflation can be tolerated. These limits depend, inter alia, on what is driving the inflation overshoot, on the impact on inflation expectations, and on the scale of the output gap. The exchange rate shock has made it more difficult for policy to follow the natural rate,” according to Jon.

Finally, Jon examines the challenges posed by a secular period of very low interest rates. In that scenario, authorities with a longer policy horizon and with instruments with a more enduring impact are best placed to address those challenges, namely, raising the growth rate of productivity. Another challenge might be to address some of the longer term factors driving the imbalance in the supply of savings, and the demand for investment, including lower public investment, that appear to have pushed the trend real rate down.

“The answers to these challenges are not simple,” Jon concludes. “Structural change to raise productivity can be very difficult; it often means there will be losers and winners. Likewise, fiscal policy needs to balance public spending with sustainability through time.”

“These are certainly not, I readily admit, issues for central bankers. It is not so much that we have our plates quite full meeting our much narrower and shorter-term mandates – though that is surely true. It is that, more fundamentally, these are decisions and actions that only governments can and should take.”

Modelling The UK Housing Market

A speech by Andy Haldane Chief Economist at the Bank of England – The Dappled World– for the Shackle Biennial Memorial Lecture included a section on modelling the UK housing market using Agent-Based Models (ABM). It makes interesting reading. What you will see is a gradual heating-up of the mortgage market over the past few years, with a clear epicentre of London and the South-East.

The housing market has been one of the primary sources of financial stress in a great many countries (Jorda, Schulerick and Taylor (2014)).

Chart 6: UK House Prices: 1846-2015, Annual Long Range Distribution

UK House Prices: 1846-2015, Annual

Not coincidentally, this market has also been characterised by pronounced cyclical swings. Chart 7 runs a filter through UK house price inflation in the period since 1896. It exhibits clear cyclicality, with peak-to-trough variation often of around 20 percentage points. Mortgage lending exhibits a similar cyclicality.

Chart 7: Long-run UK house price growth 1846 to 2015

Chart 7: Long-run UK house price growth 1846 to 2015 Source: Hills, Thomas and Dimsdale (2016); Bank calculations. Notes: The chart shows the Hodrick-Prescott trend in annual house price growth data (where lambda=6.25). Data during WWI and WWII are interpolated.

House prices, like other asset prices, also exhibit out-sized booms and busts. Chart 6 plots the distribution of UK house price growth since 1846. It has fat-tails, with the probability mass of big rises or falls larger than implied by a normal distribution. For example, the probability of a 10% movement in house prices in any given year is twice as large as normality would imply.

Capturing these cyclical dynamics, and fat-tailed properties, of the housing market is not straightforward using aggregate models. These models typically rely, as inputs, on a small number of macro-economic variables, such as incomes and interest rates. They have a mixed track record in explaining and predicting housing market behaviour.

One reason for this poor performance may be that the housing market comprises not one but many sub-markets – a rental market, sales market, a mortgage market etc. Moreover, there are multiple players operating in these markets – renters, landlords, owner-occupiers, mortgage lenders and regulators – each with distinctive characteristics, such as age, income, gearing and location.

It is the interaction between these multiple agents in multiple markets which shapes the dynamics of the housing market. Aggregate models suppress these within-system interactions. The housing market model developed at the Bank aims to unwrap and model these within-system interactions and use them to help explain cyclical behaviour (Baptista, Farmer, Hinterschweiger, Low, Tang and Uluc (2016)).

Specifically, the model comprises households of three types:

  • Renters who decide whether to continue to rent or attempt to buy a house when their rental contract ends and, if so, how much to bid;
  • Owner-occupiers who decide whether to sell their house and buy a new one and, if so, how much to bid/ask for the property; and
  • Buy-to-let investors who decide whether to sell their rental property and/or buy a new one and, if so, how much to bid/ask for the property. They also decide whether to rent out a property and, if so, how much rent to charge.

The behavioural rules of thumb that households follow when making these decisions are based on factors such as their expected rental payments, house price appreciation and mortgage cost. These households differ not only by type, but also by characteristics such as age and income.

An important feature of the model is that it includes an explicit banking sector, itself a feature often missing from off-the-shelf DSGE models. The banking sector provides mortgage credit to households and sets the terms and conditions available to borrowers in the mortgage market, based on their characteristics.

The banking sector’s lending decisions are, in turn, subject to regulation by a central bank or regulator. They set loan-to-income (LTI), loan-to-value (LTV) and interest cover ratio policies, with the objective of safeguarding the stability of the financial system. These so-called macro-prudential policy measures are being used increasingly by policy authorities internationally (IMF-FSB-BIS (2016)).

The various agents in the model, and their inter-linkages, are shown schematically.

Figure 17: Agents and interactions in the housing market model

Figure 17: Agents and interactions in the housing market model
 Source: Baptista et al (2016).

This multi-agent model can be calibrated using micro datasets. This helps ensure agents in the model have characteristics, and exhibit behaviours, which match those of the population at large. For example, the distribution of loan-to-income or loan-to-value ratios on mortgages are calibrated to match the UK population using data on over a million UK mortgages. And the impact on the sale price of a house of it remaining unsold is calibrated to match historical housing transactions data.

One of the key benefits of the Agent-Based Models (ABM) approach is in providing a framework for drawing together and using, in a consistent way, data from a range of sources to calibrate a model. For example, a variety of data sources were used to calibrate this model, including:

  • Housing market data: FCA Product Sales Data, Council of Mortgage Lenders, Land Registry and WhenFresh/Zoopla.
  • Household surveys: English Housing Survey, Living Cost and Food Survey, NMG Household Survey, Wealth and Asset Survey, Survey of Residential Landlords (ARLA) and Private Landlord Survey.

Micro-economic data such as these are essential for understanding the impact of regulatory policies – for example, macro-prudential policies which affect the housing market. For example, the Bank has been making use of the FCA’s Product Sales Database to get a more granular picture of the mortgage position of households. This is a very detailed database, covering over 13 million financial transactions by UK households since 2005. By combining these data with land registry data, it is also possible to build up a regional picture of pockets of indebtedness.

Chart 8 documents the evolution of high (more than 4.5 times income) leverage mortgages since 2008, on a regional basis. Warmer colours suggest a higher fraction of loans at or above that multiple. What you will see is a gradual heating-up of the mortgage market over the past few years, with a clear epicentre of London and the South-East in the run up to the macro-prudential intervention made by the Bank of England’s Financial Policy Committee (FPC) in June 2014.

Chart 8: Proposition of mortgages with a loan-to-income ratio greater than 4.5Chart 8: Proposition of mortgages with a loan-to-income ration greater than 4.5
 Source: FCA Product Sales Database; Land Registry; Bank calculations.

One of the key features of an agent-based model is that it is able to generate complex housing market dynamics, without the need for exogenous shocks. In other words, within-system interactions are sufficient to generate booms and busts in the housing market. Cycles in house prices and in mortgage lending are, in that sense, an “emergent” property of the model.

Chart 9 shows a simulation run of the model, looking at the dynamic behaviour of listed prices, house prices when sold and the number of years a property is on the market. The model exhibits large cyclical swings, which arise endogenously as a result of feedback loops in the model. Some of these feedback loops are dampening (“negative feedback”), others amplifying (“positive feedback”).

For example, when mortgage rates fall, this boosts the affordability and the demand of housing, putting upward pressure on house prices. This generates expectations of higher future house price inflation and a further increase in housing demand – an amplifying loop.

Ultimately, however, affordability constraints bite and dampen house prices expectations and demand – a dampening loop. We can use the simulated data from Chart 9 to construct distributions of house price inflation over time (Chart 10). This simulated distribution exhibits fat-tails, if not as heavy as the historical distribution. Nonetheless, the model goes some way towards matching the moments of the real-world housing market.

Chart 9: Model simulations of the housing market

Chart 9: Model simulations of the housing market 
 
Source: Baptista et al (2016). Notes: Blue is the list price index, red the house price index and green the number of years a house is on the market.
Chart 10: The distribution of house pricesChart 10: The distribution of house prices
 Source: Baptista et al (2016); Hills, Thomas and Dimsdale (2016); Bank calculations. Notes: The blue diamonds show the distribution of simulated house price growth for over 160 years from the model. The red diamonds show the distribution of real house price growth between 1847 and 2015.

This same approach can also be used to examine the impact of various macro-prudential policy measures, whether hard limits (such as an LTV limit of 80% for all mortgage contracts) or soft limits (such as an LTI cap for some fraction of mortgages). These policies could also be state-contingent (such as an LTV limit if credit growth rises above a certain threshold).

As an example, we can simulate the effects of introducing a loan-to-income (LTI) limit of 3.5, where 15% of mortgages are not bound by this limit. This simulation is similar, if not directly comparable, to the macro-prudential intervention made by the Bank of England’s Financial Policy Committee (FPC) in June 2014.

Chart 11 looks at the simulated impact of this policy on the distribution of loan-to-income ratios across households, relative to a policy of no intervention. The incidence of high LTI mortgages (above 3.5) decreases, with some clustering just below the limit. With some borrowers nudged out of riskier loans, a greater degree of insurance is provided to households and the banking system. Another advantage of these class of models is that they allow you to simulate the longer run impacts once the second round and feedback loops have taken effect. Chart 12 shows that the distribution of house price growth narrows under the scenario relative to the baseline.

Chart 11: Simulated effect of a loan-to-income policyChart 11: Simulated effect of a loan-to-income policy
Source: Baptista et al (2016).

Chart 12: Simulated effect on house price growthChart 12: Simulated effect on house price growth
Source: Baptista et al (2016).

Fintech – The Gap Between Institution and Innovation

In a speech at Web Summit in Lisbon Charlotte Hogg, the Bank of England’s Chief Operating Officer, gave an update on the work of the Bank’s FinTech Accelerator since its launch in June. Charlotte detailed the current work underway and the firms we are engaging with. She also announced that the window for applications for the next round is now open.

Fintech-Pic

The FinTech Accelerator deploys innovative technologies on issues that matter to the Bank’s mission and operations. Working in partnership with FinTech firms we are seeking to develop new approaches, build our understanding of these new technologies and in some way support development of the sector.

Commenting on the progress of the FinTech Accelerator since its launch in June and the completed proof of concepts, Charlotte said:

“We set up the Bank’s FinTech Accelerator in the Bank, launched in June this year, precisely to develop our practical experience of FinTech.  Just over the past six months we have met or researched over 130 start-ups, participated in around 25 conferences, and held roundtables with more than 80 organisations. In listening and learning, we are ableto begin forming a judgement about the impact of these technologies. In the Accelerator, we seek to engage with a large number of FinTech firms and technologies, and to run a series of targeted, rapid proof of concepts (POCs) with a number of them.  All POCs are work on problems or challenges that are important to us, and the firms are carefully chosen through an open process based on our published criteria…Recent POCs have covered three main areas – data analytics, information security, and some work exploring distributed ledgers.”

Charlotte then announced the current POCs and the start-ups the Bank is working with:

“A recent addition to the FinTech Accelerator is a POC with BMLL Technologies that uses a machine learning platform, applied to historic limit order book data, to spot anomalies and facilitate the use of new tools in our analytical capabilities.  A second new POC, with Enforcd, uses an analytic platform designed specifically to share public information on regulatory enforcement action.

We have also partnered with two firms – Anomali and ThreatConnect – that provide innovative technologies to collect, correlate, categorise and integrate cyber security intelligence data.”

Charlotte concluded by announcing that the window for the next round of applications is now open:

“New technologies present opportunities and risks and we need to assess both…as part of our mission to promote the public good.  Today, we’ve opened our next call for applications as we seek to further our research and work, continuing to bridge the gap between institution and innovation.”

New Bank of England rules bring UK closer to ending taxpayer bailouts

The Bank of England is today announcing new rules designed to make it easier to manage the failure of banks and building societies in an orderly way, as part of reforms to end taxpayer bailouts in the UK.

During the financial crisis, governments were forced to bail out failing banks, rather than risk the damage that a disorderly failure would have had on the wider economy and financial system. Some banks were too big to be allowed to fail.

Bank-Of-England

Today, following a public consultation, we are publishing our policy on setting the Minimum Requirement for own funds and Eligible Liabilities (MREL), which is a requirement under the EU Bank Recovery and Resolution Directive. These requirements will make it possible to resolve failing banks by ensuring that they hold sufficient equity and debt to absorb losses. It will enable the recapitalisation of businesses that need to keep operating during the process because they provide important financial services to households and businesses. This process is called ‘bail-in’.

These rules represent one of the last pillars of post-crisis reforms designed to make banks safer and more resilient, and to avoid taxpayer bailouts in future. Banks are now required to hold several times more loss-absorbing resources than they did before the crisis, while annual stress tests check firms’ resilience to severe but plausible shocks. Banks are now also structured in a way that supports resolution. The Bank of England now has the legal powers necessary to manage the failure of a bank, and significant progress has been made to ensure there is coordination between national authorities should a large international bank fail.

The new rules will be introduced in two phases. Banks will be obliged to comply with interim requirements by 2020. From 1 January 2022, the largest UK banks will hold sufficient resources to allow the Bank of England to resolve them in an orderly way.

Mark Carney, Governor of the Bank of England, said: ‘This policy is a significant milestone on the journey to end ‘Too big to fail’ in the UK. The implementation of MREL will ensure that banks that provide essential economic functions hold sufficient resources to be resolved in an orderly way, without recourse to public funds, and whilst allowing households and businesses to continue to access the services they need.’

Summary of the MREL policy

The Bank of England is the UK’s resolution authority and is responsible for developing resolution plans for banks, building societies and the larger investment firms. The resolution regimes and the plans developed under it are designed to ensure that if these firms fail they can be resolved in an orderly manner; that is to say, without the use of public funds or disruption to broader financial stability.

MREL is a key part of making resolution credible. MREL is a minimum requirement for institutions to maintain equity and eligible debt liabilities, and is a requirement under the EU Bank Recovery and Resolution Directive. The purpose of MREL is to help ensure that when institutions fail, the resolution authority can use these financial resources to absorb losses and recapitalise the continuing business. As a result, MREL is a critical element of an effective resolution strategy.

We will set MREL for individual institutions by reference to three broad resolution strategies. These strategies reflect our legal obligations, judgement of risk over the potential disruption to critical economic functions and need to apply a proportionate approach:

  • Modified insolvency process – for small firms, which we assess do not provide services of a scale considered critical. A pay-out by the Financial Services Compensation Scheme (FSCS) of covered depositors would meet our resolution objectives. These institutions will meet their MREL simply by meeting their existing capital requirements.
  • Partial transfer – where firms are considered to be too large for a modified insolvency process. MREL will be set at a level which permits a transfer of critical parts of the business to take place.
  • Bail-in – the largest and most complex firms will be required to maintain sufficient MREL to absorb losses and, in the event of their failure, be recapitalised so that they continue to meet the Prudential Regulation Authority’s conditions for authorisation. The aim is that the firm is able to operate without public support.
  • interim requirements by 2020 (with a 2019 requirement for G-SIBs) and
  • end-state requirements by 2022, subject to a review by the end of 2020.

We will communicate more detail to firms on the MREL policy that applies to them by the end of 2016.

Resolution strategies and calibration of MREL

The Bank will set MREL on a firm-specific basis, informed by the resolution strategy for that firm.

(a) From 1 January 2019 UK G-SIBs will be required to meet the minimum requirements set out in the Financial Stability Board’s standard for Total Loss-Absorbing Capacity (TLAC) of the higher of 16% of risk weighted assets (RWAs) or 6% of leverage exposures.

(b) From 1 January 2020:

  • UK G-SIBs and D-SIBs (which have bail-in resolution strategies) will be required to meet an interim MREL equivalent to the higher of:
    • two times their Pillar 1 capital requirements and one times their Pillar 2A capital requirements, i.e. (2 x Pillar 1) plus (1 x Pillar 2A); or
    • 6% leverage exposures.
  • Other bail-in / partial transfer institutions will be required to meet an MREL of 18% RWA.

(c) From 1 January 2022, and subject to review before the end of 2020:

  • UK G-SIBs will be required to meet an end-state MREL equivalent to the higher of:
    • two times the sum of Pillar 1 and Pillar 2A, i.e. 2 x (Pillar 1 plus Pillar 2A); or
    • the higher of two times the applicable leverage ratio requirement or 6.75% of leverage exposures (in line with the TLAC standard);
  • D-SIBs and any other bail-in/transfer institutions will be required to meet an end-state MREL equivalent to the higher of:
    • two times the sum of Pillar 1 and Pillar 2A, ie 2 x (Pillar 1 plus Pillar 2A) or
    • if subject to a leverage ratio requirement, two times the applicable requirement (e.g. 6% if the leverage ratio is 3%).

In light of the consultation, we have decided that modified insolvency would not be an appropriate resolution strategy for firms that provide more than 40,000 to 80,000 transactional bank accounts (accounts from which more than 9 withdrawals have been made within a three-month period). The original proposal was for a threshold of 40,000 accounts. Firms with fewer than 40,000 such accounts will therefore have a modified insolvency resolution strategy with MREL set at the level of regulatory capital requirements.

Timing of MREL implementation
In light of changes to the EBA Regulatory Technical Standards that govern the implementation of MREL in EU member states, and in response to feedback from the consultation, we will extend the deadline for firms to meet their MREL by two years to 1 January 2022. However, to ensure that firms make progress towards meeting their end-state requirements, they will be required to meet interim MRELs by 1 January 2020. The Bank will review the timing and calibration of the end-state requirement before the end of 2020.

Bank of England Rate held at 0.25%

On the day the UK High Court has ruled that the prime minister can’t trigger the UK’s exit from the European Union without approval from Parliament, the Bank of England’s Monetary Policy Committee (MPC) voted unanimously to maintain the Bank Rate at 0.25%. They think inflation may lift quite smartly next year to 2¾%, but underscores the myriad of uncertainties surrounding the economy.

Bank-Of-England

The Committee voted unanimously to continue with the programme of sterling non-financial investment-grade corporate bond purchases totalling up to £10 billion, financed by the issuance of central bank reserves.  The Committee also voted unanimously to continue with the programme of £60 billion of UK government bond purchases to take the total stock of these purchases to £435 billion, financed by the issuance of central bank reserves.

At the time of the August Inflation Report, the Committee announced a package of supportive measures that it judged was appropriate to balance the trade-off that had emerged in the economic outlook.  On the one hand, economic activity was expected to weaken and unemployment to rise, given the period of uncertainty likely to follow the referendum on EU membership.  On the other hand, inflation was expected to rise to a rate above the 2% target, for an extended period, as a result of the depreciation of sterling that had accompanied the referendum result.  At the August meeting, a majority of Committee members also expected to support a further cut in Bank Rate at one of the remaining MPC meetings of 2016 if the outlook remained broadly consistent with the one set out in the August Report.

In the three months since then, indicators of activity and business sentiment have recovered from their lows immediately following the referendum and the preliminary estimate of GDP growth in Q3 was above expectations.  These data suggest that the near-term outlook for activity is stronger than expected three months ago.  Household spending appears to have grown at a somewhat faster pace than projected in August, and the housing market has been more resilient than expected.  By contrast, investment intentions have continued to soften and the commercial property market has been subdued.

In financial markets, the past three months have been characterised by two phases.  In the first, the sterling exchange rate stabilised for a period following its initial post-referendum depreciation.  Supported by the measures announced by the MPC in August and more positive activity indicators, financial conditions and other asset prices recovered from the deterioration seen straight after the referendum, accompanied by a sharp increase in corporate bond issuance.  However, in the period since the beginning of October, the sterling effective exchange rate index has depreciated further.  Market intelligence attributes these latter movements to perceptions that the United Kingdom’s future trading arrangements with the EU might be less open than previously anticipated, requiring a lower real exchange rate to improve competitiveness and support activity.  Longer-term gilt yields have risen notably, as have market-implied expectations of medium-term inflation.

The Committee’s latest projections for output, unemployment and inflation, conditioned on average market yields, are set out in the November Inflation Report.  Output growth is expected to be stronger in the near term but weaker than previously anticipated in the latter part of the forecast period.  In part that reflects the impact of lower real income growth on household spending.  It also reflects uncertainty over future trading arrangements, and the risk that UK-based firms’ access to EU markets could be materially reduced, which could restrain business activity and supply growth over a protracted period.  The unemployment rate is projected to rise to around 5½% by the middle of 2018 and to stay at around that level throughout 2019.

Largely as a result of the depreciation of sterling, CPI inflation is expected to be higher throughout the three-year forecast period than in the Committee’s August projections.  In the central projection, inflation rises from its current level of 1% to around 2¾% in 2018, before falling back gradually over 2019 to reach 2½% in three years’ time.  Inflation is judged likely to return to close to the target over the following year.

The MPC’s Remit requires that monetary policy should balance the speed with which inflation is returned to the target with the support for real activity.  Developments since August, in particular the direct impact of the further depreciation of sterling on CPI inflation, have adversely affected that trade-off.  This impact will ultimately prove temporary, and attempting to offset it fully with tighter monetary policy would be excessively costly in terms of foregone output and employment growth.  However, there are limits to the extent to which above-target inflation can be tolerated.

Those limits depend, for example, on the cause of the inflation overshoot, the extent of second-round effects on inflation expectations and domestic costs, and the scale of the shortfall in economic activity below potential.  In the MPC’s November forecast, the inflation overshoot is the product of a perceived shock to future supply, which has caused the exchange rate to fall, alongside a modest projected shortfall of activity.  Inflation expectations have picked up to around their past average levels and domestic costs have remained contained. Given the projected rise in unemployment, together with the risks around activity and inflation, and the potential for further volatility in asset prices, the MPC judges it appropriate to accommodate a period of above-target inflation.  That notwithstanding, the MPC is monitoring closely the evolution of inflation expectations.

In light of these developments, and in keeping with its Remit, the MPC at its November meeting agreed unanimously that Bank Rate should be maintained at its current level.  It also agreed unanimously that it remained appropriate to continue the previously announced asset purchase programmes, financed by the issuance of central bank reserves.

Earlier in the year, the MPC noted that the path of monetary policy following the referendum on EU membership would depend on the evolution of the prospects for demand, supply, the exchange rate, and therefore inflation.  This remains the case.  Monetary policy can respond, in either direction, to changes to the economic outlook as they unfold to ensure a sustainable return of inflation to the 2% target.

The call for an ‘ethical lift’ across finance

The call for improved culture in financial services is gaining momentum, and not just in Australia. For example, Bank of England Deputy Governor Minouche Shafik and Executive Director James Proudman spoke at the New York Federal Reserve’s conference ‘Reforming Culture and Behaviour in the Financial Services Industry: Expanding the Dialogue’.  They stress it is more about culture and behaviour within firms than regulation. The right remuneration mechanisms are important.

ethics-pic

Minouche, the Bank’s Deputy Governor for Markets and Banking, discusses the challenge of reform from a market-wide perspective, while James, who is Executive Director for UK Deposit Takers Supervision, discusses firm-level implementation. Minouche explores the wide-ranging actions of the UK authorities after the Fair and Effective Markets Review (FEMR) to help reverse the tide of misconduct that had emerged across markets since the financial crisis. Within this broad theme, James explains how the Prudential Regulation Authority (PRA) is implementing a regulatory framework around accountability and how this is applied to individual firms.

Highlighting the progress described in the FEMR implementation report published in July, Minouche explains that while ‘regulators must introduce rules and regulations to enforce minimum standards of conduct, hold individuals to account for their actions, and put in place incentives to promote good conduct, hard law is not enough…market participants must come together to create soft law: aspirational standards that are higher than the regulatory minimum and encourage ongoing behavioural change’.

Minouche emphasises the importance of the official sector not only implementing rules and regulations but also playing ‘a broader role by promoting good behaviour’. In particular she praises the work of senior market participants in establishing the Fixed Income, Currencies and Commodities (FICC) Markets Standards Board and notes the progress being made towards a single Global FX code, which is being developed through a partnership between 16 central banks and market participants.

Minouche also notes that ‘conduct risks will evolve over time and the official sector needs to stay on the front foot’. In response, the UK authorities have announced a work programme to scan the horizon for potential market or private sector coordination failures that may be damaging the fairness or effectiveness of FICC markets. The authorities will seek to catalyse reforms to insure that market structures that are vulnerable to manipulation and misconduct do not develop over time.

 Read the full text of Minouche’s speech

Turning to the supervision of UK banks, James outlines the PRA’s approach to culture and accountability, and how we apply this to firms – including through the new Senior Managers Regime and remuneration rules (individual accountability) and guidance on governance for boards (collective accountability).

James stresses that both individual and collective responsibility are crucial to promoting a healthy culture within the sector. He says: ‘taken together, the reforms that we have put in place with respect to both individual and collective responsibility are aimed at creating a regime in which the senior management of firms are now ‘on the hook’ for the decisions taken within the firm: both the key strategic decisions taken at senior management level, and the framework of delegations and decision-taking that cascades through the organisation.’

James adds: ‘Ensuring there is a clear and transparent answer to the question ‘who’s in charge?’ has been a priority of the prudential reform agenda in the UK.’

 Read the full text of James’s speech

Both Minouche and James reinforce the Bank’s commitment to improving standards and ethics in financial markets.

Minouche concludes: ‘It will take time to move from ‘ethical drift’ to ‘ethical lift’. Better regulation is part of the solution, but so is a more effective partnership between the official and private sectors to improve market practices and conduct norms.’

The Impact of “Quantitative Easing”

A Bank of England staff working paper “QE: the story so far” looks at the impact of QE and reviews the impact of central bank balance sheet expansions on financial markets and the economy. QE has led to a massive expansion in central bank balance sheets. Their analysis identifies three significant impacts.  First, it is only when central bank balance sheet expansions are used as a monetary policy tool that they have a significant macro-economic impact. Second, there is evidence for the US that the effectiveness of QE may vary over time, depending on the state of the economy and liquidity of the financial system. And third, QE can have strong spill-over effects cross-border, acting mainly via financial channels. For example, the impact of US QE on UK economic activity may be as large as the impact on US economic activity.

The modern history of Quantitative Easing (QE) starts in February 1999. With policy rates having approached the lower bound for nominal interest rates, one member of the Bank of Japan’s (BoJ’s) Policy Board expressed an opinion that the Bank of Japan should “implement a quantitative easing by targeting the monetary base”. In 2001, Japan began down that road, purchasing government bonds financed by the creation of central bank reserves.

Outside Japan, QE was first adopted by the US Federal Reserve and the Bank of England in 2008 and 2009, as they neared the lower bound for nominal interest rates and sought to provide additional monetary stimulus. In 2015, these countries were joined by the euro-area, as the European Central Bank (ECB) began expanding its balance sheet as it neared the lower bound for interest rates. Three of these four central banks were continuing to expand their balance sheets in the second half of
2016.

Thus, it is only during this century, and in particular since the global financial crisis, that we have seen central bank balance sheet expansions taking on an explicit monetary policy objective. Since 2007-8, as a number of countries approached the effective lower bound for official interest rates, central banks made outright purchases of securities funded by the creation of central bank reserves – Quantitative Easing or QE. This has led to a substantial increase in central banks’ balance sheets, both relative to nominal GDP and to the stock of government debt outstanding.

boe-20-octBut what are the impacts of this approach?

The first half of the paper reviews the international evidence on the impact on financial markets and economic activity of this policy. It finds that these central bank balance sheet expansions had a discernible and significant impact on financial markets and the economy.

The second half of the paper provides new empirical analysis on the macroeconomic impact of central bank balance sheet expansions, across time and countries.

They conclude “In the past decade or so, central bank balance sheet expansions have been used as a tool for loosening monetary policy. This paper has gathered together empirical evidence on the effectiveness of these policies on financial markets and the wider economy. It finds reasonably strong evidence of QE having had a material impact on financial markets, generating a significant loosening in credit conditions. There is also evidence of QE having served to boost temporarily output and prices, in a way not associated with other central bank balance sheet expansions.

The effectiveness of QE policies does vary, however, both across countries and time. For example, there is some evidence of QE interventions being more effective when financial markets are disturbed. There is also evidence of strong positive international spill-over effects of QE from one country to another. This paper has focussed on the aggregate impact of central bank balance sheet expansions. This leaves to future research important issues such as the impact of a reversal in QE policies and the distributional consequences of QE.

Note: The views expressed in this paper are those of the authors, and not necessarily those of the Bank of England or its committees.

Central Bank Balance Sheets Explode

There has been astonishing growth in the balance sheets of Central Banks in recent years, as attempts have been made to deal with fallout from the GFC nearly eight years ago. Globally we estimate the total assets of central banks are now north of US$17 trillion. But it is worth thinking about the implications of this expansion, in both policy and economic terms. In some geographies money has been “created”, leading to asset bubbles when coupled with low interest. But even in markets where “QE” has not been used, Central banks are still more active, and larger. Here is some data on USA, Australia and European central banks underscoring the absolute rate of growth.


A speech given by Minouche Shafik, Deputy Governor, Markets & Banking, Bank of England explores some of the issues.

Gone is the pre-crisis ideal of minimalist central banks with small balance sheets, narrowly defined objectives and tools, and a bias toward non-intervention. Today, major central banks have greater responsibilities and a wider range of tools at our disposal. Our balance sheets are larger and for the most part continuing to increase.

boe-size-to-gdp

I’d like to use these remarks to offer a number of reflections on these developments, using the Bank of England’s recent experience by way of example, and focussing on four themes.

My first theme is that the broadening of our responsibilities and range of tools at our disposal has facilitated a more joined up approach to how we set monetary policy and pursue financial stability.

Second, the increase in size of our balance sheet has been a necessity of the times we live in. Deep structural forces have combined to depress the level of interest rates at which the economy would be in equilibrium, obliging us to rely evermore on monetary policies that were once considered unconventional. This requires us to operate with multiple instruments in multiple markets meaning that our impact on the financial system – the central bank’s footprint – is larger.

Third, we are aware that some of our policies have spillovers and side effects, but we take steps to address them where feasible to do so within our mandate. We know that a bigger footprint means we need to be mindful of our step.

Finally, despite our bigger size, there are some things central banks cannot do. To generate sustainably strong growth over the medium term, monetary and financial stability policy must be part of a balanced package that also includes the government’s economic policies and, given strong global interconnections, international policy co-ordination.