“Today I will talk about the imminent arrival of the revised liquidity regime for the Australian financial sector. I will recap some of its features, particularly how they relate to the Reserve Bank, and discuss some of the impact that it is having on market pricing.
An important aspect of the Basel III liquidity standard, the Liquidity Coverage Ratio (LCR), comes into effect in under one month’s time at the beginning of 2015. The LCR requires that banks hold sufficient ‘high quality liquid assets’ (HQLA) to withstand a 30-day period of stress. The amount of HQLA a bank needs to hold is determined by the composition and maturity structure of its balance sheet. The more liabilities that run off within that 30-day window, the more HQLA that needs to be held. At the same time, particular types of investors or depositors are assumed to be less stable than others (in terms of their likelihood of withdrawing funds), which also results in a greater need for liquid assets.
As has been known for some time, the Australian financial system does not have an especially large stock of HQLA. The only instruments that have been deemed to meet the Basel standard of liquidity are debt issued by the Commonwealth and state governments (CGS and semis) along with cash balances at the Reserve Bank. The banking system’s overall liquidity needs are greatly in excess of what could reasonably be held in those assets. To put some numbers on this, APRA has determined that for next year, the Australian banking system’s liquidity needs amount to $450 billion. The total stock of CGS and semis on issue currently amounts to around $600 billion. If the banks were to attempt to meet their liquidity needs solely by holding only CGS and semis, a number of problems would arise. Firstly, any attempt would likely be in vain, because there are a large number of other entities which are required to or want to hold CGS and semis too. Second, in the process of trying to do this, the liquidity of the market for these securities would be seriously compromised. This would be completely self-defeating as the overall aim is to have the banks hold more liquid assets.
To address these circumstances, an important component of the liquidity regime in Australia is the committed liquidity facility (CLF) where, on the payment of a 15 basis point fee, banks will be able to obtain a commitment from the Reserve Bank to provide liquidity against a broad range of assets under repurchase agreement.
APRA has recently determined that the total CLF requirements of the Australian banking system for 2015 amount to around $275 billion. This amount was determined by first assessing that the amount of CGS and semis that could reasonably be held by banks without unduly affecting market functioning was $175 billion. The Reserve Bank provided this assessment to APRA. The CLF amount is then simply the difference between this and the overall liquidity needs of the system.
The banks that require a CLF from the Reserve Bank sign a deed of agreement with us and pay their fee before the end of this year. Then from the beginning of next year, the arrangement comes into effect.
I have talked before about some of the impact on pricing in various markets of the new liquidity regime.[4] We have attempted to limit the impact on the price of CGS and semis, but necessarily, because the banks are holding more of these securities than previously (Graph 1), the price is higher (and the yield lower) than would otherwise be the case.
Graph 1
Overall, the impact of the LCR on market pricing is relatively small. The larger changes have been around deposit pricing and the terms and conditions of deposits, which I will come to shortly, but there have been some other effects which are worth commenting on.
Firstly, a less discussed aspect of the liquidity standard is the requirement for a demonstrated internal liquidity transfer pricing model for banks. This has required banks to fully reflect the liquidity cost in the price of the various services they offer customers. This has resulted in a change in the price and/or terms and conditions of a number of facilities. One noteworthy example is a line of credit where, in the past, banks often did not factor into the price they charged for this facility, the potential draw on liquidity this entailed, particularly in a stressed situation. On the other hand, longer fixed-term deposits are more attractive to banks and consequently have been repriced upwards (see below).
A second impact which has been evident more recently is a widening in the spread between bank bills and OIS (Graph 2). In the depths of the crisis, such a widening was often an indicator of stress in the financial situation. But that does not appear to be the case currently as other indicators of bank creditworthiness are little changed, including spreads on longer term borrowing and CDS premia.
Graph 2
 Instead, our assessment is that in large part, this reflects the new liquidity regime combined with some other dynamics in the market. The graph shows that the widening has been most pronounced at the longer bank bill maturities, and indeed is quite small for a one month bank bill. This is because issuing a one month bill has little attraction to a bank: its liquidity cost is relatively high as its maturity is likely to occur within the 30-day liquidity window. Hence a bank would need to hold HQLA of similar size to the amount of funding the bank bill raised. Instead, there is a greater incentive to issue at longer maturities and so the spread on 6-month bills has widened by more as there has been greater supply of such paper.
Over the past two months, the original term to maturity of bank bills and certificate of deposits on issue has changed noticeably, with the stock of 6-month bills increasing by $7.3 billion (11 per cent) and 12-month bills by $1.4 billion (43 per cent). In contrast, the stock of outstanding bills with an original tenor shorter than five months has declined by a total of $9.7 billion (8½ per cent).
At the same time, the cost of Australian dollars in the forward FX market has been quite elevated. This high price in the forwards market has been due to a number of factors including the tendency of hedge funds to fund their Australian dollar shorts in this market, as well as an increase in the use of this market by foreign bank branches to fund Australian dollar lending.
Historically, Australian banks have tended to raise a significant share of their short-term funding in foreign markets, mostly in US dollars, and then swap them back into Australian dollars to fund their Australian dollar-denominated asset base. They would swap these foreign currency funds when the cost was sufficiently attractive, leaving it in foreign currency in the interim. Under the new liquidity regime, the cost of short-term foreign currency funding is higher, so this is less attractive. Combined with a higher swap cost, the all-in cost of short-term offshore funding is higher and hence domestic issuance is relatively more attractive. As a result we have seen more of it, which has contributed to the widening in the spread to OIS.
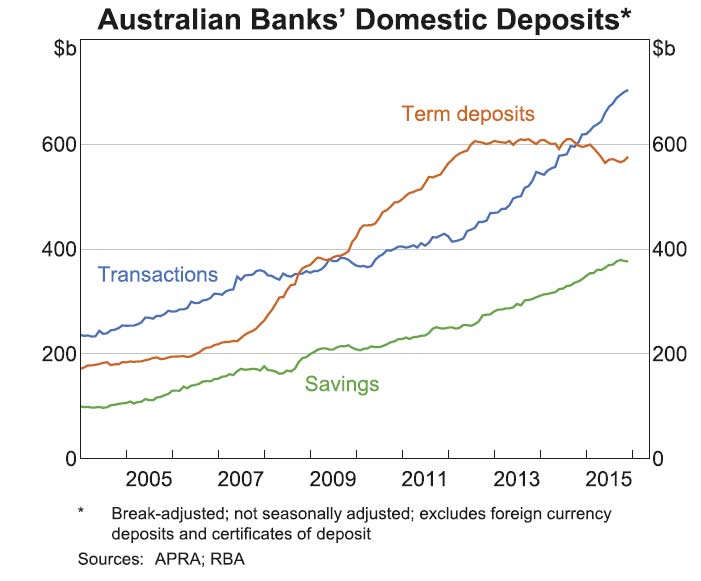
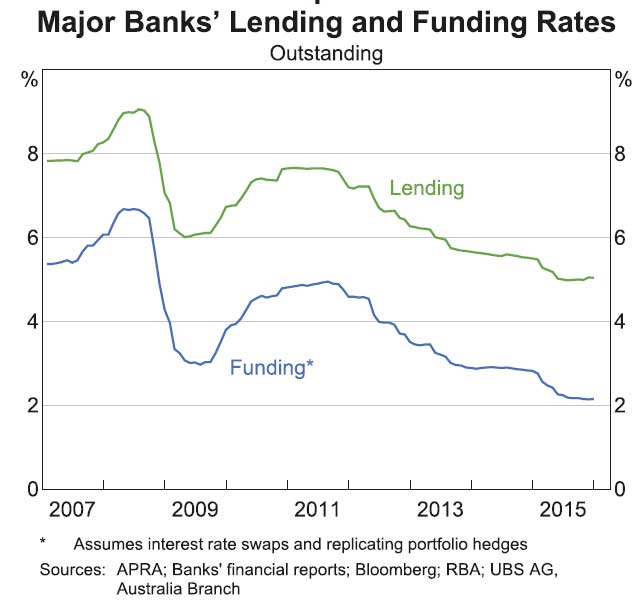
Finally, I will return to the impact of the LCR on deposit pricing. Graph 3 shows the evolution of the funding mix of Australian banks over the past decade. The rise in the share of deposit funding from 2008 is readily apparent, as is the decline in the share of short-term and long-term wholesale funding. The growth in deposits is now of a similar pace to that in bank lending, having been considerably faster over recent years. As a result, the deposit share of funding has levelled off.
Graph 3
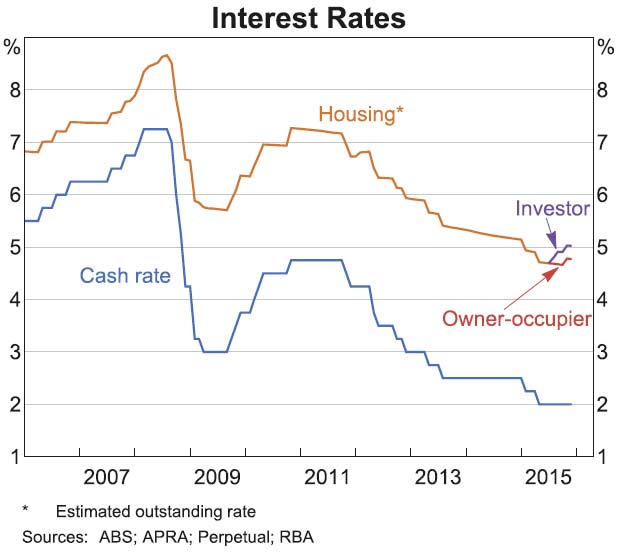
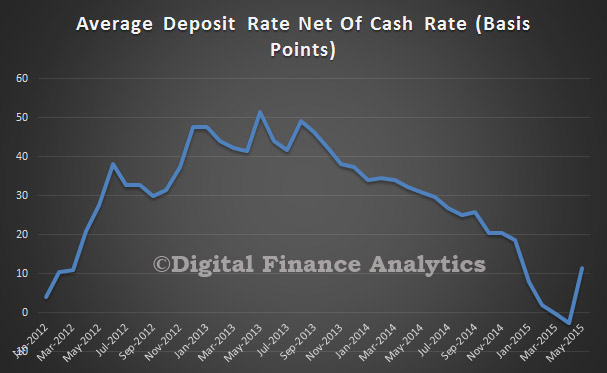
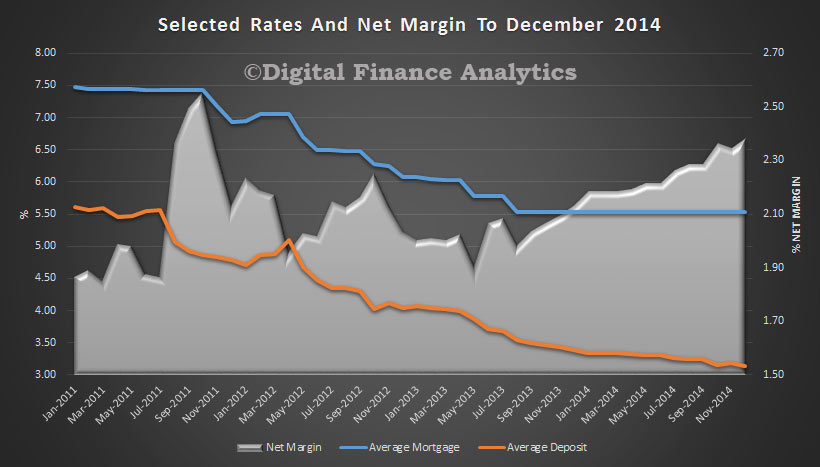
The increase in deposit funding was in part a result of the increased returns on offer, as banks actively sought this outcome by offering higher interest rates. (It also reflected a shift on the part of investors for the perceived safety of a bank deposit.) The interest rate on both at-call and term deposits rose markedly compared with money market rates of equivalent maturity (Graph 4). As you can see from the graph, this process of paying higher deposit rates has largely run its course.
Graph 4
 Within this overall repricing, there have been some changes in the mix of deposit rates and products as a result of the introduction of the LCR. As I mentioned earlier, banks have an incentive to reduce the amount of liabilities that roll off in less than 30 days. Deposits which are deemed to be subject to high run-off rates and those which are callable within 30 days will be more expensive for banks. Banks are therefore working towards converting many of these less stable deposits into a more stable deposit base. For example, retail and SME deposits are deemed to be ‘stickier’ than institutional deposits. Part of this transition is being induced by price signals: interest rates offered on new or existing deposit products which are deemed to be more stable are rising relative to interest rates on products deemed to be less stable.
These types of changes appear to have accelerated recently as we draw closer to the implementation of the LCR and probably still have some way to run. To date, we have seen only a few banks offer notice of withdrawal accounts to customers. These accounts require the depositor to provide the bank with 31 days or more notice of a withdrawal (obviously 31 days is one day longer than the 30-day liquidity stress period). Interest rates offered on these accounts are among the higher rates offered in the deposit market. It may be that we see a broader move to these types of accounts or changes in terms and conditions on existing accounts through the course of next year.
We have also seen a fall in the growth of term deposits relative to transaction and at-call deposits over the past few years. In fact term deposits as a share of banks’ funding has been falling while transaction and at-call deposits have been growing strongly. Part of this is because a flattening of the yield curve has made investors less inclined to invest in longer term deposits. But in part it is because under the LCR, some transactional and operational deposits are subject to lower run-off rates than deposits that are largely attracted by higher interest rates. Indeed, there has been some indication that banks have been transitioning depositors into deposit products treated more favourably under the LCR.
But banks are not limited to just changing their deposit offerings. We could see them look for more opportunities to package retail deposits with other products as the deposits of customers that also have other relationships with the bank are deemed to be more stable under the LCR.
So to conclude, the full implementation of the new liquidity regime in Australia is imminent. From the beginning of next year, banks in Australia will be fully subject to the Liquidity Coverage Ratio. This has already had an impact on the pricing and nature of a number of financial products, as well as the structure of bank liabilities. While the bulk of the impact may be behind us, there are still a number of changes in the pipeline, particularly around deposits.”

 So does this mean the risk of mortgage rate hikes have also abated from the majors?
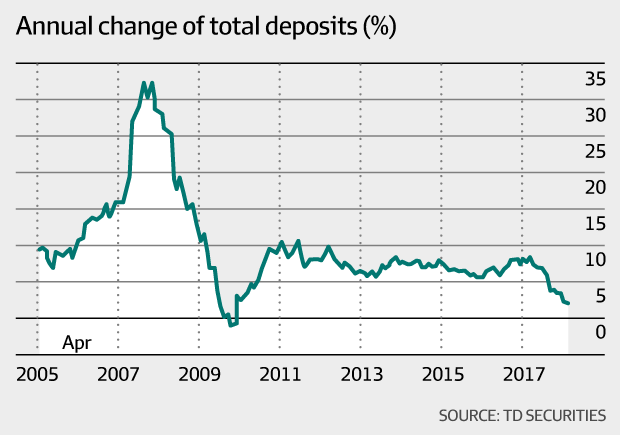 This additional funding is required to support continued mortgage loan growth.