ANZ partners with Data Republic to speed up innovation

ANZ has announced a strategic investment and partnership with local start-up Data Republic to speed up innovation through secure data-sharing environments.

The partnership will provide ANZ access to the Data Republic platform, which delivers a ‘data sharing control centre’ for organisations to store, categorise and share data while maintaining strict governance and auditing frameworks. ANZ will be able to use the platform to share data with trusted third parties in a secure and well-governed environment.

Announcing the partnership, ANZ Chief Data Officer Emma Gray said:

“Using data analytics and insights to deliver better customer outcomes more often is an essential part of how we need to operate in the digital economy.

“This partnership allows us to get more out of the data we already have, but in a safe and secure environment that provides the highest levels of governance.

“Through the cloud-based platform we will now be able to access trusted experts and other partners to develop useful insights for our customers in hours rather than months,” Ms Gray said.

Data Republic CEO Paul McCarney said: “We are very excited to welcome ANZ as both a strategic investor and technology client.

“ANZ clearly understand the importance of secured data sharing practices in today’s data-driven economy.

“This partnership is about ANZ investing in the right technology to future-proof their data collaboration capabilities and will ultimately position ANZ to overcome many of the challenges and potential risks associated with open data, data sharing and the Federal Government’s recently announced Open Banking reforms.”

ANZ will start using the Data Republic platform from late March to develop greater customer insights and a series of operational improvements.

Machine Learning, Analytics And Central Banking

The latest Bank Underground blog post “New Machines for The Old Lady”,  explores the power of machine learning and advanced analytics.

Rapid advances in analytical modelling and information processing capabilities, particularly in machine learning (ML) and artificial intelligence (AI), combined with ever more granular data are currently transforming many aspects of everyday life and work. In this blog post we give a brief overview of basic concepts of ML and potential applications at central banks based on our research. We demonstrate how an artificial neural network (NN) can be used for inflation forecasting which lies at the heart of modern central banking.   We show how its structure can help to understand model reactions. The NN generally outperforms more conventional models. However, it struggles to cope with the unseen post-crises situation which highlights the care needed when considering new modelling approaches.

Similarly to the victory of DeepBlue over chess world champion Garry Kasparov in 1997, the 2017 victory of AlphaGo over Go world champion Ke Jie is seen as a hallmark of the advancements of machine intelligence. Both victories were made possible by rapid advancements of information technologies, however in different ways. For DeepBlue, it was improvements in computer memory and processing speed. But for AlphaGo, it was the ability to learn from and make decisions based on rich data sources, flexible models and clever algorithms.

Recent years have seen an explosion in the amount and variety of digitally available data (“big data”). Examples are online activities, such as online retail and social media or from the usage of smartphone apps. Another novel source is the interaction of the gadgets themselves, e.g. data from a multitude of sensors and the connections of everyday devices to the internet (the “internet of things”).

Monetary policy decisions, the supervision of financial institutions and the gauging of financial market conditions – the common tasks of the Bank of England and many other central banks – are certainly data-driven activities. However, these have traditionally been fuelled by relatively “small data”, often in the form of monthly or quarterly time series. This also changed in recent years, partly driven by reforms following the Global Financial Crisis 2008 (GFC), which handed central banks and regulators with additional powers, responsibilities and more data. These novel data sources and analytical techniques provide central banks, and also the economics profession more widely, with new opportunities to gain insights and ultimately promote the public good.

What is machine learning?

ML is a branch of applied statistics largely originating from computer science. It combines elements of statistical modelling, pattern recognitions and algorithm design. Its name can be interpreted as designing systems for automated or assisted decision making, but not (yet) autonomous robots in most cases. Hence, ML is not a fixed model or technique, but rather an analytical toolbox for data analysis, which can be used to tailor solutions for particular problems.

The main difference between ML and conventional statistical analysis used in economic and financial studies (often summarised under the umbrella of econometrics) is its larger focus on prediction compared to causal inference. Because of this, machine learning models are not evaluated on the basis of statistical tests, but on their out-of-sample prediction performance, i.e., how the model describes situations it hasn’t seen before. A drawback of this approach is that one may struggle to explain why a model is doing what it does, commonly known as the black box criticism.

The general data-driven problem consists of a question and a related dataset. For example, “What best describes inflation given a set of macroeconomic time series?” This can be framed as a so-called supervised problem in ML terminology. Here, we are trying to model a concrete output or target variable Y (inflation), given some input variables X.  These supervised problems can be further segmented into regression and classification problems. The regression problem involves a continuous target variable, such as the value of inflation over a certain period of time. Classification, in the other hand, involves discrete targets, e.g. if inflation is below or above target at certain point in time, or if a bank is in distress or not. Alongside this, there is also unsupervised machine learning where no such labelled target variable Y exists. In this case, any ML approach would try to uncover an underlying clustering structure or relationships within data. These main categories of machine learning problems are shown in Figure 1. We discuss a case study for all three problem types in SWP 674: Machine learning at central banks. Case study 3 on analysis tech start-ups with a focus on financial technology (fintech) is also reviewed in this post.

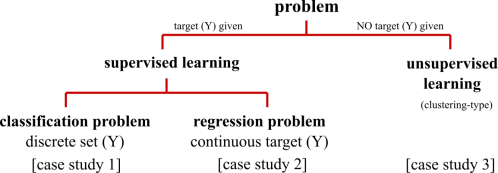
Figure 1: Machine learning taxonomy. Case studies refer to SWP 674: Machine learning at central banks.

Case study: UK CPI inflation forecasting

As a simple example, we feed a set of macroeconomic time series (e.g. the unemployment rate or rate of money creation) into an artificial neural network to forecast UK CPI inflation over a medium-term horizon of two years and compare its performance to a vector autoregressive model with one lag (VAR). It is worth noting that this is not how central banks typically forecast inflation but it works well to see how ML techniques can be used.

An important aspect to consider here is that many ML approaches do not take time into account, meaning that they mostly focus on so-called cross sectional analyses. ML approaches which do take time into account are, among others, online learning or reinforcement learning. These approaches would need considerably more data than are available for our coarse-grained time series. We therefore take a different approach building temporal dependencies implicitly into our models. Namely, we match pattern in a lead-lag setting where changes in consumer prices lead changes or levels of other aggregates by two years. The contemporaneous 2-year changes of input variables and CPI target are shown in Figure 2, with the exception of the Bank rate, implied inflation from indexed Gilts and the unemployment level which are in levels. One can see that the crisis in the end of 2008 (vertical dashed line) represents a break for may series.

Figure 2: Selection of macroeconomic time series used as inputs and target of NN.

A key element of machine learning is training, i.e. fitting, and testing a model on different parts of a dataset. The reason for this is the mentioned absence of general statistical tests in many situations. The difference between training and test performance indicates then how well a model generalises to unseen situations. In the current setting this is performed within an expanding window setting where we successively fit the model on past data, evaluate its performance based on an unconditional forecast and then expand the training dataset by a quarter.

The result of this exercise is given in Figure 3, which shows the model output of a neural network (NN) with two hidden layers, technically a deep multi-layered perceptron.  This is a multi-stage model which combines weighted input data in successive layers and map these to a target variable (supervised learning). They are also at the forefront of recent AI developments. The NN model (green) in this unconditional forecast has an average annualised absolute error below half a percentage point over a two-year horizon during the pre-GFC period. This is already more than twice as accurate as the simple vector-autoregressive (VAR) benchmark model with one lag (grey line in Figure 3). The NN also shows relatively low volatility in its output, contrasted to the VAR.

Figure 3: ML model performance of combination of a deep neural network and support vector machine (green) relative to UK CPI inflation (blue). Red prediction intervals (PI) are constructed from sampled input data. The GFC only impacts the models in 2010 because of 2-year lead-lag relation of all models. Source: SWP 674.

Looking into the black box

ML models, particularly deep neural networks, are often criticised for being hard to understand in terms of their input-output relations. We can, however, get a basic understanding of the model in the current case as it is relatively simple. The model performance in Figure 3 drops markedly as soon as the effects from the GFC enter the model (vertical red dashed line), forecasting inflation persistently too low.

This behaviour can be understood when looking at the NN input structure before and after the GFC. Figure 4 depicts the relative weights stemming from different variables entering the first hidden layer of the neural network for pre and post-crisis data. This part of the NN has been identified to contribute the leading signal of the model’s output.  We see that changes in private sector debt and gross disposable household income (GDHI) provided the strongest signal in the pre-crisis period, as seen by the darker shades of normalised inputs. Particularly, the former saw a sharp drop at the onset of the crisis. Post-crisis, model weights gradually gave more importance to the increased level of unemployment. Both factors can explain why the neural network – wrongly in this case – predicted a sharp drop in inflation (see Figure 2).

The above discussion can best be thought of as a statistical decomposition. Artificial neural networks, like other machine learning approaches, are non-structural models focusing on correlations in the data. Therefore, care has to be given when interpreting the results of such an analysis. A strong correlation may or may not point to a causal relationship. Further analyses may be needed to pinpoint such a relation.

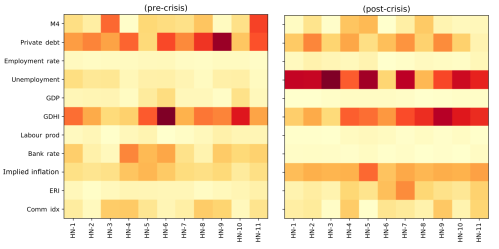
Figure 4: Pre and post crisis input weight structure to first (hidden) layer of neural network from macroeconomic time series inputs. Darker values indicate a stronger signal. Source: SWP 674.

Conclusion

We have given a very brief introduction of machine learning techniques and demonstrated how they might be used for tasks which central banks have been trusted with. Many of these tasks are linked to the availability of ever more granular data. Here, their particular strength lies in the modelling of non-linearities and accurate prediction.

However, care is needed when interpreting the outputs from ML models. For example, they do not necessary identify economic causation. The fact that a correlation between two variables has been observed in the past does not mean it will hold in the future, as we have seen in the case of the artificial neural network when it is faced with a situation not previously seen in the data, resulting in forecasts wide of the mark.

Chiranjit Chakraborty and Andreas Joseph both work in the Bank’s Advanced Analytics Division.

Note: Bank Underground is a blog for Bank of England staff to share views that challenge – or support – prevailing policy orthodoxies. The views expressed here are those of the authors, and are not necessarily those of the Bank of England, or its policy committees.

The Need For Granularity

An interesting working paper from the IMF “Financial Stability Analysis: What are the Data Needs?” looks in detail at the information which is required to enable regulators to understand the dynamics and early warning signs of risks to financial stability. They argue we need to get granular, and think more about “micro-prudential”. Macro-prudential is not enough. In essence, they say that whilst aggregate data may paint an acceptable picture, it can mask significant pockets of risk which are only revealed by going granular. They also call out a wide range of data gaps, from shadow banking to capital flows.

The growing incidences of financial crises and their damage to the economy has led policy makers to sharpen the focus on financial stability analysis (FSA), crisis prevention and management over the past 10–15 years. The statistical world has reacted with a number of initiatives, but does more need to be done? Taking a holistic view, based on a review of experiences of policy makers and analysts, this paper identifies common international threads in the data needed for FSA and suggests ways to address these.

While there has been an encouragingly constructive response by statisticians, not least through the G-20 Data Gaps Initiative, more work is needed, including with regard to shadow banking, capital flows, corporate borrowing, and granular data. Further, to support FSA, the paper identifies potential enhancements to the conceptual advice in statistical manuals including with regard to foreign currency and remaining maturity.

Specifically, they highlight the need to understand, at a granular level the debt profile of households and companies.  We agree especially as we have significant data gaps in the Australian context, with regulators relying on relatively high-level, myopic and out of data information.  Worse still many banks themselves do not have the granularity they need, so even if regulators asked for more precision, it would not be forthcoming. And confidentiality is an often used shibboleth.

Time to get granular!

To meet the need for increased availability of granular data not only could the collection of more granular data be considered but more use could be made of existing micro data (data that are collected for supervisory or micro-prudential purposes).

Other initiatives to strengthen financial institutions’ risk reporting practices include data reporting requirements arising from the implementation of Basel III and the Solvency II rules; the development of recovery and resolution plans by national banking groups; and the efforts to enhance international financial reporting standards. In addition to contributing to financial institutions’ own risk managements, the improvements in regulatory reporting can contribute to the quality of the more aggregate macro-prudential data for the assessment of system-wide financial stability risks at the national, regional, and international levels.

However, the use of micro data for macro financial assessment has its challenges, the most important being the strict confidentiality requirements associated with the use of micro data. Such requirements typically limit data sharing among statistical and supervisory agencies, and with users. But also granular information brings data quality and consistency issues that need to be dealt with to be able to draw appropriate conclusions for macro-prudential analysis. Tissot points out the importance of being able to aggregate micro information so it can be analyzed, and communicated to policy makers while on the other hand the “macro” picture on its own can be misleading, as it may mask micro fragilities that have system-wide implications.

Macro-stress testing is a key tool to assess the resilience of financial institutions and sectors to shocks and would benefit from more detailed information particularly for the top-down stress tests.

Another area where better data are needed to assess financial stability risks is related to the monitoring of the household sector. Such data include comprehensive information on the composition of assets and liabilities, and household income and debt service payments. Further, the growing interest of policy makers in the inequality gap (i.e., of consumption, saving, income and wealth) has led to a demand for distributional information.

Note: IMF Working Papers describe research in progress by the author(s) and are published to elicit comments and to encourage debate. The views expressed in IMF Working Papers are those of the author(s) and do not necessarily represent the views of the IMF, its Executive Board, or IMF management.

Analytics in banking: Time to realize the value

An excellent article from McKinsey (I may be biased, but analytics used right are very very powerful!).

More than 90 percent of the top 50 banks around the world are using advanced analytics. Most are having one-off successes but can’t scale up. Nonetheless, some leaders are emerging. Such banks invest in talent through graduate programs. They partner with firms that specialize in analytics and have committed themselves to making strategic investments to bolster their analytics capabilities. Within a couple of years, these leaders may be able develop a critical advantage. Where they go, others must follow—and the sooner the better because success will come, more than anything else, from real-world experience.

By establishing analytics as a true business discipline, banks can grasp the enormous potential. Consider three recent examples of the power of analytics in banking:

  • To counter a shrinking customer base, a European bank tried a number of retention techniques focusing on inactive customers, but without significant results. Then it turned to machine-learning algorithms that predict which currently active customers are likely to reduce their business with the bank. This new understanding gave rise to a targeted campaign that reduced churn by 15 percent.
  • A US bank used machine learning to study the discounts its private bankers were offering to customers. Bankers claimed that they offered them only to valuable ones and more than made up for them with other, high-margin business. The analytics showed something different: patterns of unnecessary discounts that could easily be corrected. After the unit adopted the changes, revenues rose by 8 percent within a few months.
  • A top consumer bank in Asia enjoyed a large market share but lagged behind its competitors in products per customer. It used advanced analytics to explore several sets of big data: customer demographics and key characteristics, products held, credit-card statements, transaction and point-of-sale data, online and mobile transfers and payments, and credit-bureau data. The bank discovered unsuspected similarities that allowed it to define 15,000 microsegments in its customer base. It then built a next-product-to-buy model that increased the likelihood to buy three times over.

Three ways advanced analytics can generate an increase in profits.

Results like these are the good news about analytics. But they are also the bad news. While many such projects generate eye-popping returns on investment, banks find it difficult to scale them up; the financial impact from even several great analytics efforts is often insignificant for the enterprise P&L. Some executives are even concluding that while analytics may be a welcome addition to certain activities, the difficulties in scaling it up mean that, at best, it will be only a sideline to the traditional businesses of financing, investments, and transactions and payments.

In our view, that’s shortsighted. Analytics can involve much more than just a set of discrete projects. If banks put their considerable strategic and organizational muscle into analytics, it can and should become a true business discipline. Business leaders today may only faintly remember what banking was like before marketing and sales, for example, became a business discipline, sometime in the 1970s. They can more easily recall the days when information technology was just six guys in the basement with an IBM mainframe. A look around banks today—at all the businesses and processes powered by extraordinary IT—is a strong reminder of the way a new discipline can radically reshape the old patterns of work. Analytics has that potential.

Tactically, we see banks making unforced errors such as these:

  • not quantifying the potential of analytics at a detailed level
  • not engaging business leaders early and to develop models that really solve their problems and that they trust and will use—not a “black box”
  • falling into the “pilot trap”: continually trying new experiments but not following through by fully industrializing and adopting them
  • investing too much up front in data infrastructure and data quality, without a clear view of the planned use or the expected returns
  • not seeking cooperation from businesses that protect rather than share their data
  • undershooting the potential—some banks just put a technical infrastructure in place and hire some data scientists, and then execute analytics on a project-by-project basis
  • not asking the right questions, so algorithms don’t deliver actionable insights