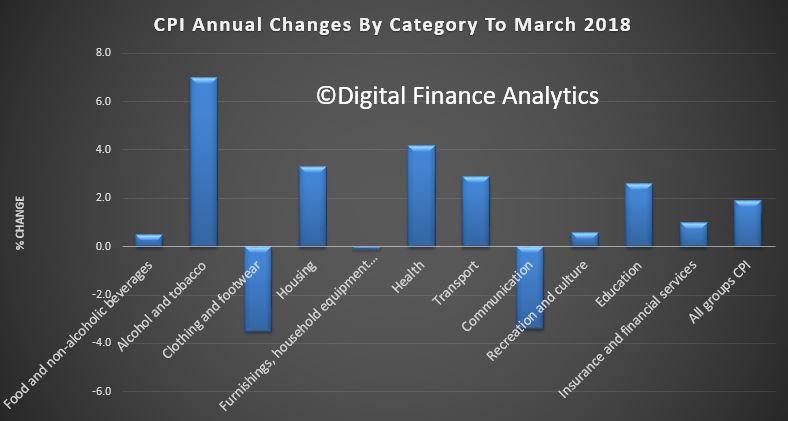
The latest ABS data, out today shows that the Consumer Price Index (CPI) rose 0.4 per cent in the March quarter 2018, the latest Australian Bureau of Statistics (ABS) figures reveal. This follows a rise of 0.6 per cent in the December quarter 2017.
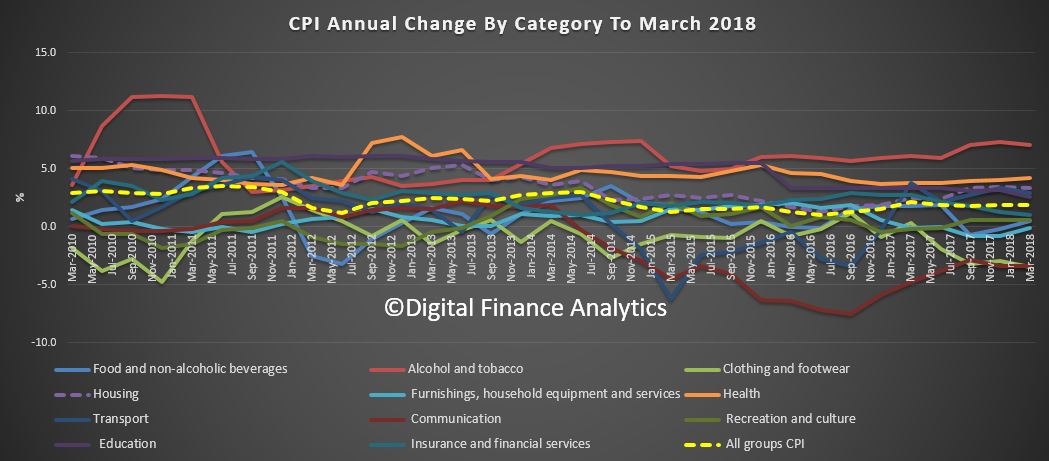
The CPI rose 1.9 per cent through the year to the March quarter 2018 having increased 1.9 per cent through the year to the December quarter 2017. Housing was more than 3% over the past year and health costs more than 4%.
The most significant price rises this quarter are secondary education (+3.3%), gas and other household fuels (+6.0%), pharmaceutical products (+5.6%), vegetables (+3.7%) and medical and hospital services (+1.5%). These price rises were partially offset by falls in international holiday travel and accommodation (-2.4%), audio, visual and computing media and services (-6.1%) and furniture (-2.8%).
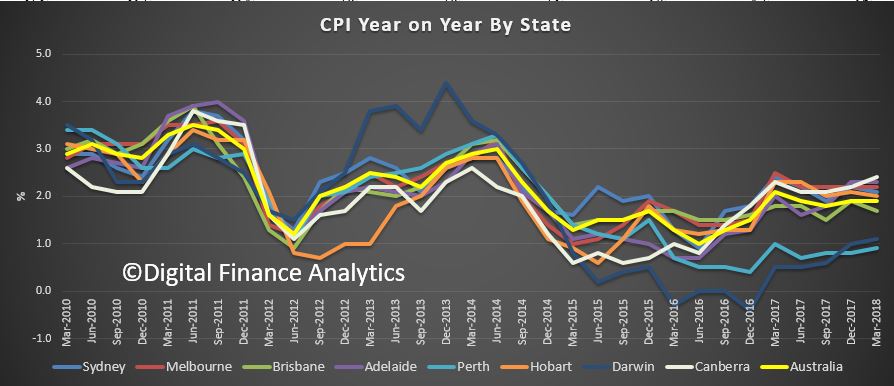
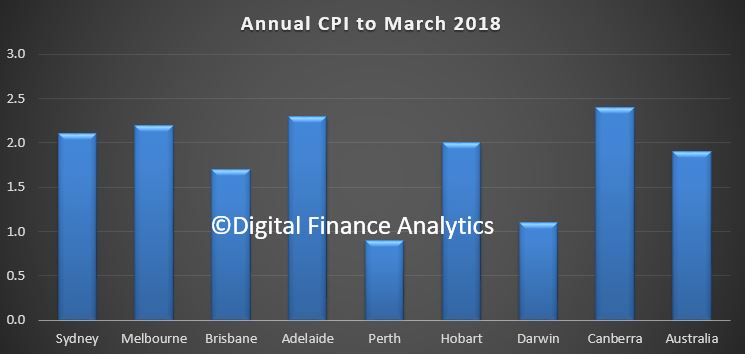
Looking across the states, the 1.9% average masks significant variations, with Sydney and Melbourne above 2% and Canberra 2.4%.
For the March quarter 2018, the All Groups annual percentage change of the Weighted Average of the Eight Capital Cities is +1.9 per cent. Sydney rose 2.1 per cent, Melbourne rose 2.2 per cent, Brisbane rose 1.7 per cent, Adelaide rose 2.3 per cent, Perth rose 0.9 per cent, Hobart rose 2.0 per cent, Darwin rose 1.1 per cent, and Canberra rose 2.4 per cent.
We think “real life” prices increases are significantly higher, due to the impact of housing and health costs in particular.
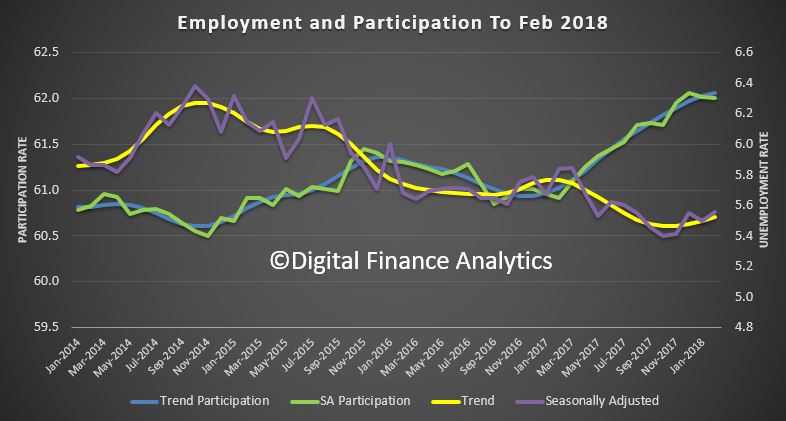
The trend unemployment rate increased slightly to 5.6 per cent in March 2018. The trend participation rate increased to a record high of 65.7 per cent in March 2018.
“The labour force participation rate now sits at 65.7 per cent, the highest it has been since the series began in 1978, indicating that the population is participating in the labour market at a record high level,” the Chief Economist for the ABS, Bruce Hockman, said.
In line with the increasing participation rate, employment increased by around 14,000 persons. Part-time employment increased by 13,000 persons and full-time employment by 1,000 persons, reflecting a slowing in full-time employment growth.
Over the past year, trend employment increased by 3.1 per cent, which was above the average year-on-year growth over the past 20 years (1.9 per cent).
The trend monthly hours worked increased by 0.2 million hours (0.01 per cent), with the annual figure sitting at 2.6 per cent. The trend unemployment rate increased slightly to 5.6 per cent in March 2018.
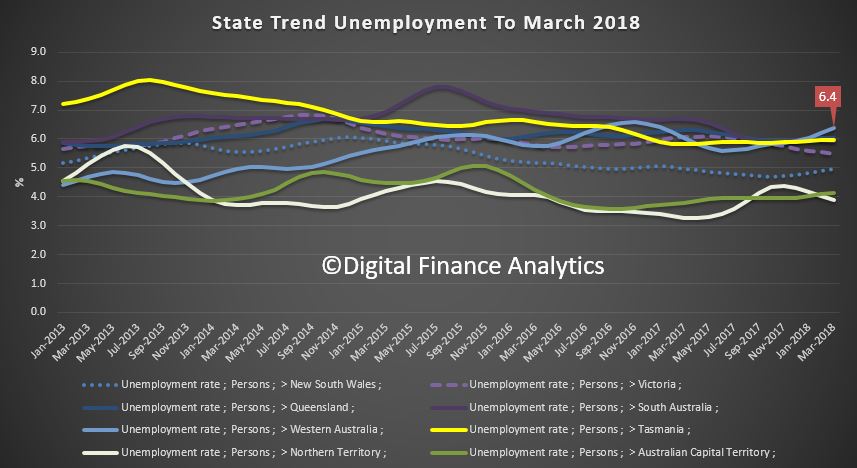
“The unemployment rate has continued to be relatively constrained over the past year, and is still hovering around 5.5 to 5.7 per cent”, Mr Hockman said. Over the past year, the states and territories with the strongest annual growth in trend employment were Queensland (4.3 per cent), the ACT (3.9 per cent), and New South Wales (3.6 per cent).
WA has the highest, and still rising trend employment rate at 6.4%
The seasonally adjusted number of persons employed increased by 5,000 in March 2018. The seasonally adjusted unemployment rate remained at 5.5 per cent after the February number was revised down, and the seasonally adjusted labour force participation rate decreased slightly to 65.5 per cent.
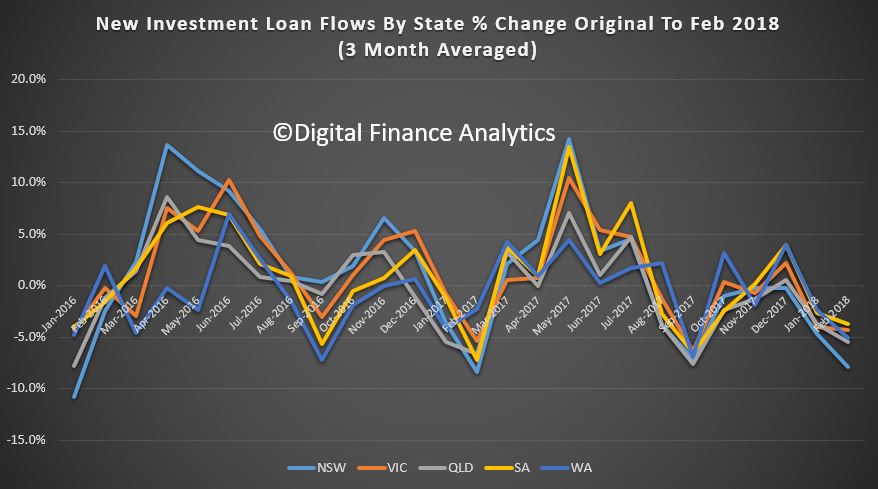
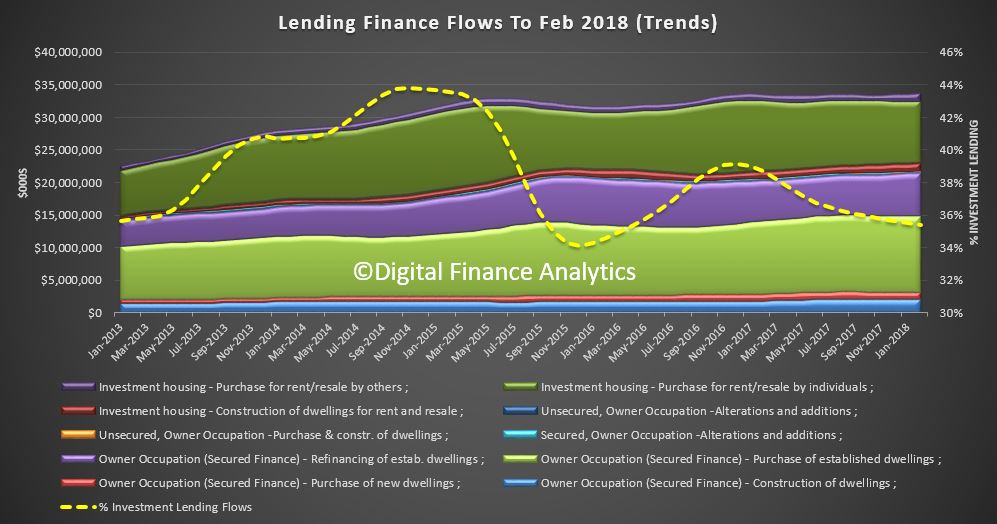
To start at the end of the story, we see significant falls across most states in investment lending flows, with the most significant falls in the Sydney market.
The share of investment flows continues to drift lower, to around 35%. But that is still substantial investment lending!
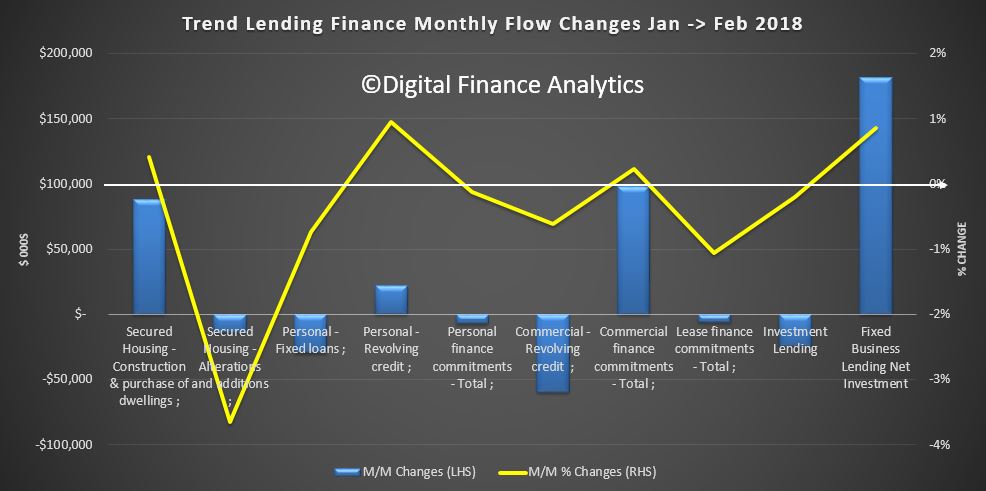
More broadly, the monthly changes from January to February shows the total value of owner occupied housing commitments excluding alterations and additions rose 0.4% in trend terms.
The trend value of total personal finance commitments fell 0.1%. Fixed lending commitments fell 0.7%, while revolving credit commitments rose 1.0%.
The trend value of total commercial finance commitments rose 0.2%. Fixed lending commitments rose 0.5%, while revolving credit commitments fell 0.6%. Within that investment loan flows fell just a little.
The trend series for the value of total lease finance commitments fell 1.1% in February 2018.
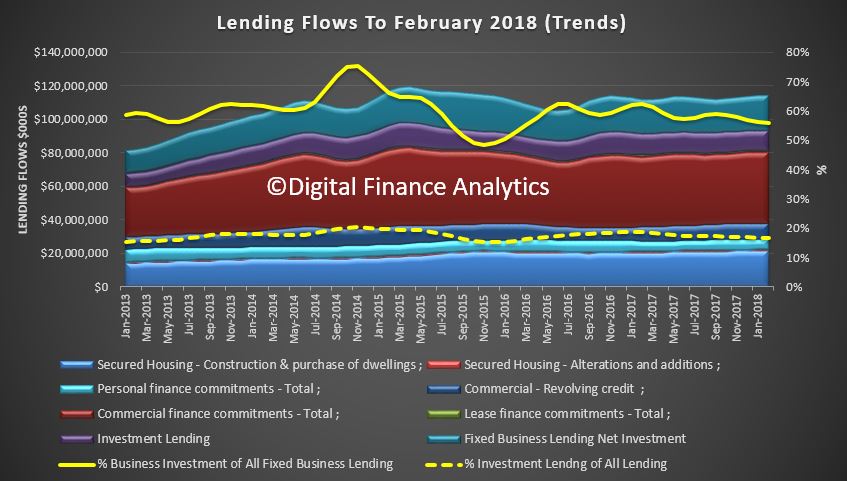
Finally, the percentage of investment lending of all lending flows is below 20%, and shows a small fall. But we also see a fall in business lending to around 55%, excluding investment property lending.
Welcome to the Property Imperative Weekly to 14 April 2018. We review the latest property and finance news.
There is a massive amount to cover in this week’s review of property and finance news, so we will dive straight in.
CoreLogic says that final auction results for last week showed that 1,839 residential homes were taken to auction with a 62.8 per cent final auction clearance rate, down from 64.8 per cent over the previous week. Auction volumes rose across Melbourne with 723 auctions held and 68.2 per cent selling. There were a total of 795 Sydney auctions last week, but the higher volumes saw the final clearance rate weaken with 62.9 per cent of auctions successful, down on the 67.9 per cent the week prior. All of the remaining auction markets saw a rise in activity last week; clearance rates however returned varied results week-on-week, with Adelaide Brisbane and Perth showing an improvement across the higher volumes while Canberra and Tasmania both recorded lower clearance rates. Across the non-capital city regions, the highest clearance rate was recorded across the Hunter region, with 72.5 per cent of the 45 auctions successful.
This week, CoreLogic is currently tracking 1,690 capital city auctions and as usual, Melbourne and Sydney are the two busiest capital city auction markets, with 795 and 678 homes scheduled to go to auction. Auction activity is expected to be lower week-on week across each of the smaller auction markets
Two points to make. First is a slowing market, more homes will be sold privately, rather than via auctions, and this is clearly happening now, and second, we discussed in detail the vagaries of the auction clearance reporting in our separate blog, so check that out if you want to understand more about how reliable these figures are.
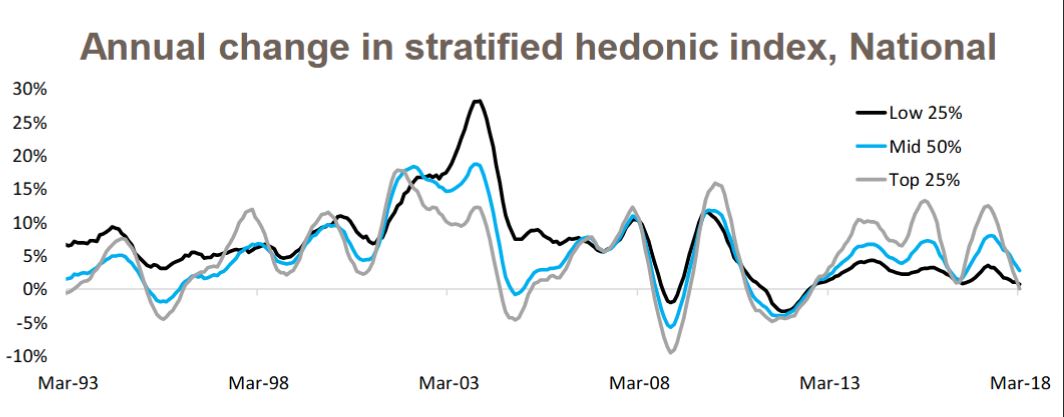
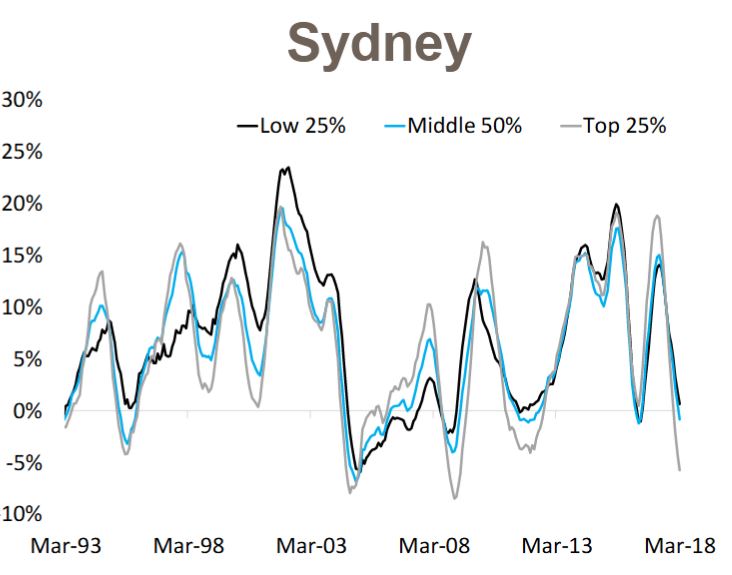
Home prices slipped a little this past week according to the CoreLogic index, but their analysis also confirmed what we are seeing, namely that more expensive properties are falling the most. In fact, values in the most expensive 25% of the property market are falling the fastest, whereas values for the most affordable 25% have actually risen in value.
Their analysis shows that over the March 2018 quarter, national data shows that dwelling values were down by 0.5%, however digging below the surface reveals the modest fall in values was confined to the most expensive quarter of the market. The most affordable properties increased in value by +0.7% compared to a +0.3% increase across the middle market and a -1.1% decline across the most expensive properties.
But looking at the details by location, in Sydney, over the past 12 months, the most expensive properties have recorded the largest value falls (-5.7%) followed by the middle market (-0.9%) and the most affordable market managed some moderate growth (+0.6%).
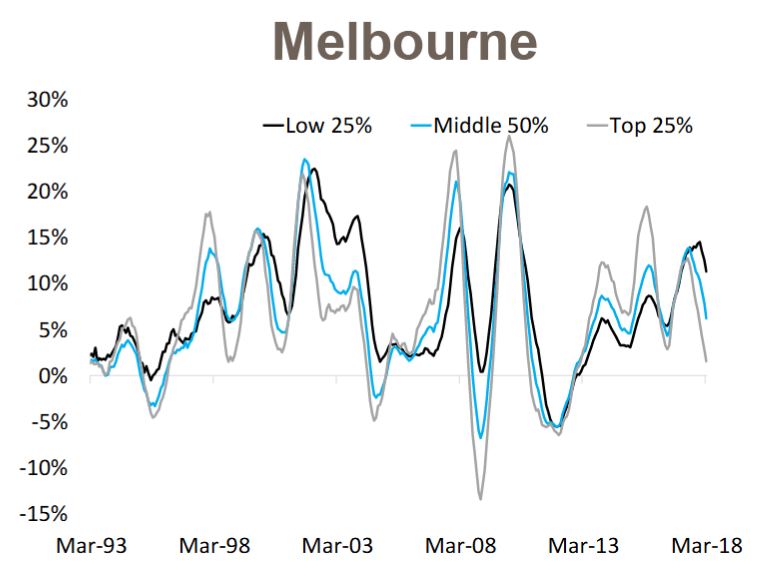
Compare that with Melbourne where values have increased over the past year across each segment of the market, with the most moderate increases recorded across the most expensive segment (+1.6%), then the middle 50% (+6.2%) while the most affordable suburbs have recorded double-digit growth (+11.3%)
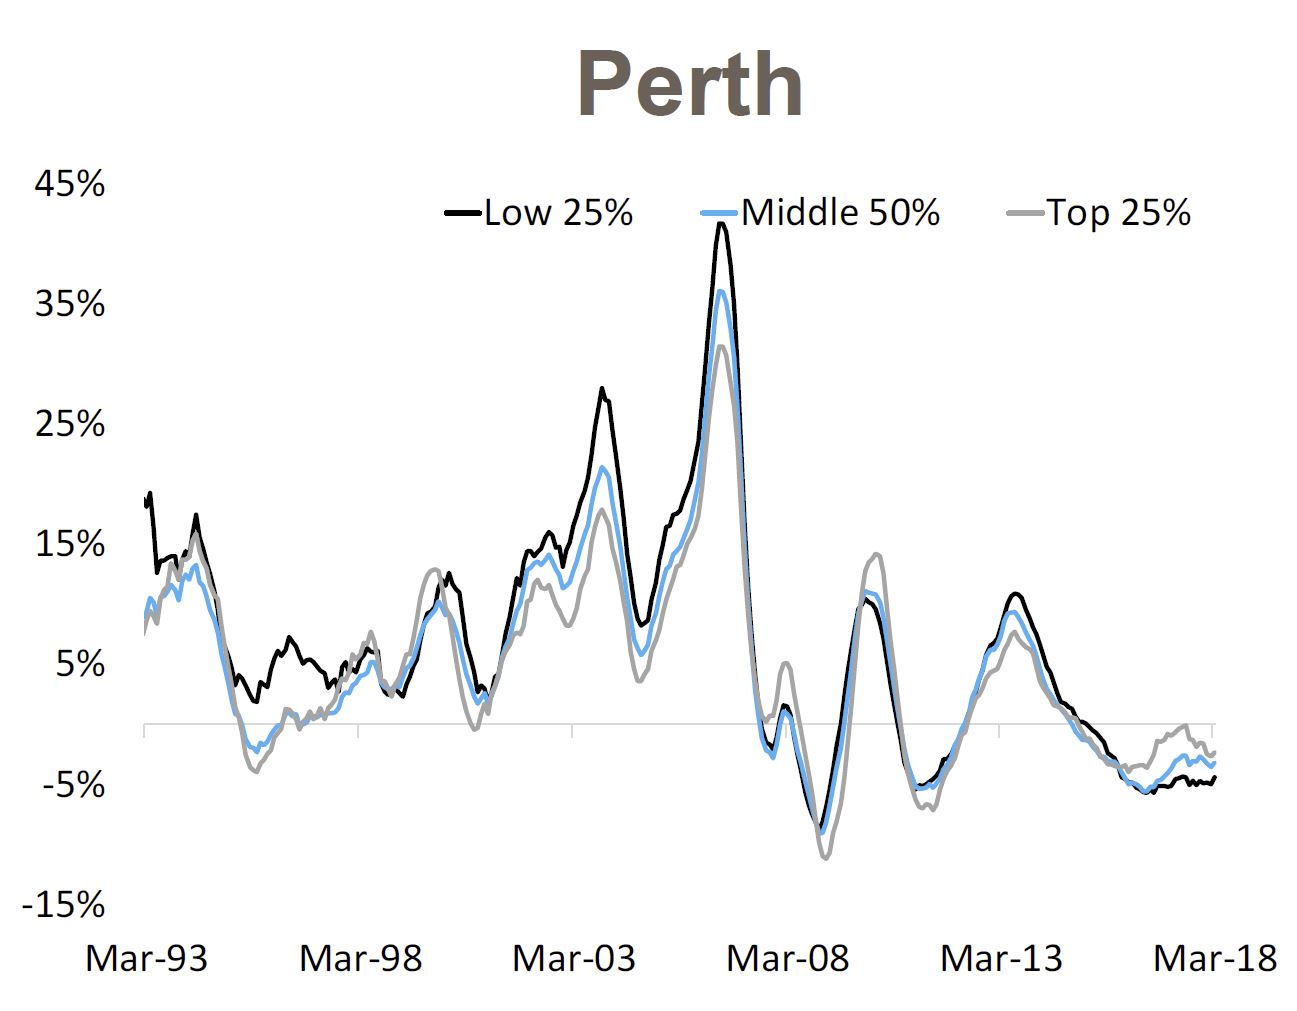
Finally, in Perth values have fallen over the past year across each market sector with the largest declines across the most affordable properties (-4.4%) followed by the middle market (-3.2%) with the most expensive properties recording the most moderate value falls (-2.4%).
This shows the importance of granular information, and how misleading overall averages can be.
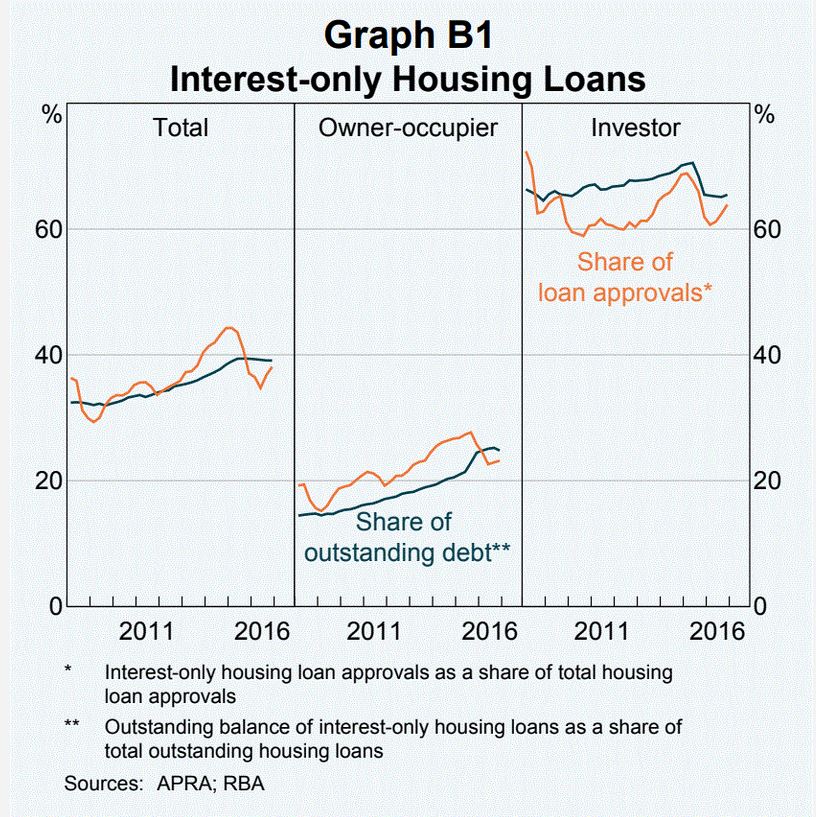
The RBA has released their Financial Stability Review today. It is worth reading the 70 odd pages as it gives a comprehensive picture of the current state of play, though through the Central Bank’s rose-tinted spectacles! They do talk about the risks of high household debt, and warn of the impact of rising interest rates ahead. They home in on the say $480 billion interest only mortgage loans due for reset over the over the next four years, which is around 30 per cent of outstanding loans. Resets to principal and interest will lift repayments by at least 30%. Some borrowers will be forced to sell.
This scenario mirrors the roll over of adjustable rate home loans in the United States which triggered the 2008 sub-prime mortgage crisis. Perhaps this is our own version! We have previously estimated more than $100 billion in these loans would now fail current tighter underwriting standards.
I published a more comprehensive review of the Financial Stability Review, and you can watch the video on this report. Importantly the RBA suggests that banks broke the rules in their lending on interest only loans before changes were made to regulation in 2014. The RBA says that there is the potential that these will result in banks having to set aside provisions and/or face penalties for past misconduct or perhaps (more notably) being constrained in the operation of parts of their businesses.
We also did a video on the RBA Chart pack which was released recently. Household consumption is still higher than disposable income, and the gap is being filled by the falling savings ratio. So, we are still spending, but raiding our savings to do so. Which of course is not sustainable. Now the other route to fund consumption is debt, so there should be no surprise to see that total household debt rose again (note this is adjusted thanks to changes in the ABS data relating to superannuation, we have previously breached the 200% mark). But on the same chart we see home prices are now falling – already the biggest fall since the GFC in 2007.
We see all the signs of issues ahead, with household debt still rising, household consumption relying on debt and savings, and overall growth still over reliant on the poor old household sector. We need a proper plan B, where investment is channelled into productive growth investments, not just more housing loans. Yet regulators and government appear to rely on this sector to make the numbers work – but it is, in my view, lipstick on a pig!
Another important report came out from The Bank for International Settlements, the “Central Bankers Banker” has just released an interesting, and concerning report with the catchy title of “Financial spillovers, spillbacks, and the scope for international macroprudential policy coordination“. But in its 53 pages of “dry banker speak” there are some important facts which shows just how much of the global financial system is now interconnected. They start by making the point that over the past three decades, and despite a slowdown coinciding with the global financial crisis (GFC) of 2007–09, the degree of international financial integration has increased relentlessly. In fact the rapid pace of financial globalisation over the past decades has also been reflected in an over sixfold increase in the external assets and liabilities of nations as a share of GDP – despite a marked slowdown in the growth of cross-border positions in the immediate aftermath of the GFC. My own take is that we have been sleepwalking into a scenario where large capital flows and international financial players operating cross borders, negating the effectiveness of local macroeconomic measures, to their own ends. This new world is one where large global players end up with more power to influence outcomes than governments. No wonder that they often march in step, in terms of seeking outcomes which benefit the financial system machine. You can watch our separate video discussion on this report. Somewhere along the road, we have lost the plot, but unless radical changes are made, the Genie cannot be put back into the bottle. This should concern us all.
And there was further evidence of the global connections in a piece from From The St. Louis Fed On The Economy Blog which discussed the decoupling of home ownership from home price rises. They say recent evidence indicates that the cost of buying a home has increased relative to renting in several of the world’s largest economies, but the share of people owning homes has decreased. This pattern is occurring even in countries with diverging interest rate policies. And the causes need to be identified. We think the answer is simple: the financialisation of property and the availability of credit at low rates explains the phenomenon.
And finally on the global economy, Vice-President of the Deutsche Bundesbank Prof. Claudia Buch spoke on “Have the main advanced economies become more resilient to real and financial shocks? and makes three telling points. First, favourable economic prospects may lead to an underestimation of risks to financial stability. Second resilience should be assessed against the ability of the financial system to deal with unexpected events. Third there is the risk of a roll back of reforms. The warning is clear, we are not prepared for the unexpected, and as we have been showing, the risks are rising.
Locally more bad bank behaviour surfaced this week. ASIC says it accepted an enforceable undertaking from Commonwealth Financial Planning Limited and BW Financial Advice Limited, both wholly owned subsidiaries of the Commonwealth Bank of Australia (CBA). ASIC found that CFPL and BWFA failed to provide, or failed to locate evidence regarding the provision of, annual reviews to approximately 31,500 ‘Ongoing Service’ customers in the period from July 2007 to June 2015 (for CFPL) and from November 2010 to June 2015 (for BWFA). They will pay a community benefit payment of $3 million in total. Cheap at half the price!
In similar vein, ASIC says it has accepted an enforceable undertaking from Australia and New Zealand Banking Group Limited (ANZ) after an investigation found that ANZ had failed to provide documented annual reviews to more than 10,000 ‘Prime Access’ customers in the period from 2006 to 2013. Again, they will pay a community benefit payment of $3 million in total.
Both these cases were where the banks took fees for services they did not deliver – and this once again highlight the cultural issues within the banks, were profit overrides good customer outcomes. We suspect we will hear more about poor cultural norms this coming week as the Royal Commission hearing recommence with a focus on financial planning and wealth management.
Finally to home lending. The ABS released their February 2018 housing finance data. Where possible we track the trend data series, as it irons out some of the bumps along the way. The bottom line is investor as still active but at a slower rate. Some are suggesting there is evidence of stabilisation, but we do not see that in our surveys. Owner occupied loans, especially refinancing is growing quite fast – as lenders seek out lower risk refinance customers with attractive rates. First time buyers remain active, but comprise a small proportion of new loans as the effect of first owner grants pass, and lending standards tighten. You can watch our video on this.
But the final nail in the coffin was the announcement from Westpac of significantly tighten lending standards, with a forensic focus on household expenditure. They have updated their credit policies so borrower expenses will need to be captured at an “itemised and granular level” across 13 different categories and include expenses that will continue after settlement as well as debts with other institutions. They will also be insisting on documentary proof. Moreover, households will be required to certify their income and expenses is true. This cuts to the heart of the liar loans issue, as laid bare in the Royal Commission. That said, Despite the commission raising questions over whether the use of benchmarks is appropriate when assessing the suitability of a loan for a customer, the Westpac Group changes will still apply either the higher of the customer-declared expenses or the Household Expenditure Measure (HEM) for serviceability purposes. You can watch our separate video on this. Almost certainly other banks will follow and tighten their verification processes. This will put more downward pressure on lending multiples, and will lead to a drop in credit, with a follow on to put downward pressure on home prices.
We discussed this in an article which was published under my by-line in the Australian this week, where we argued that excess credit has caused the home price bubble, and as credit is reversed, home prices will fall.
Our central case is for a fall on average of 15-20% by the end of 2019, assuming no major international incidents. The outlook remains firmly on the downside in our view.
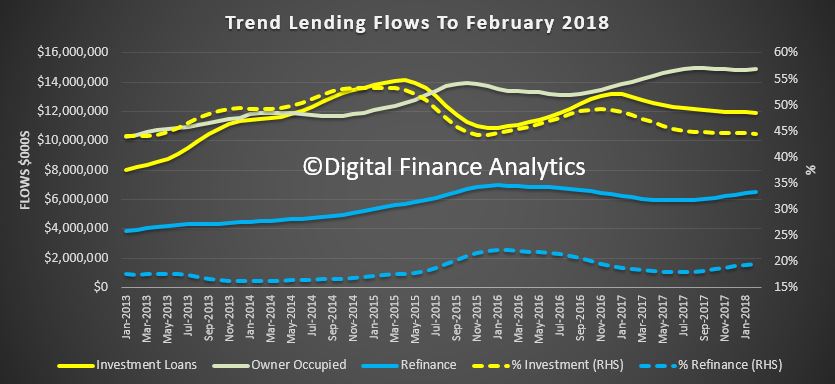
The ABS released their February 2018 housing finance data today. Where possible we track the trend data series, as it irons out some of the bumps along the way.
The flow of investment loans was worth $11.9 billion and down 0.2% from last month. Owner occupied loans rose 0.1% to $17.1 billion, while refinancing of existing loans rose 1.1% to $6.4 billion. So investment loans comprise 44.5% of loans, excluding refinanced, while refinanced loans were 19.5% of owner occupied loans.
Looking at the individual moving parts, we see owner occupied construction loans flows rose 0.2% by $4.6 million to 2.0 billion, and owner occupied purchase of new dwellings was down 0.1% to $1.2 billion. The purchase of other owner occupied dwellings was up 0.1% by $13.3 million to $11.6 billion. On the investment side of the ledger, investment construction fell 0.9%, down $11 million to $1.2 billion, while purchases by individuals for investment purposes down 0.6% or $60 million to $9.5 billion and purchases by other entities, for example super funds, rose 4% of $47 million to $1.2 billion.
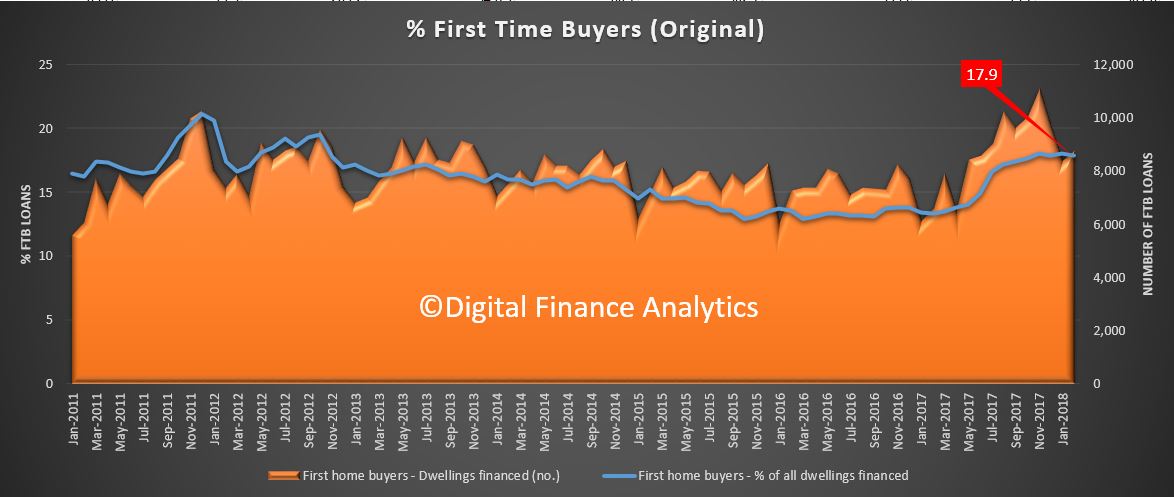
Looking at the original first time buyer data, there was a small fall this past month, to 17.9% of all loans as the volume of non first time buyers rose faster. However the upward move was a small one, and it appears the benefit of the new first time buyer incentives have abated. Tighter lending standards probably play in here also.
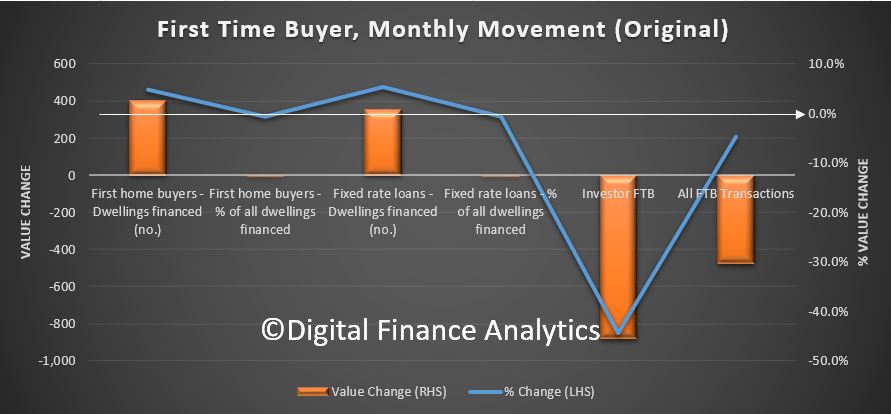
Here are the individual moving parts. There was a rise of 403 buyers, to 8,892, up 4.8%, compared to a 5.9% rise in non-first time buyer loans. The average loan size fell by 2.1%.
Using our survey data we also track first time buyers going to the investment market directly. We saw a further fall in momentum here as interest in investor loans wains.
Finally, the original loan stock data for banks (ADIs) shows that the share of investor loans fell to 34.1%, and was up by $590 million or 1.11% to $562 billion. Owner Occupied stock rose 0.63%, up $6.8 billion to $1.08 trillion.
So the bottom line is investor as still active but at a slower rate. Some are suggesting there is evidence of stabilisation, but we do not see that in our surveys.
Owner occupied loans, especially refinancing is growing quite fast – as lenders seek out lower risk refinance customers with attractive rates. First time buyers remain active, but comprise a small proportion of new loans as the effect of first owner grants pass, and lending standards tighten.
The ABS Residential Price Series also includes transaction data across the country, separated between houses, and other (described as attached). In some cases units may fall into the house bucket, according to the ABS supporting information, due to weaknesses in the data.
We are able to look at the transaction trends, across each state, and they show that to December 2017, the latest date of publication, the volume of settlements overall are significantly lower.
Here is the all Australia plot. The blue area shows the count of houses, the yellow area the volume of transfers for other than houses. We also plot the annualised growth rates. It shows apartment transfers are down more than 7%, and houses down 6.5% to December 2017.
Looking at the individual markets, Sydney both house and unit transfers are more than 8% down to December 2017.
Across the rest of NSW, house transfers are down 3.8% and unit transfers are down 5.8%.
Turning to Melbourne, still seen by many as the “leading market”, houses are down 7.8% and units and apartments, down 10.4% to December 2017.
Across the rest of the state, units were down 8.4% and houses down 7.1%.
So up to Brisbane, where both house and unit transfers have fallen by more than 7% to December 2017.
We can also see falls across the rest of the state, again looking at houses and unit transfers, both of which fell by more than 7%.
Next we go to South Australia. Here in this smaller, yet slightly more buoyant market units were up in Adelaide by 1.2%, whilst house transfers were down 2.8%.
Across the rest of SA, unit transfers were up 5.1% while houses were down 3.8%.
Then across to WA. Here of course property has been under pressure for some time, following a peak in 2009-10 and 2013. In Perth, unit transfers were down 1% and houses up 1.6%.
Across the rest of WA both unit and houses grew by 3.6% and 2.5% respectively.
In Tasmania, another “growth” state, transfers in Hobart were down 3.7% for units, and 7.7% for houses to December 2017
Beyond Hobart, across the rest of the state, house transfers were down 5.1% and units were down 6.9%.
In Darwin, unit transfers rose by 2%, while houses fell 4.7% to December 2017.
Across the rest of NT, unit transfers fell 6.8% and houses rose 2%
Finally, in Canberra, houses fell a significant 7.2% to December 2017, and units a massive 16.5%.
Standing back we see that units in particular have lost momentum, thanks to the lack of momentum in the investment sector, in particular. But more importantly, this data was set before the more recent lending tightening has hit, so expect to see more falls in transaction volumes ahead.
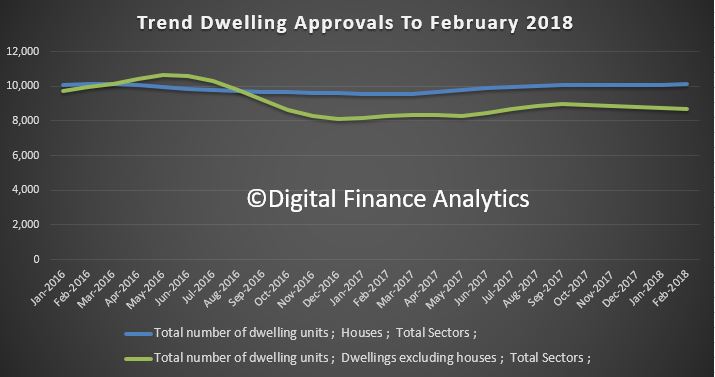
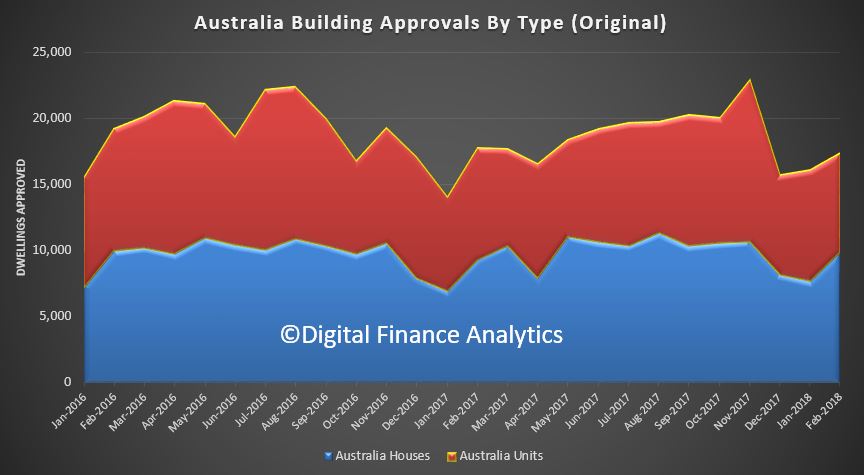
The number of dwellings approved in Australia fell for the fifth straight month in February 2018 in trend terms with a 0.1 per cent decline.
Approvals for private sector houses have remained stable at around 10,000 for a number of months. But unit approvals have fallen for five months.
Overall, building activity continues to slow from its record high in 2016. And the sizeable fall in the number of apartments and high density dwellings being approved comes at a time when a near record volume are currently under construction. If you assume 18-24 months between approval and completion, then we still have 150,000 or more units, mainly in the eastern urban centres to come on stream. More downward pressure on home prices.
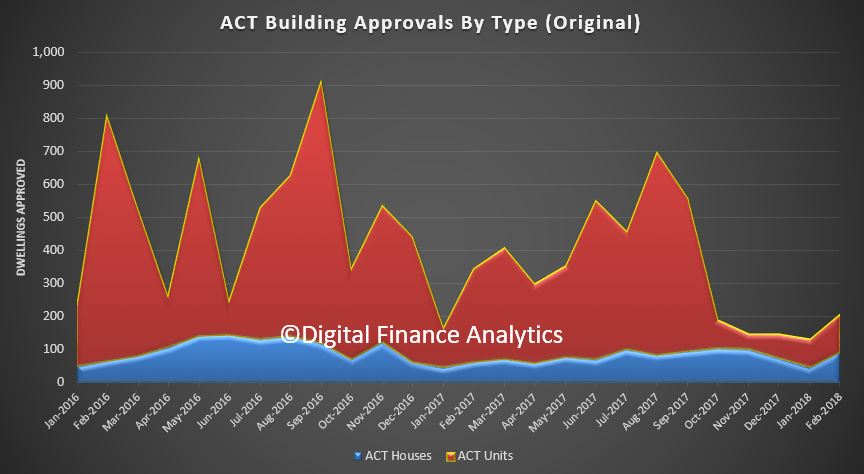
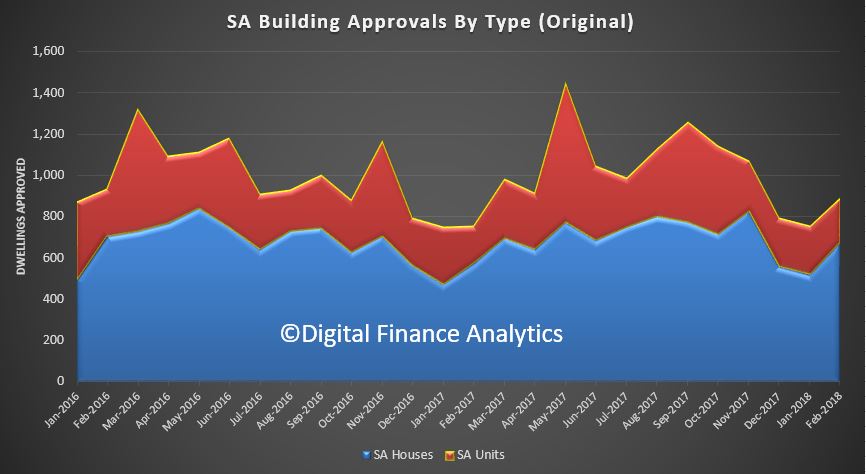
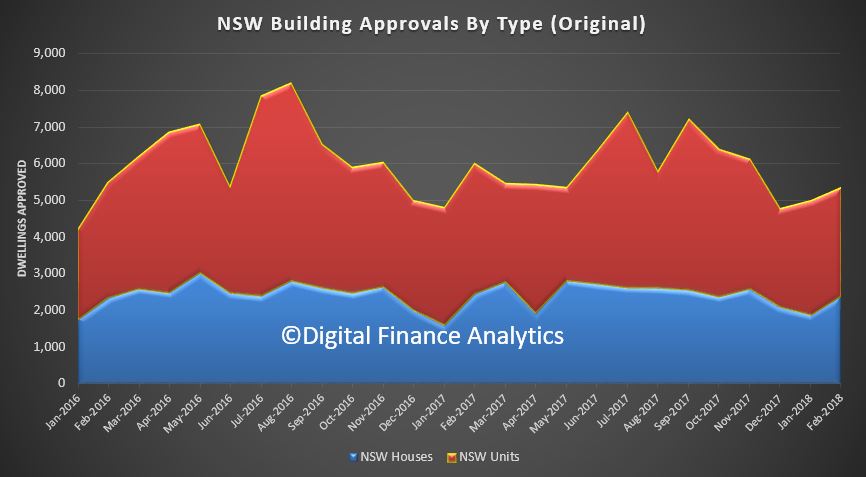
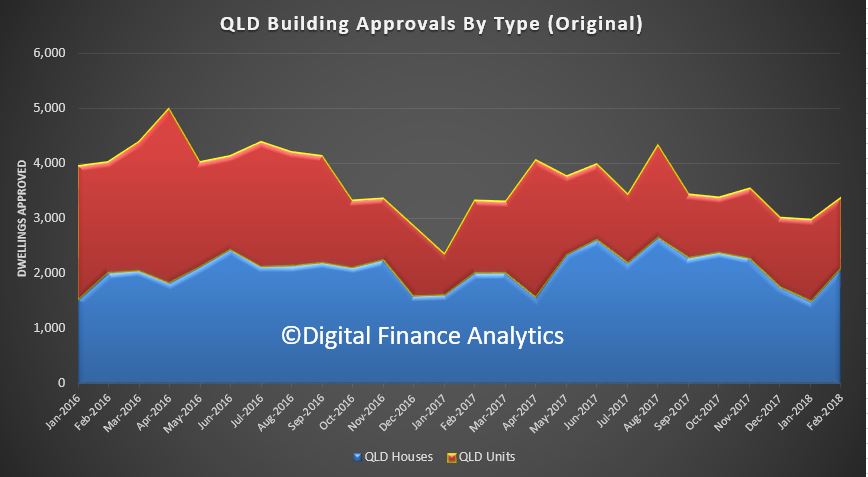
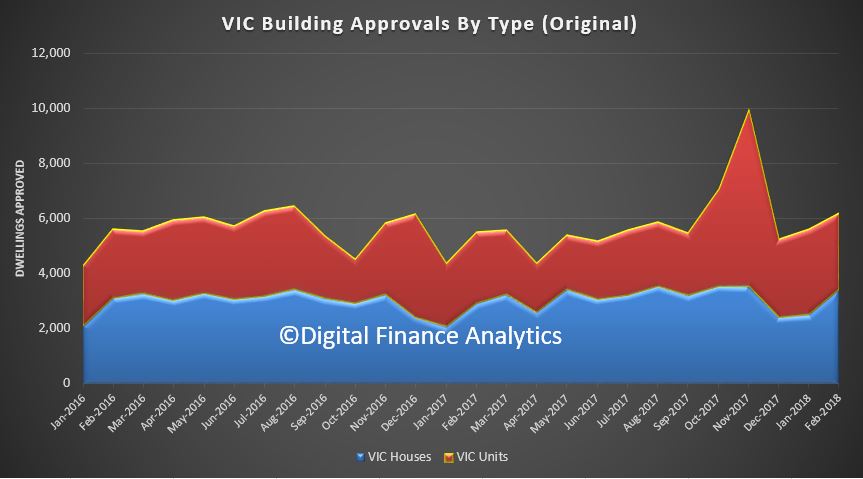
Here is the data displayed in original terms. Whilst house approvals remains relatively stable, unit approvals are more volatile. This is explained by the changing demand profile as overseas investors and local investment property purchasers retreat. As we discussed recently, this is thanks to tighter lending standards making mortgages more difficult to come by, lower capital growth making investment property less attractive, and stronger controls on overseas investors, both in terms of moving capital to purchase, and local regulations and tighter supervision.
We can then look across the individual states, as there are significant variations. Among the states and territories, the biggest trend decrease in dwelling approvals in February was the Australian Capital Territory down 18.7 per cent,
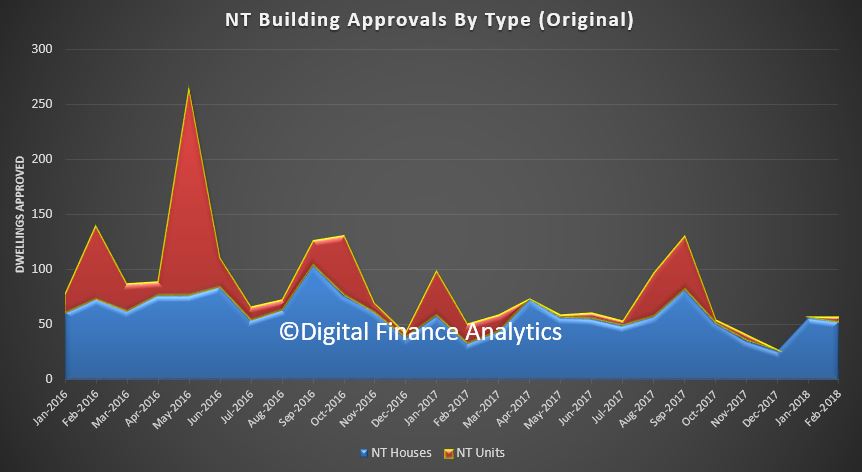
followed by the Northern Territory (down 7.2 per cent),
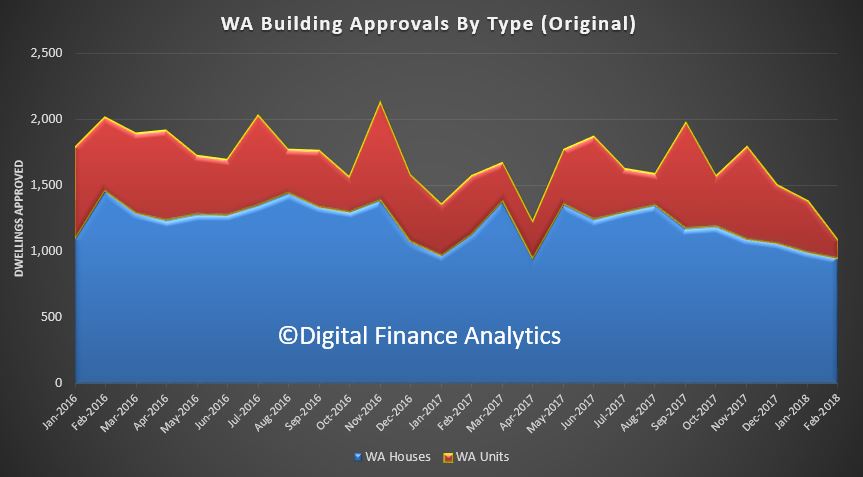
Western Australia (down 4.4 per cent),
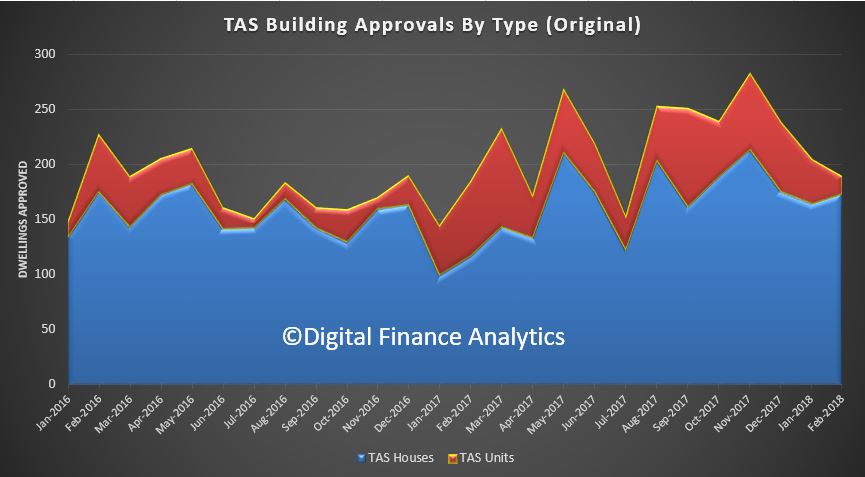
Tasmania (down 3.4 per cent)
and South Australia (down 1.2 per cent).
There were small increases in trend terms in New South Wales (1.0 per cent),
Queensland (0.9 per cent)
and Victoria (0.1 per cent).
Approvals for private sector houses rose 0.2 per cent in trend terms in February. Private sector house approvals rose in Victoria (1.1 per cent) and New South Wales (0.8 per cent), but fell in Queensland (1.1 per cent), South Australia (1.1 per cent) and Western Australia (0.5 per cent).
The value of total building approved fell 1.1 per cent in February, in trend terms, and has fallen for five months. The value of residential building fell 0.1 per cent while non-residential building fell 2.9 per cent.
As normal we look at the trend series which smooths out the bumps.
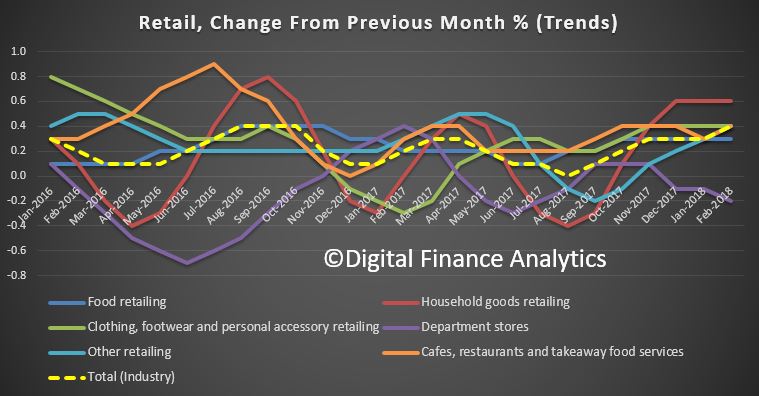
The trend estimate rose 0.4% in February 2018. This follows a rise of 0.3% in January 2018 and a rise of 0.3% in December 2017.
In trend terms, Australian turnover rose 2.7% in February 2018 compared with February 2017. This is faster than wages growth or inflation.
The following industries rose in trend terms in February 2018: Food retailing (0.3%), Household goods retailing (0.6%), Other retailing (0.4%), Cafes, restaurants and takeaway food services (0.4%), and Clothing, footwear and personal accessory retailing (0.4%). Department stores (-0.2%) fell in trend terms in February 2018.
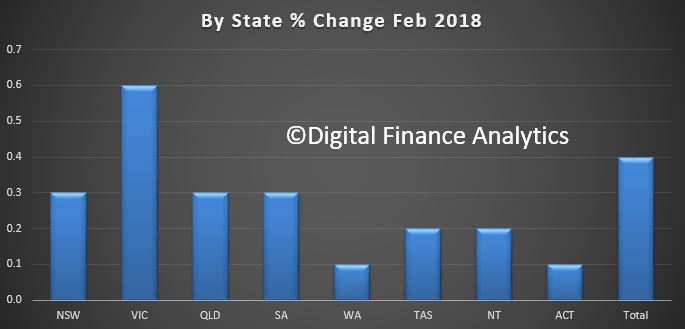
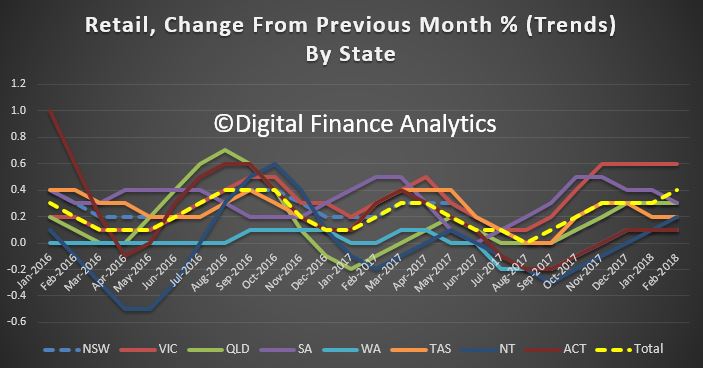
All the states and territories rose in trend terms in February 2018: Victoria (0.6%), New South Wales (0.3%), Queensland (0.3%), South Australia (0.3%), Western Australia (0.1%), Tasmania (0.2%), the Australian Capital Territory (0.1%), and the Northern Territory (0.2%).
The trends by state over time highlight the relative strength of Victoria, compared with the national average and several other states who are performing much less well, especially those in the mining heavy states.
Given the state of the housing market, we wonder if the slight improvement is sustainable, we will see. We do know that households are raiding their savings to support their spending habits. This can only continue until savings are depleted as the savings ratio falls further.
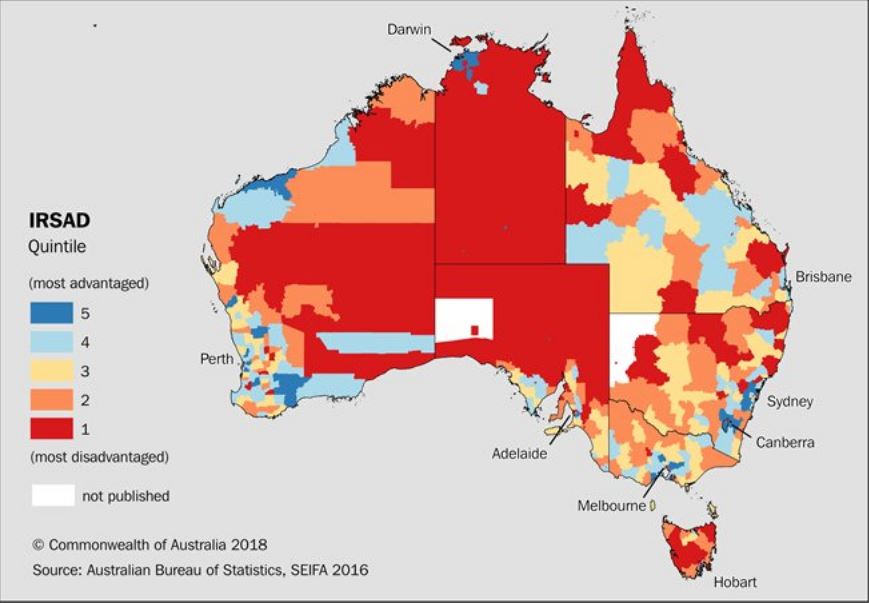
Ku-ring-gai on Sydney’s upper north shore is Australia’s most advantaged Local Government Area (LGA) according to new data released today from the ABS 2016 Census of Population and Housing.
Home to just over 118,000 residents on Census night, the leafy area is officially the most advantaged LGA in the country based on the ABS’ Socio-Economic Indexes for Areas (SEIFA), which ranks areas in Australia according to relative socio-economic advantage and disadvantage.
Another Sydney LGA, Mosman, which includes the affluent suburbs of Balmoral, Beauty Point and Clifton Gardens, has also been ranked amongst the most advantaged. In fact, SEIFA data shows the 10 most advantaged LGAs in Australia are all located around the Northern and Eastern areas of Sydney Harbour and in coastal Perth.
The most disadvantaged LGA is Cherbourg, approximately 250 kilometres north-west of Brisbane (QLD), followed by West Daly (NT). The 10 most disadvantaged LGAs in Australia can be found in Queensland and the Northern Territory.
SEIFA can help governments, communities and businesses determine areas needing additional funding and improved services, identify potential business opportunities, and research the relationship between health and education outcomes and the socio-economic conditions of an area.
The latest data has found that more than 30 per cent of people born in China, South Africa and Malaysia live in advantaged areas and less than 10 per cent reside in disadvantaged areas. Meanwhile, 40 per cent of Vietnamese-born live in disadvantaged areas and only a small proportion (11 per cent) live in advantaged areas.
People of Aboriginal and/or Torres Strait Islander origin are more likely to live in the most disadvantaged areas with 48 per cent living in the bottom fifth most disadvantaged LGAs, compared to 18 per cent of non-Indigenous people. Overall, only 5.4 per cent of Aboriginal and/or Torres Strait Islander people live in areas of high relative advantage compared with 22 per cent of non-Indigenous people.
New for 2016 SEIFA are easy-to-use features and data visualisation tools, including interactive maps on the ABS website, making interpreting Census data even easier.
For local rankings, go to the 2016 SEIFA publication. The full suite of online Census data products is available on the ABS website.
According to latest figures released by the Australian Bureau of Statistics (ABS), the seasonally adjusted unemployment rate increased to 5.6 per cent and the labour force participation rate increased by less than 0.1 percentage points to 65.7 per cent. The number of persons employed increased by 18,000 in February 2018.
The preferred monthly trend unemployment rate remained steady at 5.5 per cent in February 2018,
“While the unemployment rate remained steady, the underemployment rate decreased by 0.1 percentage points to 8.3 per cent over the quarter, and is now at its lowest point since November 2015,” the Chief Economist for the ABS, Bruce Hockman, said.
Over the past year, the trend underutilisation rate, which includes both unemployment and underemployment, decreased by 0.6 percentage points to 13.8 per cent.
Employment and hours
Monthly trend full-time employment increased for the 16th straight month in February 2018. Full-time employment grew by a further 8,000 persons in February, while part-time employment increased by 12,000 persons, underpinning a total increase in employment of 19,000 persons.
“Full-time employment has now increased by around 293,000 persons over the past year, and makes up the majority of the 400,000 increase in employment,” Mr Hockman said.
Over the past year, trend employment increased by 3.3 per cent, which is above the average year-on-year growth over the past 20 years (1.9 per cent). The trend monthly hours worked decreased slightly, by 1.4 million hours (0.1 per cent), with the annual figure continuing to show strong growth (2.7 per cent).
The labour force participation rate increased to 65.7 per cent, the highest it has been since December 2010. The female labour force participation also increased, to a further historical high of 60.6 per cent.
States and Territories
Over the past year, the states and territories with the strongest annual growth in trend employment were the ACT (4.7 per cent) Queensland (4.6 per cent) and New South Wales (3.9 per cent).

 We think “real life” prices increases are significantly higher, due to the impact of housing and health costs in particular.
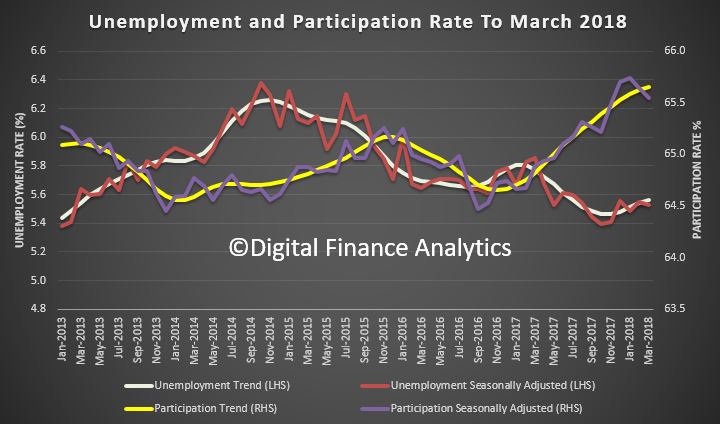


 We can then look across the individual states, as there are significant variations. Among the states and territories, the biggest trend decrease in dwelling approvals in February was the Australian Capital Territory down 18.7 per cent,