Dwelling approvals fall in November

The number of dwellings approved in Australia fell by 2.3 per cent in November 2018, in trend terms, according to data released by the Australian Bureau of Statistics (ABS) today.

“The trend for total dwellings has been steadily declining over the past twelve months,” said Justin Lokhorst, Director of Construction Statistics at the ABS. “The series is now 18.3 per cent lower than at the same time last year.”

NUMBER OF TOTAL DWELLING UNITS

Graph: Number of total dwelling units

The trend estimate for total dwellings approved fell 2.3% in November.


NUMBER OF PRIVATE SECTOR HOUSES

Graph: Number of private sector houses

The trend estimate for private sector houses approved fell 0.3% in November.


NUMBER OF PRIVATE SECTOR DWELLINGS EXCLUDING HOUSES

Graph: Number of private sector dwellings excluding houses

The decrease in November was driven by private sector dwellings excluding houses (e.g. townhouses and apartments), which fell 5.0 per cent. Private sector houses also declined, by 0.3 per cent.

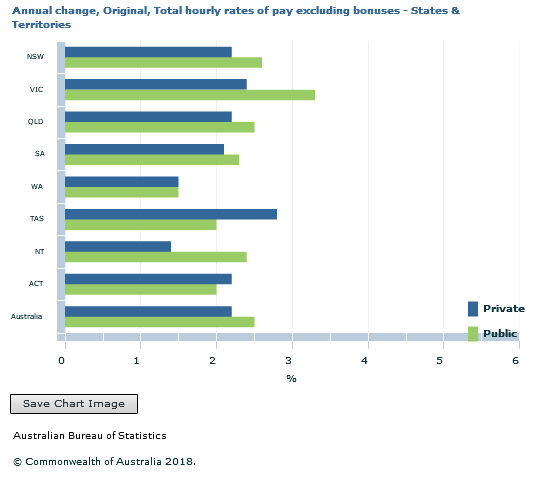
Among the states and territories, dwelling approvals fell in November in the Australian Capital Territory (9.5 per cent), South Australia (6.2 per cent), Western Australia (4.5 per cent), Queensland (3.4 per cent) and New South Wales (3.1 per cent) in trend terms. Tasmania (3.5 per cent) and Victoria (0.6 per cent) were the only states to record increases, while the Northern Territory was flat.

Approvals for private sector houses fell 0.3 per cent in November in trend terms. Victoria (0.7 per cent) and New South Wales (0.1 per cent) rose, while decreases were recorded in Queensland (1.8 per cent), South Australia (1.0 per cent) and Western Australia (0.7 per cent).

In seasonally adjusted terms, total dwellings fell by 9.1 per cent in November, driven by a 17.9 per cent decrease in private dwellings excluding houses. Private houses fell 2.6 per cent in seasonally adjusted terms.

The value of total building approved fell 0.8 per cent in November, in trend terms, and has fallen for 12 months. The value of residential building fell 1.6 per cent, while non-residential building rose 0.6 per cent.

HIA Blames Credit Supply

The HIA were quick to blame tighter lending, blaming the banks for tightening too far. No, HIA, they are now obeying the law!

“This weak result shows just how much the current credit squeeze is weighing on the home building sector.

“The credit squeeze is happening at the behest of the banks’ own lending practices which have been tightened above and beyond APRA’s requirements.

“HIA research has found that the time taken to gain approval for a loan to build a new home has blown out from around two weeks to more than two months.

“APRA’s decision late last year to lift its 30 per cent cap on banks’ interest-only lending is a welcome development, but more needs to be done to mitigate the growing risks of a hard-landing in the housing market.

“Policy makers and lenders alike need to be cognisant that ordinary home buyers are now facing blow- outs in loan processing times and also much greater rates of flat-out loan rejection. Today’s results show how this is weighing substantially on the new home building sector.

“We’ve long been anticipating the current downturn in new home building, but there is a risk it could develop more quickly and strongly than expected.

“In particular policy makers and lenders will need to respond judiciously to the pending release of the Banking Royal Commission’s recommendations.”

Trend unemployment rate continues to decrease

Australia’s trend unemployment rate fell from 5.2 per cent to 5.1 per cent in November 2018, according to the latest figures released by the Australian Bureau of Statistics (ABS).

The trend participation rate increased slightly to 65.7 per cent in November 2018, and was 0.2 percentage points higher than in November 2017. The female participation rate rose to 60.5 per cent and the male participation rate rose to 71.0 per cent.

ABS Chief Economist Bruce Hockman said:”The continued decrease in the trend unemployment rate to 5.1 per cent coincides with the highest trend participation rate ever.”

Employment and hours


In November 2018, trend employment increased by 28,800 persons. Full-time employment increased by 19,300 persons and part-time employment increased by 9,500 persons.

Over the past year, trend employment increased by 295,700 persons (2.4 per cent) which was above the average year-on-year growth over the past 20 years (2.0 per cent).

The trend monthly hours worked increased by 0.2 per cent in November 2018 and by 1.9 per cent over the past year. This is slightly above the 20 year average year on year growth of 1.7 per cent.

The monthly trend underemployment rate increased by less than 0.1 percentage points to 8.4% and the monthly underutilisation rate remained steady at 13.5 per cent.

States and territories

This month, the trend unemployment rate decreased in New South Wales and the Australian Capital Territory, increased in Western Australia and the Northern Territory, and remained steady in all other states.

The monthly trend unemployment rate increased in the Northern Territory (up 0.3 percentage points to 5.0 per cent) and Western Australia (up 0.1 percentage points to 6.3 per cent), and decreased in New South Wales (down 0.1 percentage points to 4.4 per cent) and the Australian Capital Territory (down 0.1 percentage points to 3.4 per cent). Victoria (4.6 per cent), Queensland (6.3 per cent), South Australia (5.6 per cent) and Tasmania (5.8 per cent) all remained unchanged.

The monthly trend participation rate decreased in the Northern Territory (down 0.3 percentage points to 74.0 per cent), Tasmania (down 0.2 percentage points to 60.6 per cent), the Australian Capital Territory (down 0.1 percentage points to 70.0 per cent), New South Wales (down less than 0.1 percentage points to 64.9 per cent) and South Australia (down less than 0.1 percentage points to 62.4 per cent). The trend participation rate increased in Western Australia (up 0.1 percentage points to 68.9 percent) and Victoria (up less than 0.1 percentage points to 65.8 per cent). The monthly trend participation rate remained unchanged in Queensland (65.7 per cent).

Seasonally adjusted data


The seasonally adjusted unemployment rate rose to 5.1 per cent in November 2018. The seasonally adjusted number of persons employed increased by 37,000 persons.

The net movement of employed in both trend and seasonally adjusted terms is underpinned by well over 300,000 people entering employment, and more than 300,000 leaving employment in the month.

Home Price Falls Are Accelerating (Will Bank Capital Be Hit?)

The ABS released their Residential Property Price Index series yesterday. 

They said that the price index for residential properties for the weighted average of the eight capital cities fell 1.5% in the September quarter 2018. The index fell 1.9% through the year to the September quarter 2018.

The capital city residential property price indexes fell in Melbourne (-2.6%), Sydney (-1.9%), Perth (-0.6%) and Darwin (-0.9%), and rose in Brisbane (+0.6%), Adelaide (+0.6%), Hobart (+1.3%) and Canberra (+0.5%).

Annually, residential property prices fell in Sydney (-4.4%), Darwin (-4.4%), Melbourne (-1.5%), Perth (-0.5%) and rose in Hobart (+13.0%), Canberra (+3.7%), Adelaide (+2.0%) and Brisbane (+1.7%).

The total value of residential dwellings in Australia was $6,847,057.2m at the end of the September quarter 2018, falling $70,148.6m over the quarter.

The mean price of residential dwellings fell $9,700 to $675,000 and the number of residential dwellings rose by 40,900 to 10,143,700 in the September quarter 2018.

Of course these averages do not tell the true picture, because the movements are not uniform across a state. In some post codes now we are seeing falls of more than 20% from the previous peak, elsewhere prices are holding more steadily. However, given credit availability drives home prices, and credit is harder to come by, we should expect more falls ahead. Then the question becomes, is a soft landing feasible? I have to say that all the cycles I have examined never ended softly, so it would be a first, if it did happen.

But there is another point to consider. Major banks use internal risk models to calculate the amount of capital they hold against mortgage loans. Other banks use more standard approaches.

The calculation is driven by a range of factors, but LVR is one element. Here is the APRA risk weights table.  The point is a loan with an LVR at 80% has a risk weight of 50%, but the same loan at 90% LVR requires 75%, and 100% LVR 100% weighting.  In other words, the capital doubles between 80 and 100% LVR!

At some point quite soon now banks will need to re-baseline their mortgage books.  When property prices were rising, they would do this quite regularly to reduce the capital requirement. The reverse is also true.

The governing APRA document says “The ADI must also revalue any property offered as security for such loans when it becomes aware of a material change in the market value of property in an area or region”. Have banks started to revalue their portfolios and up their risk weights in the light of these falls? This is also, by the way, why economists attached to the major banks have an interest in playing down potential home price falls.

APRA says “the valuation may be based on the valuation at origination or, where relevant, on a subsequent formal revaluation by an independent accredited valuer. The determination of the appropriate risk weight is also dependent upon mortgage insurance provided by an acceptable lenders mortgage insurer (LMI)”. Of course many lenders now have access to Automated Valuation Models from players such as CoreLogic. 

So now the question becomes, how much more capital will the banks have to put aside to take account of falling prices, who will bear the cost, and will APRA back down on its capital requirements which insist the banks hold more capital ahead? I expect more weakness in bank share prices as the impact of this hits home. As home prices fall further the impact will be magnified.


Retail Flat At 0.2% Trend In October

The ABS released their Retail Turnover stats for October 2018.  Still looks pretty sluggish. Perhaps Christmas will accelerate the spend. We will see! New South Wales reported a fall, well behind Victoria and Queensland.

They say:

  • The trend estimate rose 0.2% in October 2018. This follows a rise of 0.2% in September 2018, and a rise of 0.2% in August 2018.
  • The seasonally adjusted estimate rose 0.3% in October 2018. This follows a 0.1% rise in September 2018, and a rise of 0.3% in August 2018.
  • In trend terms, Australian turnover rose 3.5% in October 2018 compared with October 2017.
  • The following industries rose in trend terms in October 2018: Food retailing (0.2%), Other retailing (0.5%), Cafes, restaurants and takeaway food services (0.2%), and Clothing, footwear and personal accessory retailing (0.2%). Household goods retailing (-0.1%), and Department Stores (-0.1%) fell in trend terms in October 2018.
  • The following states and territories rose in trend terms in October 2018: Victoria (0.4%), Queensland (0.5%), South Australia (0.3%), Tasmania (0.3%), and the Australian Capital Territory (0.2%). Western Australia was relatively unchanged (0.0%). New South Wales (-0.1%), and the Northern Territory (-0.8%) fell in trend terms in October 2018.

Online retail turnover contributed 5.9 per cent to total retail turnover in original terms in October 2018, a rise from 5.6 per cent in September 2018 and the highest level recorded in the series. In October 2017 online retail turnover contributed 4.7 per cent to total retail.

Households Under The Pump According To ABS

The Australian economy grew 0.3 per cent in seasonally adjusted chain volume terms in the September quarter 2018, according to figures released by the Australian Bureau of Statistics (ABS) today.  But this was below expectations, and confirms the weaker performance of the economy. The household sector contribution is weakening, on the back of the weaker housing market, weak wages growth and higher costs.  Government spending and commodity prices helped support the weaker numbers.

The RBA was forecasting an annual 3.5% to December 2018, based on the recent Statement on Monetary Policy. With the first three quarters of the year reaching just 2.2%, it would require a December quarter of 1.3%, which seems unlikely.   So they will need to adjust their forecasts down.

All this looks to signal RBA cash rate cuts ahead.

In addition, the per-capita data went negative in September at – 0.1 % meaning that it is population growth alone which is responsible for lifting the GDP.

The per capita income and savings ratios also were negative, with the savings ratio back to lows not seen since 2007, as people dip into reserves to maintain lifestyle and pay the bills – as expected given our household financial confidence index.

And net disposable income per capita fell 0.3% in the last quarter.

We continue to see the economy quite differently from the RBA’s rose tinted windows in Martin Place.  Had it not been for strong commodity prices the story would have been worse still.  But the household sector growth engine is misfiring badly now, as the markets have recognised.

The ASX was down 1.14% at lunchtime to 4,642 on the back of the weak GDP and falls overnight on Wall Street.

The local fear index was higher, up 8.66% t0 16.11, indicating increasing uncertainty.

The Aussie slide against the USD, down 0.34% to 73.14.

And the DOW was down 3.1% overnight, on renewed fears about US recession as the yield curve inversion looks more likely, and trade talks with China continue, and Bexit uncertainty grows.

Signals from the Federal Reserve last week that it may be nearing an end to its three-year rate hike cycle has pushed the 10-year U.S. Treasury yield to three-month lows below 3 percent. The spread between the two-year and 10-year Treasury yields was at its flattest level in over a decade.

Concerns about slowing U.S. growth have accelerated the flattening of the yield curve, a phenomenon in which longer-dated debt yields fall faster than their shorter-dated counterparts.

A flatter curve is seen as an indicator of a recession, with lower longer-dated yields suggesting that the markets see economic weakness ahead.

This is what the ABS said:

ABS Chief Economist, Bruce Hockman, said: “The household sector drove domestic growth with increased consumption supported by moderate rises in household income.”

Household consumption rose 0.3 per cent driven by non-discretionary spending on food and housing. Spending on discretionary items slowed during the quarter. Household gross disposable income continued to grow at a slow pace due to moderate growth in household income being partially offset by a rise in income tax payable.

The subdued growth in gross disposable income coupled with an increase in household consumption resulted in the household saving ratio declining to 2.4 per cent in the September quarter. This is the lowest saving rate since December 2007.

Compensation of employees increased across all states and territories with the exception of the Northern Territory. “The increase in wages was consistent with strong employment growth as reported in the latest ABS Labour Force data, as well as a lift in wage rates.” Mr Hockman added.

Public spending was funded through increased revenue. General government final consumption expenditure increased 0.5 per cent underpinned by continued expenditure in health, aged care and disability services. Public investment remained at high levels with continued work on a number of large infrastructure projects around the nation.

Health care and social assistance output also recorded strong growth reflecting ongoing public investment in health care. Growth was also observed in services industries supporting infrastructure projects. Professional, scientific and technical services, Rental, hiring and real estate services and Administrative and support services all recorded growth during the quarter.

Australia’s net foreign debt liability position increased $12.6 billion to $1,044 billion In Sept 2018

All the talk today will be about the reduction in the current account deficit thanks to increased goods and services exports as shown in the ABS release to Sept 2018. International trade is expected to contribute 0.4 percentage points to growth in the September quarter 2018 Gross Domestic Product.

But the real story should be the continued expansion of foreign debt to $1,044 billion in Sept 2018. This is where our exposure is to rising interest rates (and we know already the US will continue to hike rates). The 1 Year LIBOR rate, for example, is rising still and this foreshadows real issues ahead.  The debt bomb is alive and well….

Australia’s current account deficit in seasonally adjusted terms decreased $1,368 million in the September quarter 2018 driven mainly by increased goods and services exports, according to latest figures from the Australian Bureau of Statistics (ABS).

The balance on goods and services surplus in the September quarter 2018 was $6,607 million, a rise of $2,704 million. Exports of goods and services rose $3,390 million (3 per cent) following a continued rise in exports of other mineral fuels which includes natural gas, offset by rising imports of goods and services, up $688 million (1 per cent). The net primary income deficit widened by $1,162 million to $16,911 million in the September quarter 2018.

In volume terms, imports falling and strong exports resulted in an expectation for international trade to contribute 0.4 percentage points to growth in the September quarter 2018 Gross Domestic Product. In seasonally adjusted chain volume terms, the balance on goods and services surplus increased $1,603 million, widening the surplus to $2,853 million.

Australia’s net international investment position was a liability of $940.2 billion at 30 September 2018, a decrease of $17.3 billion on the revised 30 June 2018 position of $957.5 billion.

Australia’s net foreign equity asset position increased $29.9 billion to $103.9 billion at 30 September 2018. Australia’s net foreign debt liability position increased $12.6 billion to $1,044.0 billion.

Dwellings approved in Australia fell by 1.1 per cent in October

The number of dwellings approved in Australia fell by 1.1 per cent in October 2018 in trend terms, according to data released by the Australian Bureau of Statistics (ABS) today.

NUMBER OF TOTAL DWELLING UNITS

Graph: Number of total dwelling units

The trend estimate for total dwellings fell 1.1% in October.

NUMBER OF PRIVATE SECTOR HOUSES

Graph: Number of private sector houses

The trend estimate for private sector houses approved fell 0.5% in October.

NUMBER OF PRIVATE SECTOR DWELLINGS EXCLUDING HOUSES

Graph: Number of private sector dwellings excluding houses

The trend estimate for private sector dwellings excluding houses fell 1.8% in October.

VALUE OF NEW RESIDENTIAL BUILDING

Graph: Value of new residential building

The trend estimate for value of new residential building approved fell 1.5% in October and has fallen for ten months.

“The trend for total dwellings has been steadily declining over the past twelve months,” said Justin Lokhorst, Director of Construction Statistics at the ABS. “The decrease in October was mainly driven by private sector dwellings excluding houses, which fell 1.8 per cent. Private sector houses also declined, by 0.5 per cent.”

Among the states and territories, dwelling approvals fell in October in the Northern Territory (12.5 per cent), South Australia (5.0 per cent), Western Australia (4.4 per cent), Queensland (2.9 per cent) and New South Wales (2.3 per cent) in trend terms. Victoria (2.4 per cent) and the Australian Capital Territory (0.8 per cent) were the only states to record an increase in dwelling approvals in trend terms, while Tasmania was flat.

NEW SOUTH WALES

Graph: Dwelling units approved - NSW

The trend estimate for total number of dwelling units in New South Wales fell 2.3% in October. The trend estimate for private sector houses rose 0.2% in October.

VICTORIA

Graph: Dwelling units approved - Vic.

The trend estimate for total number of dwelling units in Victoria rose 2.4% in October. The trend estimate for private sector houses rose 0.6% in October.

QUEENSLAND

Graph: Dwelling units approved - Qld

The trend estimate for total number of dwelling units in Queensland fell 2.9% in October. The trend estimate for private sector houses fell 1.3% in October.

SOUTH AUSTRALIA

Graph: Dwelling units approved - SA

The trend estimate for total number of dwelling units in South Australia fell 5.0% in October. The trend estimate for private sector houses fell 2.6% in October.

WESTERN AUSTRALIA

Graph: Dwelling units approved - WA

The trend estimate for total number of dwelling units in Western Australia fell 4.4% in October. The trend estimate for private sector houses fell 3.7% in October.

Approvals for private sector houses fell 0.5 per cent in October in trend terms. Private sector house approvals fell in Western Australia (3.7 per cent), South Australia (2.6 per cent) and Queensland (1.3 per cent). Victoria (0.6 per cent) and New South Wales (0.2 per cent) recorded increases.

In seasonally adjusted terms, total dwellings fell by 1.5 per cent in October, driven by a 4.8 per cent decrease in private dwellings excluding houses. Private houses rose 2.7 per cent in seasonally adjusted terms.

The value of total building approved fell 1.5 per cent in October, in trend terms, and has fallen for twelve months. The value of residential building fell 1.4 per cent while non-residential building fell 1.8 per cent.

Trend Unemployment Moves Lower to 5.1%

The trend unemployment rate fell from 5.2 per cent to 5.1 per cent in the month of October 2018, according to the latest figures released by the Australian Bureau of Statistics (ABS).

“Today’s fall in trend unemployment to 5.1 per cent marks the lowest unemployment rate since early 2012. This month is the 25th consecutive monthly increase in employed full-time persons with an average increase of 20,300 employed per month” said the Chief Economist for the ABS, Bruce Hockman.

Employment and hours

Trend employment increased by 25,400 persons in October 2018. Full-time employment increased by 22,900 persons and part-time employment by 2,500.

The trend underemployment rate remained steady at 8.3 per cent in October 2018 and the trend underutilisation rate decreased 0.1 percentage points to 13.4 per cent.

The trend participation rate remained steady at 65.6 per cent in October 2018.

Over the past year, trend employment increased by 285,900 persons or 2.3 per cent, which was above the average year-on-year growth over the past 20 years (2.0 per cent).

The trend monthly hours worked increased by 0.2 per cent in October 2018 and by 2.0 per cent over the past year.


States and territories

The states and territories with the strongest annual growth in trend employment were New South Wales (3.5 per cent) and Victoria (2.6 per cent).

“Of the 20,300 average monthly increase in employed full-time persons over the past 25 months, New South Wales contributed 35.9%, Victoria 30.5%, Queensland 16.5% and Western Australia 12.1%. The contribution of the other states and territories was largely flat” said Mr Hockman.


Seasonally adjusted data

The seasonally adjusted number of persons employed increased by around 32,800 persons in October 2018. The seasonally adjusted unemployment rate remained steady at 5.0 per cent and the labour force participation rate increased 0.1 percentage point to 65.6 per cent.

The net movement of employed in both trend and seasonally adjusted terms is underpinned by well over 300,000 people entering employment, and more than 300,000 leaving employment in the month

TREND ESTIMATES (MONTHLY CHANGE)

  • Employment increased 25,400 to 12,665,800.
  • Unemployment decreased 7,600 to 680,300.
  • Unemployment rate decreased by 0.1 pts to 5.1%.
  • Participation rate remained steady at 65.6%.
  • Monthly hours worked in all jobs increased 3.6 million hours (0.2%) to 1,761.8 million hours.

SEASONALLY ADJUSTED ESTIMATES (MONTHLY CHANGE)

  • Employment increased 32,800 to 12,671,500. Full-time employment increased 42,300 to 8,703,700 and part-time employment decreased 9,500 to 3,967,900.
  • Unemployment increased 4,600 to 672,100. The number of unemployed persons looking for full-time work decreased 5,200 to 445,400 and the number of unemployed persons only looking for part-time work increased 9,800 to 226,700.
  • Unemployment rate remained steady at 5.0%.
  • Participation rate increased by 0.1 pts to 65.6%.
  • Monthly hours worked in all jobs increased 6.1 million hours (0.3%) to 1,764.4 million hours.

LABOUR UNDERUTILISATION (MONTHLY CHANGE)

  • The monthly trend underemployment rate remained steady at 8.3 per cent. The monthly underutilisation rate decreased by 0.1 percentage points to 13.4 per cent.
  • The monthly seasonally adjusted underemployment rate remained steady at 8.3 per cent. The monthly underutilisation rate remained steady at 13.3 per cent.

Wages rise 0.6% in the September quarter 2018

The seasonally adjusted Wage Price Index (WPI) rose 0.6 per cent in September quarter 2018 and 2.3 per cent through the year, according to figures released today by the Australian Bureau of Statistics (ABS).

The more reliable trend  was 0.5% in the September quarter. Private sector wages grew by 0.55% over the quarter, whereas public sector wages grew by 0.61%.

So Public Sector wages are growing more strongly, whilst the private sector continues to struggle. The weak wages growth will dent the budget projections and household budgets.

ABS Chief Economist Bruce Hockman said seasonally adjusted, private sector wages rose 2.1 per cent and public sector wages grew 2.5 per cent, through the year to September quarter 2018.

“There was a higher rate of wage growth recorded across the majority of industries in comparison to this time last year, reflecting the influence of improved labour market conditions,” Mr Hockman said. “Annual wage growth at the Australia level was 2.3%, the highest growth rate since September quarter 2015.”

In original terms, annual growth to the September quarter 2018 ranged from 1.8 per cent for the Mining and Retail trade industries to 2.8 per cent for the Health care and social assistance industry.

Western Australia recorded the lowest through the year wage growth of 1.8 per cent while Tasmania recorded the highest of 2.6 per cent.

The ABS also released today a feature article that extends previous research looking at the factors underpinning wage growth. The article, Update on the Size and Frequency of Wage Changes, uses job-level micro data and shows that over the last two years the average frequency of wage changes has increased while the average size of wage rises has remained broadly stable.

Housing Lending Flows Contract In September

Further evidence in the lending slow down came through in spades today with the ABS releasing their housing finance statistics to September 2018.

Looking at the trend flows first, new lending for owner occupation fell 1.7% compared with last month, down $235 million to $13.78 billion.  Investment lending flows fell 0.8%, down $69 million to $8.96 billion, and owner occupied refinanced loans were flat at $6.24 billion.

Refinanced loans as a proportion of all flows rose to 20.8% and we continue to see this sector of the market the main battleground for lenders who are trying to attract lower risk existing borrowers with keen rates. Investment loans, were 39.4% of all new loans, up again from last month as owner occupied lending demand eases.

Looking at all the categories of loans month on month, we see lending for owner occupied construction down 1.2%, lending for the purchase of new dwellings down 2.2%, lending for the purchase of other existing dwellings down 1.7%, while investment lending for the construction of new property fell 2.5%, investment property for individuals fell 0.6% and investment lending for other entities, such as self managed super funds, dropped 2.2%. As a result total flows were down 1.1% compared with last month.

First time buyers were also down in number in September, falling by 8.8% to 8,693 new loans.  This was 18% of all loans, up from 17.8% last month.

Looking at the individual elements, overall first time buyers were down, although overall more loans were written with a fixed rate, in response to the battery of cheap rate deals which were on offer.

Our first time buyer tracker shows the lower trends, especially as the number of new first time buyer property investors continue to slide.

Finally, the overall loan stock rose in the month, in original terms, with owner occupied loans up 0.3% or $3.4 billion, and investment loans were flat, giving a total of $1.68 trillion, up 0.2%, and continuing the slowing trends.

We think lending growth will continue to slow, as prices fall further, and lending standards continue to tighten. Whilst some slack is being taken up by the non-bank sector, reduced credit means lower home prices ahead. We are entering the danger zone.