Will International Trade Save Our Bacon?

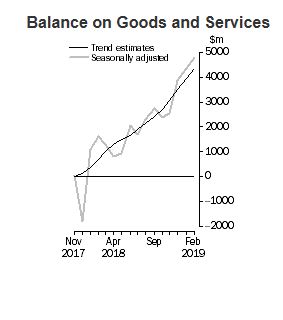
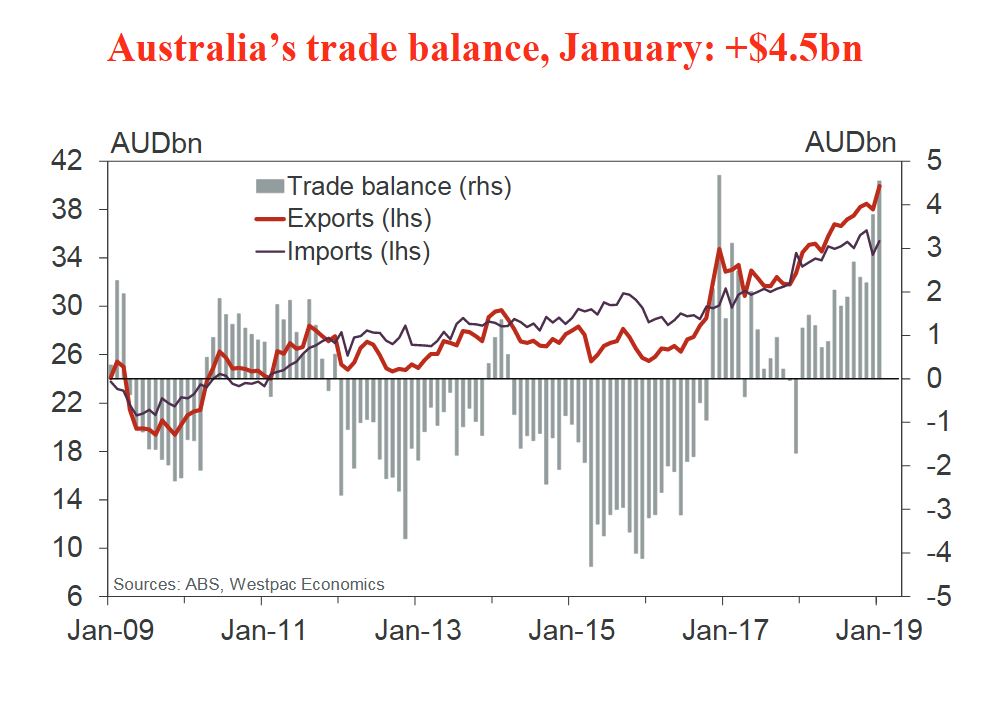
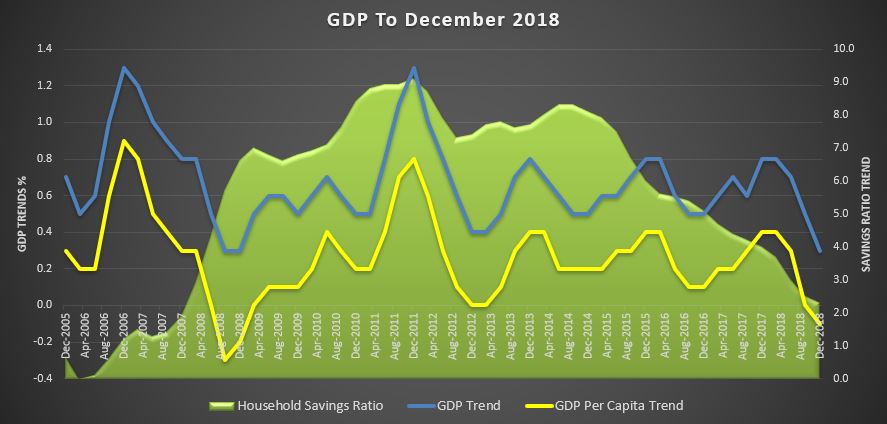
The latest from the ABS suggests that thanks to a lift in export prices, against imports, the GDP next time will be significantly assisted. Indeed the quantum of the changes are surprising strong. This may be sufficient to stop the RBA cutting the cash rate next month.

IMPORT PRICE INDEX

The Import Price Index fell 0.5% in the March quarter 2019. This follows a rise in the December quarter 2018 of 0.5%.

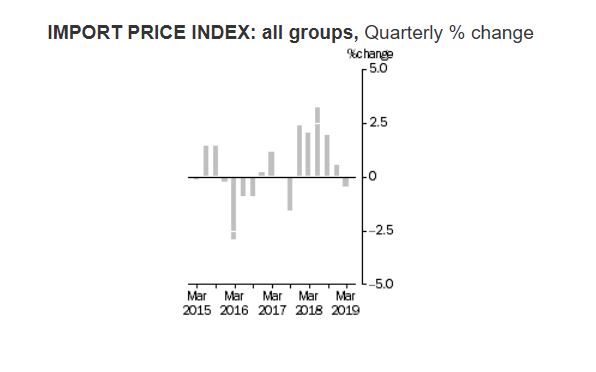
The main contributor to the fall this quarter is Petroleum, petroleum products and related materials (-6.8%), due to an increase in global supply.

Other major price falls were recorded in Inorganic chemicals and Medicinal and pharmaceutical products.

Inorganic chemicals fell 15.3%, driven by falls in the price of caustic soda, due to a global oversupply.

Medicinal and pharmaceutical products fell 3.1%, due to annual price reviews and increased competition from generic medicines.

These falls were partially offset by rises in prices for Gold, non-monetary (excluding gold ores and concentrates) (+6.8%), and General industrial machinery and equipment, n.e.s., and machine parts, n.e.s. (+2.5%).

Through the year to the March quarter 2019, the Import Price Index rose 5.2%. The main contributors to the rise are Petroleum, petroleum products and related materials (+5.6%), and General industrial machinery and equipment, n.e.s., and machine parts, n.e.s. (+8.6%).


MAJOR IMPORT PRODUCTS

The price movements of Australia’s major import products are summarised below:

  • Petroleum, petroleum products and related materials (SITC 33) (-6.8%);
  • Road vehicles (incl. air-cushion vehicles) (SITC 78) (-0.4%);
  • Telecommunications and sound-recording equipment and reproducing apparatus and equipment (SITC 76) (-0.1%);
  • Electrical machinery, apparatus and appliances, n.e.s. (SITC 77) (+1.0%);
  • General industrial machinery and equipment, n.e.s., and machine parts, n.e.s. (SITC 74) (+2.5%).

EXPORT PRICE INDEX

The Export Price Index rose 4.5% in the March quarter 2019. This follows a rise in the December quarter 2018 of 4.4%.

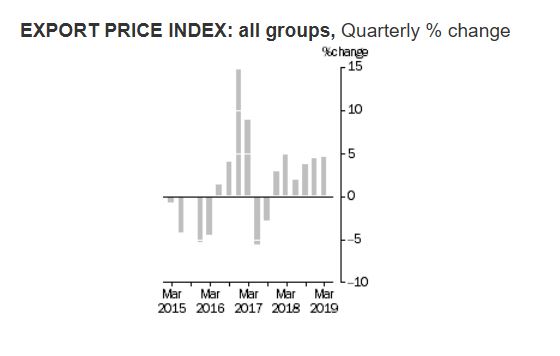
The main contributor to the rise this quarter is Metalliferous ores and metal scrap (+12.9%), reflecting local and global supply disruptions for iron ore and on-going demand from China.

Other major price rises were recorded in Gold, non-monetary (excluding gold ores and concentrates), Cereals and cereal preparations, Gas, natural and manufactured, and Non-ferrous metals.

Gold, non-monetary (excluding gold ores and concentrates), rose 6.6%, due to increased investor demand amid concerns over global economic growth.

Cereals and cereal preparations rose 4.3%, due to the impact of dry weather conditions globally in many wheat growing regions.

Gas, natural and manufactured rose 0.9%, due to the continuation of demand across Asia for liquefied natural gas. Export contract prices for liquefied natural gas are influenced by the international crude oil price with a four to six month lag.

Non-ferrous metals rose 3.3%, driven by increased demand for copper.

Offsetting these rises were falls in prices for Petroleum, petroleum products and related materials (-11.7%), and Meat and meat preparations (-2.3%).

Through the year to the March quarter 2019, the Export Price Index rose 15.3%. The main contributors to the rise are Metalliferous ores and metal scrap (+25.4%), Gas, natural and manufactured (+37.1%), and Coal, coke and briquettes (+9.0%).


MAJOR EXPORT PRODUCTS

The price movements of Australia’s major export products are summarised below:

  • Metalliferous ores and metal scrap (SITC 28) (+12.9%);
  • Coal, coke and briquettes (SITC 32) (+0.1%);
  • Gas, natural and manufactured (SITC 34) (+0.9%);
  • Gold, non-monetary (excluding gold ores and concentrates) (SITC 97) (+6.6%);
  • Meat and meat preparations (SITC 01) (-2.3%).

Trend Employment Steady

The ABS has reported that Australia’s trend estimate of employment increased by 20,700 persons in March 2019, with:

  • the number of unemployed persons increasing by 3,000 persons;
  • the unemployment rate remaining steady at 5.0%;
  • the underemployment rate remaining steady at 8.2%;
  • the underutilisation rate remaining steady at 13.2%;
  • the participation rate remaining steady at 65.6%; and
  • the employment to population ratio remaining steady at 62.4%.

Over the past year, trend employment increased by 299,100 persons (or 2.4%), which was above the average annual growth rate over the past 20 years of 2.0%. Over the same 12 month period the trend employment to population ratio, which is a measure of how employed the population (aged 15 years and over) is, increased by 0.4 percentage points (pts) to 62.4%.

Trend employment increased by 20,700 persons between February and March 2019. This represents an increase of 0.16%, similar to the monthly average growth rate over the past 20 years (0.17%), and less than the monthly average growth rate over the past five years (0.22%).

Underpinning these net changes in employment is extensive dynamic change, which occurs each month in the labour market. In recent months there has been around 300,000 people entering and leaving employment. There is also further dynamic change in the hours that people work, which results in changes in the full-time and part-time composition of employment.

Trend full-time employment increased by 18,000 persons between February and March 2019, and part-time employment increased by 2,700 persons. Compared to a year ago, there are 252,800 more persons employed full-time and 46,300 more persons employed part-time. This compositional shift led to a decrease in the part-time share of employment over the past 12 months, from 31.7% to 31.3%.

The trend estimate of monthly hours worked in all jobs increased by 4.3 million hours (or 0.2%) in March 2019, to 1,776.8 million hours. Monthly hours worked increased by 2.4% over the past year, equal to the increase in employed persons (2.4%). The average hours worked per employed person was 138.9 hours per month, or around 32.0 hours per week.

The trend unemployment rate remained steady at 5.0% in March 2019. The number of unemployed persons increased by 3,000 to 675,700 persons. Over the past year, the trend unemployment rate decreased by 0.5 pts, with the number of unemployed decreasing by 51,100 persons.

The trend participation rate remained steady at 65.6% in March 2019, which was equal to March 2018 (65.6%). The female participation rate remained steady at 60.6% and the male participation rate remained steady at 70.9%.

The labour force includes the total number of employed and unemployed persons. Over the past year, the labour force increased by 248,000 persons (1.9%). This rate of increase was above the rate of increase for the total Civilian Population aged 15 years and over (360,500 persons, or 1.8%).

The trend participation rate for 15-64 year olds, which controls (in part) for the effects of an ageing population remained steady at 78.1%. The gap between male and female participation rates in this age range is less than 10 pts, at 82.8% and 73.6% respectively, continuing the long term convergence of male and female participation.

The trend participation rate for 15-24 year olds (who are often referred to as the “youth” group in the labour market) remained steady at 68.0%. The unemployment rate for this group remained steady at 11.4% in March 2019 and decreased by 0.7% over the year.

The trend series smooths the more volatile seasonally adjusted estimates and provide the best measure of the underlying behaviour of the labour market.


SEASONALLY ADJUSTED ESTIMATES

Seasonally adjusted employment increased by 25,700 persons from February to March 2019. The underlying composition of the net change was an increase of 48,300 persons in full-time employment and a decrease of 22,600 persons in part-time employment. Since March 2018, full-time employment increased by 289,800 persons, while part-time employment increased by 14,900 persons.

Seasonally adjusted monthly hours worked in all jobs increased by 13.2 million hours (or 0.7%) in March 2019 to 1,785.4 million hours.

The seasonally adjusted employment to population remained steady at 62.3% in March 2019, and increased by 0.4 pts from the same time last year.


GRAPH 1. EMPLOYMENT TO POPULATION RATIO, PERSONS, March 2009 to March 2019

The seasonally adjusted unemployment rate increased by 0.1 pts to 5.0% in March 2019. The participation rate increased by 0.1 pts to 65.7%.


STATE AND TERRITORY ESTIMATES

TREND ESTIMATES

In March 2019, increases in trend employment were observed in all states and territories except Western Australia (down 200 persons) and Tasmania (down 100 persons). The largest increases were in Victoria (up 7,600 persons), followed by New South Wales (up 6,800 persons) and Queensland (up 4,900 persons).

Over the past year, increases in employment were also observed in all states except Tasmania (down 2,300 persons). Both territories recorded falls with the Australian Capital Territory (down 1,600 persons) and Northern Territory (down 4,800 persons). The largest increases were in Victoria (up 127,500 persons), New South Wales (up 118,500 persons), Queensland (up 36,100 persons). The highest annual employment growth rates were in the Victoria at 3.9%, followed by New South Wales at 3.0% and Queensland at 1.5%. For most states and territories, year-on-year growth in trend employment was below their 20 year average, the exceptions being New South Wales and Victoria.

The monthly trend unemployment rate increased by 0.1 pts in Tasmania (6.5%) and the Australian Capital Territory (3.6%). It remained unchanged in New South Wales (4.3%), Victoria (4.6%) and South Australia (5.9%). It decreased by under 0.1 pts in Western Australia (6.1%) and Queensland (5.9%), and fell 0.2 pts in the Northern Territory to 4.4%.

The monthly trend underemployment rate increased in the Northern Territory (up 0.2 pts to 5.4%), Victoria (up 0.1 pts to 8.4%) and Tasmania (up less than 0.1 pts to 10.1%). Decreases of up to 0.1 pts were seen in New South Wales (7.5%), South Australia (8.9%), Queensland (8.6%), Western Australia (8.9%) and the Australian Capital Territory (5.9%).

Monthly trend participation rate decreases were observed in Northern Territory (down 0.2 pts to 73.8%), Western Australia (down 0.1 pts to 67.8%) and Australian Capital Territory (down 0.1 pts to 69.2%). The monthly trend participation rate increased less than 0.1 pts in New South Wales (65.2%) and Victoria (66.1%). It remained unchanged in all remaining states.


SEASONALLY ADJUSTED ESTIMATES

In seasonally adjusted terms, the largest increase in employment was in Queensland (up 10,400 persons), followed by Victoria (up 10,000 persons) and South Australia (up 8,500 persons). The largest decrease was in New South Wales (down 2,600 persons) followed by Tasmania (down 1,800 persons).

The seasonally adjusted unemployment rate increased in Queensland (up 0.7 pts to 6.1%), South Australia (up 0.2 pts to 5.9%), Tasmania (up 0.2 pts to 6.7%), Western Australia (up 0.1 pts to 6.0%) and New South Wales (up 0.1 pts to 4.3%). The only decrease in the unemployment rate was observed in Victoria (down 0.1 pts to 4.6%).

The largest underemployment rate increase in seasonally adjusted terms was seen in Queensland (up 0.9 pts to 8.9%) followed by South Australia (up 0.4 pts to 8.8%), Western Australia (up 0.3 pts to 8.9%) and Tasmania (up 0.2 pts to 9.9%). The only decrease was seen in New South Wales (down 0.2 pts to 7.4%).

The largest increases in the seasonally adjusted participation rate were in South Australia (up 0.7 pts to 63.2%) and Queensland (up 0.6 pts to 65.6%). The seasonally adjusted participation rate decreased in Tasmania (down 0.4 pts to 60.3%), New South Wales (down 0.1 pts to 65.1%) and Victoria (down 0.1 pts to 66.0%).

Trade Surplus Climbs to $4.8bn, a Record High

This is all about the Iron Ore price, thanks to Brazil. Fortunate yes, planned no!

The ABS reported that

  • In trend terms, the balance on goods and services was a surplus of $4,348m in February 2019, an increase of $395m on the surplus in January 2019.
  • In seasonally adjusted terms, the balance on goods and services was a surplus of $4,801m in February 2019, an increase of $450m on the surplus in January 2019.

This from Westpac.

The trade surplus rose to $4.8bn in February, up from a revised $4.35bn.

That exceeded expectations (market median $3.7bn and Westpac $3.8bn).

Exports: exceeded expectations, +0.2% vs a forecast -0.9%. The key surprise, the expected pull-back in gold failed to materialise.

Imports: were softer than anticipated, -1.1% vs a forecast +1.1%

Additional detail

Export earnings have been boosted by higher commodity prices, particularly for coal and iron ore. In February, metal ore export earnings (including iron ore) jumped by $1.0bn to $9.6bn, a record high – as anticipated. The spot iron ore price soared to US$85/t in the month as global supply was dented by the tailings dam tragedy in Brazil. Coal exports fell sharply, down $0.8bn on weaker volumes. Gold exports, up $1.4bn in January, held at high levels in February, down only $140mn.

Comments

The trade balance has strengthened from a $2.9bn surplus on average in the December quarter to a $4.6bn on average surplus in the March quarter. The bulk of this improvement likely reflects higher commodity prices. The lift in prices is boosting Australia’s national income, which is flowing through to higher tax revenues – providing governments with additional fiscal flexibility, as evident in recent budget updates. However, despite this, wages growth remains sluggish.

Retail Trend Turnover Rises 0.2 per cent In February

Australian retail turnover rose 0.8 per cent in February 2019, seasonally adjusted, according to the latest Australian Bureau of Statistics (ABS) Retail Trade figures. This follows a rise of 0.1 per cent in January 2019.

The trend estimate rose 0.2% in February 2019. This follows a rise of 0.2% in January 2019, and a rise of 0.2% in December 2018. This a more reliable indicator. Compared to February 2018, the trend estimate rose 2.9 per cent, and is higher than average wages growth.

ABS Director of Quarterly Economy Wide Surveys, Ben Faulkner said: “There were improved results across most industries with rises in food retailing (0.8 per cent), department stores (3.5 per cent), household goods retailing (1.1 per cent) and clothing, footwear and personal accessory retailing (1.6 per cent). Other retailing (0.0 per cent) and cafes, restaurant and takeaway services (0.0 per cent) were relatively unchanged. The rise this month follows subdued results in December 2018 (-0.4 per cent) and January 2019 (0.1 per cent).”

In seasonally adjusted terms, there were rises in Queensland (1.4 per cent), New South Wales (0.6 per cent), Victoria (0.8 per cent), Western Australia (0.6 per cent), South Australia (0.7 per cent), the Australian Capital Territory (1.7 per cent) and the Northern Territory (1.4 per cent). There was a fall in Tasmania (-0.7 per cent).

The trend estimate for Australian retail turnover rose 0.2 per cent in February 2019, following a 0.2 per cent rise in January 2019. Compared to February 2018, the trend estimate rose 2.9 per cent.

Online retail turnover contributed 5.6 per cent to total retail turnover in original terms in February 2019, which is unchanged from January 2019. In February 2018, online retail turnover contributed 5.1 per cent to total retail.

Dwelling approvals rise in February

A rise in building approvals for apartments and townhouses has driven a 0.4 per cent increase in the total number of dwellings approved in Australia in February 2019, in trend terms, according to data released by the Australian Bureau of Statistics (ABS) today.

“Building approvals for private dwellings excluding houses rose 2.6 per cent in February.” said Justin Lokhorst, Director of Construction Statistics at the ABS. “Meanwhile, private houses fell a further 0.8 per cent”.

Among the states and territories, total dwelling approvals rose in February in New South Wales (3.1 per cent) and Western Australia (2.0 per cent), in trend terms. Falls were recorded in the Northern Territory (6.5 per cent), the Australian Capital Territory (6.3 per cent), Queensland (2.0 per cent), South Australia (1.1 per cent) and Victoria (0.8 per cent). Tasmania was flat.

Declines in approvals for private houses were recorded in New South Wales (2.0 per cent), Victoria (1.1 per cent) and Queensland (0.8 per cent), while increases were recorded in South Australia (2.0 per cent) and Western Australia (0.5 per cent).

In seasonally adjusted terms, total dwellings rose by 19.1 per cent in February, largely driven by rises in Victoria (37.3 per cent) and New South Wales (25.2 per cent). Private dwellings excluding houses rose 64.6 per cent, while private houses decreased by 3.6 per cent.

The value of total building approved rose 1.3 per cent in February, in trend terms. The value of non-residential building rose 1.9 per cent, while residential building increased 0.8 per cent.

Growth in job vacancies eases further in February

The number of job vacancies in Australia increased by 1.1 per cent over the February 2019 quarter, according to new trend figures from the Australian Bureau of Statistics.

Bruce Hockman, Chief Economist at the ABS, said that job vacancies continued to grow but at a slower rate than in 2018.

“Growth in the quarterly trend measure of job vacancies eased further to 1.1 per cent, which was well below the 5.2 per cent seen a year ago,” Mr Hockman said.

“This was consistent with the recent slowing in other economic indicators.”

Over the year, job vacancies increased by 9.2 per cent, with private sector vacancies increasing by 9.2 per cent and public sector vacancies by 9.4 per cent.

The seasonally adjusted number of job vacancies increased by 1.4 per cent over the February 2019 quarter.

In original series terms, New South Wales contributed the most to the growth in vacancies over the year, with health care and social assistance, and construction the two leading industries.

Trend unemployment rate steady at 5.0%

Australia’s trend unemployment rate remained steady in February 2019 at 5.0 per cent, from a revised January 2019 figure, according to the latest information released by the Australian Bureau of Statistics (ABS).

But there are signs of changes ahead. Have we reached the floor?

ABS Chief Economist Bruce Hockman said: “The trend unemployment rate declined 0.5 percentage points over the year, from 5.5 per cent to 5.0 per cent. The pace of decline slowed in recent months, which was consistent with the slowdown seen in recent Job Vacancies and GDP numbers.”

Employment and hours


In February 2019, trend monthly employment increased by 20,600 persons. Full-time employment increased by 12,300 persons and part-time employment increased by 8,200 persons.

Over the past year, trend employment increased by 290,700 persons (2.3 per cent) which was above the average annual growth over the past 20 years (2.0 per cent).

The trend monthly hours worked increased by 0.1 per cent in February 2019 and by 1.9 per cent over the past year. This was slightly above the 20 year average year-on-year growth of 1.7 per cent.

Underemployment and underutilisation

The trend monthly underemployment rate decreased by less than 0.1 percentage points to 8.1 per cent in February and by 0.4 percentage points over the year. The trend underutilisation rate decreased less than 0.1 percentage points to 13.1 per cent, and by 0.9 percentage points over the year.

States and territories trend unemployment rate

The trend unemployment rate increased in Tasmania, decreased in Queensland, and remained steady in all other states and territories.

Seasonally adjusted data


The seasonally adjusted unemployment rate decreased 0.1 percentage point to 4.9 per cent in February 2019, while the participation rate fell 0.2 percentage points to 65.6 per cent. The seasonally adjusted number of persons employed increased by 4,600.

The net movement of employed in both trend and seasonally adjusted terms is underpinned by around 300,000 people entering and leaving employment in the month.

ABS Confirms Home Price Falls, And Falling Wealth

Residential property prices fell 2.4 per cent in the December quarter 2018, according to figures released today by the Australian Bureau of Statistics (ABS). The total value of Australia’s 10.3 million residential dwellings fell by $133.1 billion to $6.7 trillion. The mean price of dwellings in Australia is now $651,100, and falling.

Plus the number of home transfers complete are trending down as sales volumes decline, and stock rises.

Chief Economist for the ABS, Bruce Hockman said: “Australia’s two largest cities continue to lead the fall in property prices. These falls follow a period of solid growth, where prices in Sydney rose 68 per cent and Melbourne rose 54 per cent, over the five years to December quarter 2017.”

Sydney property prices fell 3.7 per cent in the December quarter 2018 and have continued to fall since September quarter 2017, while Melbourne property prices recorded the fourth consecutive quarter of falls (-2.4 per cent).

Here are the annual trends. Hobart and Canberra are still in poisitve territory (but falling).

Mr. Hockman said: “While property prices are falling in most capital cities, a tightening in credit supply and reduced demand from investors and owner occupiers have had a more pronounced effect on the larger property markets of Sydney and Melbourne.”

Through the year growth in residential property prices fell 5.1 per cent in the December quarter 2018. Falls were recorded in Sydney (-7.8 per cent), Melbourne (-6.4 per cent), Darwin (-3.5 per cent), Perth (-2.5 per cent) and Brisbane (-0.3 per cent).

We also see continuing falls in the number of home transfers (the end result of sales). The last quarter of 2018 is still preliminary, but the trends are pretty clear now. Falls in Melbourne appear the most significant.

But Sydney is not far behind.

Other states also appear weaker (even Hobart, Adelaide and Canberra). Expect more home price falls ahead.

now $651,100.

Australia’s Trade Account Surplus Jumps In January

The ABS released the latest trade data to end January 2019. The surplus jumped to $4.5bn which is the second highest on record. The largest was
$4.7bn surplus in December 2016.

Westpac highlighted that the January outcome was a $0.8bn improvement on December and exceeded expectations (market median $2.75bn and Westpac $3.1bn).

Imports did rebound in the month, +3.3%, following a 5.5% fall last month (vs a forecast +4%).

Exports were much stronger than anticipated, increasing by 5.0%, up $1.9bn (vs a forecast +2.2%).

Export strength was largely centred on a sharp rebound in gold off a low base, up 174% (Westpac expected a 75% rebound).

In dollar terms, gold accounted for $1.4bn of the $1.9bn increase in total exports in the month.

Coal exports rose 6%, following a couple of softer months, and metal ores increased by 3.4%, boosted by the higher iron ore price. But rural exports have been more resilient over the past couple of months – however the drought in NSW and surrounds remains a considerable headwind.

Metal ores and coal both advanced in January, up a combined $0.6bn.

The trade surplus widened in 2018 and in to 2019 on higher export earnings, boosted by rising commodity prices.

Notably, commodity prices have surprised to the high side in part due to supply disruptions having an amplified impact in a market where supply and demand are in relatively tight balance.

The $4.5bn surplus for January compares with a Q4 monthly average of $2.8bn.

The surplus for Q1 as a whole is expected to be a material improvement on that in Q4, with export volumes forecast to rise (following a disappointing second half of 2018) and on a likely further increase in the terms of trade.

Economy Grew 0.2 per cent in December quarter; Per Capita Recession Hits!

The Australian economy grew 0.2 per cent in seasonally adjusted chain volume terms in the December quarter 2018, according to figures released by the Australian Bureau of Statistics (ABS) today. But the heavy lifting was done by Government, leading to a 2.3% annual result. In seasonally adjusted terms we had two quarter falls in GDP per capita, so we are technically in recession on a per capital basis.

Actually the December data provided no major surprises as both the headline GDP and behaviour of consumers were broadly as anticipated. This is also true on housing, investment and public demand.

The trend data shows a fall in GDP, GDP per capital and in the savings ratio. Expect significant fiscal stimulus in the budget, and more after the election. This is an economy running of just a few cylinders.

New home building activity fell by 3.6 per cent during the final quarter of 2018 while home renovation activity declined by 3.1 per cent. Despite the softening at the end of 2018, activity was still higher than in the same quarter a year earlier.

Here is the ABS summary:

AUSTRALIAN ECONOMY GREW BY 0.2%

Australia’s gross domestic product (GDP) grew by 0.2% in the December quarter 2018, following a 0.3% rise in the September quarter. The Australian economy grew 2.3% through the year.

GROSS DOMESTIC PRODUCT, Volume measures: Seasonally adjusted

Diagram shows Gross domestic product. Volume measures Seasonally adjusted

CONTINUED STRENGTH IN GOVERNMENT EXPENDITURE

Government final consumption expenditure rose 1.8% in the December quarter 2018 and remains strong through the year at 5.6%. National non-defence (4.2%) was the main contributor to growth in the quarter, due to increases in social benefits to households from continued government spending on disability, health and aged care services. State and local government expenditure increased 1.1% driven by rises in non-employee expenses.

GOVERNMENT FINAL CONSUMPTION EXPENDITURE, Volume measures: Seasonally adjusted

Diagram shows Government final consumption expenditure. Volume measures Seasonally adjusted

SUSTAINED GROWTH IN INVESTMENT BY GENERAL GOVERNMENT

General government gross fixed capital formation increased 2.7% this quarter. The rise was driven by state and local general government (6.3%), with continued strength due to public infrastructure investment. This was offset by national general government, which fell 5.7% following defence purchases in the September quarter. Through the year general government gross fixed capital formation has risen 9.0%, again reflecting the high number of public infrastructure projects occurring across the country.

GENERAL GOVERNMENT GROSS FIXED CAPITAL FORMATION, Volume measures: Seasonally adjusted

Diagram shows General government gross fixed capital formation. Volume measures Seasonally adjusted

BUILD UP IN INVENTORIES

Inventories held by business increased $685m in the December quarter 2018.

CHANGE IN INVENTORIES – Selected industries, Volume measures: Seasonally adjusted

Diagram shows CHANGE IN INVENTORIES - Selected industries, volume measures: Seasonally adjusted

GROWTH IN HOUSEHOLD CONSUMPTION SLOWS

Household final consumption expenditure increased 0.4% in the December quarter 2018, with through the year growth moderating to 2.0%. The growth in household consumption was driven by spending on health, clothing and footwear, and hotels, cafes and restaurants. There were falls in household spending for electricity, gas and other fuel, purchases of vehicles and furnishings and household equipment.

HOUSEHOLD FINAL CONSUMPTION EXPENDITURE, Volume measures: Seasonally adjusted

Diagram shows Household final consumption expenditure. Volume measures Seasonally adjusted

BROAD BASED GROWTH IN COMPENSATION OF EMPLOYEES

Compensation of Employee (COE) increased 0.9% in December quarter 2018 due to strength from both the private and public sector. Through the year COE increased 4.3% and with growth above its five year December average of 3.4% growth.

COMPENSATION OF EMPLOYEES, Current prices: Seasonally adjusted

Diagram shows COMPENSATION OF EMPLOYEES, Current prices Seasonally adjusted

HOUSEHOLD SAVING RATIO INCREASED MARGINALLY

The household saving ratio rose to 2.5% in the December quarter 2018. This slight pick up was due to modest growth in household disposable income alongside lower growth in household spending. The growth in gross disposable income was due to continued growth in compensation of employees as well as an increase in insurance claims received by households.

HOUSEHOLD SAVING RATIO, Current prices: Seasonally adjusted

Diagram shows HOUSEHOLD SAVING RATIO, Current prices: Seasonally adjusted

Chief Economist for the ABS, Bruce Hockman, said: “Growth in the economy was subdued, reflecting soft household spending and a decline in dwelling investment. The approvals for dwelling construction indicate that the decline in dwelling investment will continue.”

Household spending grew by 0.4 per cent, reflecting a continuation of modest spending in recent quarters. Investment in dwellings fell 3.4 per cent.

Falls in private investment dampened growth in the quarter. This was consistent with the decline in construction industry value added, falling 1.9 per cent. Services industries supporting construction activity detracted from growth with professional scientific and technical services industry value added declining for the first time in three years. Mining investment fell in the quarter as significant projects transitioned from the construction to the production phase. This is reflected in oil and gas production, which grew 7.7 per cent.

Public demand sustained growth in the quarter. Public investment remained at high levels with State and Local government growth of 6.3 per cent reflecting continued work on a number of large infrastructure projects. Government final consumption expenditure grew 1.8 per cent, with ongoing expenditure in health, aged care and disability services. This investment translates to ongoing strength from the healthcare industry, which remains the largest contributor to economic growth.

Mr Hockman said “As the economy transitions out of the mining boom, investment has remained strong with major public works driving growth around Australia.”