
Suncorp reported their half-year profits to 31 December 2015 today. Group net profit after tax (NPAT) was $530 million, down on HY15 at $631 million, profit after tax was of $544 million compared with HY15 at $681 million, and return on average shareholders’ equity was 7.9%, compared with HY15 of 9.4%. An interim dividend of 30 cents per share fully franked was announced, down from 38 cents HY15.
Basically, after taking a hit on general insurance claims, releasing some reserves, growing the banking business, and driving efficiency savings, the bank has gone backwards. The new CEO, 100 days into the role has a struggle on his hands in the light of market conditions and uncertainties. It is true, that a pure play insurance business would have taken a harder knock, so the portfolio of businesses do offer some hedge. But there is much to be done.
Looking at the segmentals:
General Insurance reported a NPAT of $297 million compared with HY15 of $419 million, with an underlying insurance trading ratio (UITR) of 10.1% compared with HY15 of 14.8%), after adjusting for the impact of higher than expected natural hazards ($362m), investment market volatility and the continuation of strong prior year reserve releases. The bank pointed to both environmental and operational factors to explain the fall off in performance. There will need to be a strong focus on claims management efficency.
Personal Insurance Gross Written Premium (GWP) returned to growth, increasing by 0.6% as a result of increases in average premiums offset by the exit of some corporate partner relationships. This is the first time growth has been reported in five halves. Customer retention remained strong, demonstrating the strength of the Group’s brands and stabilisation in the personal insurance market.
Commercial Insurance GWP grew by 2.2% with a strong growth across the compulsory third party (CTP) portfolio, partially offset by a negative impact from the Western Australian Workers Compensation portfolio.
Compulsory Third Party (CTP) GWP grew 6.8% with Suncorp leveraging the scale of its national CTP model to continue expansion into the ACT market as well as benefitting from the withdrawal of competitors in key markets.
New Zealand GWP was up 2.6% (in $A terms) due to strong growth in personal lines.
Bank NPAT increased to $194 million compared with HY15 at $176 million as a result of improving credit quality and very low impairment losses, which fell to $11 million, or 4 basis points of gross loans, well below the expected range of 10 to 20 basis points of gross loans. Gross impaired assets reduced by 32.8% and total gross non-performing loans reduced by 15.1%.
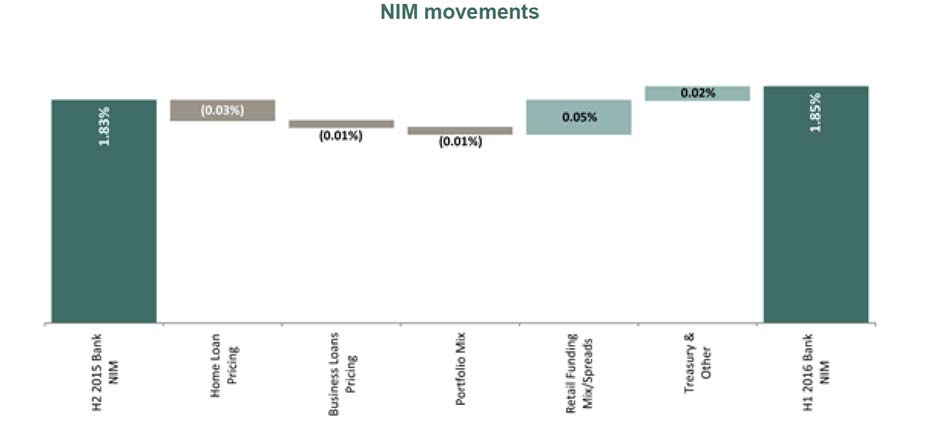
Net interest income increased 2.4% to $566 million. The Bank’s NIM improved 2 bps over the half to 1.85% to sit at the top of the 1.75% to 1.85% target operating range, with market-wide repricing offsetting increases in funding costs and heightened competition, and the Cost to Income ratio of was 53.0% compared with HY15 of 52.2%.
 Home lending grew 8.2% to $43.0 billion despite intense price competition particularly in the Bank’s traditional owner-occupied segment given the current regulatory landscape. Mortgage brokers are responsible for 63% of Suncorp’s $43 billion mortgage book, leaving its direct branch channel behind 37% of home loans settled. The Bank pursued growth outside its traditional Queensland market with 60% of new business originating interstate supported by strengthened capability in the intermediary channel. A disciplined approach to investor lending has seen growth reduce below 10% year-on-year. Business lending contracted 3.0% during the half to $9.5 billion, partially driven by better than expected seasonal repayments from cropping and livestock proceeds in the agribusiness portfolio.
Retail deposits remain the core source of funding, with a deposit to loan ratio of 65.6%, comfortably within the Bank’s 60% to 70% target range. The Group’s A+/A1 rating continued to provide a competitive advantage allowing access to both secured and unsecured funding markets and significant diversification and flexibility.
Impairment losses on loans and advances were $11 million, representing 4 bps of gross loans and advances. Gross non-performing loans reduced 15.1% to $557 million. Gross impaired assets decreased 32.8% to $176 million, representing 33 bps of gross loans and advances. Provision coverage remains appropriate and the Bank continues to retain the prudent $8 million drought overlay.
The CET1 ratio increased 30 bps to 9.45%, above the top end of the 8.5% – 9.0% target range. The Bank’s Return on CET1 continues to improve, up 90 bps to 13.1% and is within the Bank’s 12.5% to 15.0% target range. This improvement has been supported by the Bank’s Advanced Accreditation program, with a better understanding of risk selection, pricing and capital planning.
Suncorp Life NPAT was $53 million compared with HY15 of $86 million, with underlying NPAT increasing to $58 million compared with HY15 of $52 million, following the third consecutive period of positive claims and lapse experience.
After accounting for the interim dividend, the Group’s total capital position remains strong with CET1 capital of $506 million held above the Group’s operating targets. The General Insurance CET1 is 1.25 times PCA and the Bank CET1 is 9.45%.
Going forwards, the strategy appears to focus on cross-selling more products to existing customers, rather than growing the customer base. There will also be a focus on cost optimisation, including prospective benefits of $170m in 2018.