
Interesting piece from Moody’s today which warns:
Do not confuse the stunning rally by high-yield bonds since early 2016 with a commensurate enhancement of the fundamentals governing high-yield credit quality. Be aware of how the same overvaluation that now inflates share prices may also be responsible for an exaggerated narrowing of high-yield spreads.
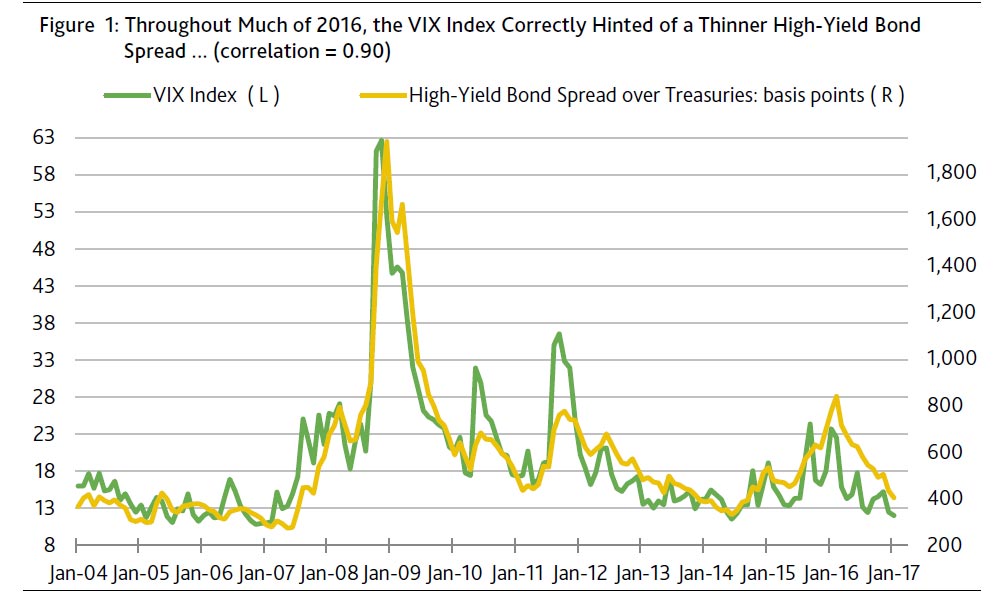
According to almost every explanation of the high-yield bond spread, a recent composite speculative-grade bond yield of roughly 6% now undercompensates investors for default risk. The accompanying high-yield bond spread of 404 bp was the thinnest since the 396 bp of September 23, 2014. However, September 2014’s 2.2% EDF (average expected default frequency) metric for US/Canadian high-yield issuers was significantly lower than the 3.6% of January 4, 2017. Indeed, the combination of the 3.6% high-yield EDF and its -80 bp drop of the last three months predicts a 450 bp midpoint for the high-yield bond spread that exceeds its recent 404 bp.
Of all the major drivers of the high-yield bond spread, only an exceptionally low VIX index supports the possibility of even less compensation for default risk. More specifically, the recent VIX index of 12.0 predicts a 360 bp for the high-yield bond spread. (Figure 1.)
Market behavior of the past year suggests that the VIX index will continue to give direction to the high-yield bond spread. Nevertheless, high-yield spreads could widen amid a climb by the market value of US common stock if a narrowly focused equity rally is incapable of reversing a worsening outlook for high-yield defaults.
Downgrades jump relative to Q4-2016 rating changes
Fourth-quarter 2016’s widening of the gap between high-yield downgrades and upgrades was very much at odds with a pronounced narrowing by the high-yield bond spread. Downgrades supplied 68% of the number of credit rating changes affecting US high-yield companies in 2016’s final quarter. Previously, after dropping from Q1-2016’s current cycle high of 82% to Q2-2016’s 62%, downgrades’ share of US high-yield credit rating revisions would then sink to Q3-2016’s 54%.
The latest upswing by the relative incidence of high-yield downgrades cannot be ascribed to the oil and gas industry. To the contrary, the relative incidence of high-yield downgrades actually increased after excluding oil and gas related revisions largely because of Q4-2016’s financially-driven, as opposed to fundamentally-based, oil and gas company upgrades. More specifically, downgrades’ share of high-yield credit rating revisions excluding all changes closely linked to oil and gas would soar from Q3-2016’s 48% to Q4-2016’s 70%, where the latter was the highest such ratio since the 72% of Q1-2016.
When comparing the US high-yield rating revisions of 2016’s third- and fourth-quarters, a -48% plunge in the number of upgrades stands out. By contrast, the number of high-yield downgrades barely dipped by -4%.
After excluding revisions that were purely event driven, the number of high-yield upgrades attributed to improved fundamentals sank by -46% from the third to the fourth quarter, while downgrades stemming from worsened fundamentals edged higher by 1%.
Spreads may widen unless net downgrades subside
When the high-yield bond spread averaged 379 bp during the year-ended September 2014, not only were fundamentally driven high-yield downgrades -40% fewer, on average, compared to Q4-2016’s pace, but fundamentally-driven upgrades were +29% more numerous. Moreover, in terms of quarterly averages for all US high-yield credit rating changes, the year-ended September 2014 showed -29% fewer downgrades and +41% more upgrades compared to Q4-2016’s results. And yet the high-yield spread is now the narrowest since September 2014?
Notwithstanding the jump by downgrades’ share of US high-yield credit rating revisions both with and excluding oil and gas related changes, the high-yield bond spread still narrowed considerably from a Q3-2016 average of 551 bp to Q4-2016’s 477 bp. Moreover, as noted earlier, January 4, 2017’s high-yield bond spread of 404 bp was the thinnest since September 2014, where the latter was at the end of the just cited yearlong span of a much lower ratio of downgrades to upgrades.
The record warns of a wider high-yield bond spread unless fourth-quarter 2016’s excess of high-yield downgrades over upgrades narrows substantially. As statistically inferred from the relatively strong correlation of 0.80 between the high-yield bond spread’s quarter-long average and the moving two-quarter ratio of net high-yield downgrades to the number of high-yield issuers, H2-2016’s ratio favors a 536 bp midpoint for the high-yield bond spread. Moreover, if the net high-yield downgrades of 2016’s final quarter persist through the end of September 2017, the projected midpoint for the high-yield spread widens to 560 bp. (Figure 2.)

Equity strength enhances credit quality
The fact that the high-yield spread is now much narrower than what might be inferred from the recent excess of high-yield downgrades over upgrades underscores the critical importance of today’s superb financial market conditions to the current thinness of spreads. The considerable support now supplied to the high-yield bond market by an exceptionally low VIX index of 12.0 cannot be overstated. Once financial market conditions deteriorate, the high-yield bond market’s vulnerabilities will become apparent.
Nevertheless, today’s ample amount of systemic liquidity can facilitate a strengthening of high-yield credit quality. Injections of common equity capital enhance corporate credit quality either by (i) deepening the capital base that shields creditors or (ii) funding the retirement of outstanding debt.
Common equity capital is more likely to be secured at an attractive cost during a broad based equity rally. When the US equity market was flat to lower during the six-months-ended March 2016, only two upgrades were ascribed to injections of common equity capital. However, a subsequent rally by US shares has helped to boost the number of common-equity injection upgrades to the 32 of the final nine months of 2016.
In addition, a well-functioning equity market also boosts the number of upgrades stemming from mergers, acquisitions and divestments. After averaging 23 per quarter during the year ended September 2015, the number of upgrades linked to M&A slumped to 12 per quarter amid the soft equity market of the six-months-ended March 2016. Thereafter, stocks thrived during the final nine months of 2016 and the number of upgrades attributed to M&A rebounded to 24 per quarter, on average. Of special importance to financially-stressed high-yield issuers is how broad stock market rallies often facilitate asset divestitures that fund the retirement of outstanding debt.Credit quality worsened amid huge equity rally of 1998-2000
The breadth of an equity market rally matters. Despite the 18.5% average annual surge by the market value of US common stock during the two years ended March 2000, the US high-yield default rate climbed up from March 1998’s 2.7% to March 2000’s 6.3%, the moving two-quarter ratio of net high-yield downgrades to the number of high-yield issuers soared higher from Q1-1998’s -2.5% to Q1-2000’s +7.7%, and the high-yield bond spread widened from Q1-1998’s 338 bp to Q1-2000’s 522 bp.
Instead of benefiting from the very strong showing by the market value of US common stock, the high-yield bond market was weighed down by the accompanying -5.9% average annual decline incurred by Value Line’s geometric stock price index, which offers insight regarding the breadth of an equity market rally. Despite the equity market’s outsized gains of the two-years-ended March 2000, the gains were narrowly focused according to the slide by the Value Line index. By contrast, the 17% surge by the Value Line index from Q1-2016 to Q4-2016 was actually greater than the accompanying 14% increase by the market value of US common stock.
As revealed by the statistical record since 1994, the high-yield bond spread’s year-over-year change in basis points shows a stronger inverse correlation of -0.82 with the yearly percent change of the Value Line index relative to its comparably measured correlations of -0.76 with the Russell 2000 stock price index and -0.67 with the market value of US common stock.
Moreover, another possibly revealing aspect of 1998-2000’s equity rally was how it occurred despite a relatively high VIX index. Though the methodology determining the VIX index has since changed, after advancing from a 1993-1996 average of 13.9 to March 1998’s 20.2, the VIX index averaged an even higher 22.7 in March 2000.
In conclusion, an extension of the ongoing high-yield rally may require a further overvaluation of the US’s already richly priced equity market. Until downwardly revised earnings outlooks proliferate, the path of least resistance for share prices may be higher. Thus, high-yield bond spreads may continue to ignore the less than favorable trend of credit rating revisions.