
Today we start a series on our updated household surveys, which will in due course feed into our next edition of the Property Imperative, due be released later in the year. The current edition, is still available, but there are some significant changes in household intentions since then.
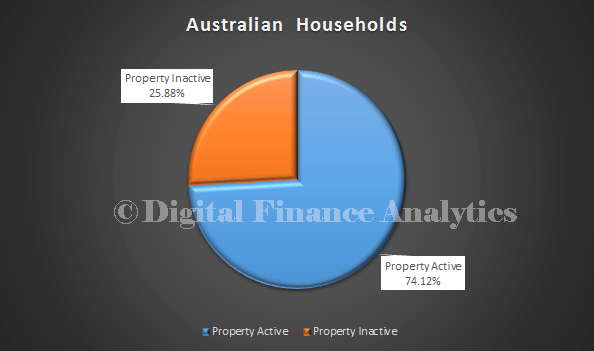
We run our surveys continually, and so incorporate new data each week. The results we will discuss relate to data up to 13th June. We start by looking at the mix of households who are property active and inactive. We define property active households as those who either own, or intend to own a property to live in, or are investing in property, or both. We find that 25.88% of households are inactive. These households will rent, live with family or friends, or have other housing arrangements.
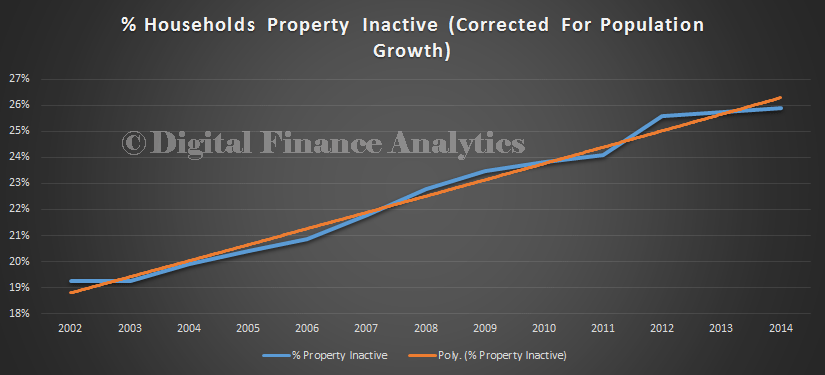
 Looking at the inactive status trend, we see that more households than ever are excluded from the property market.
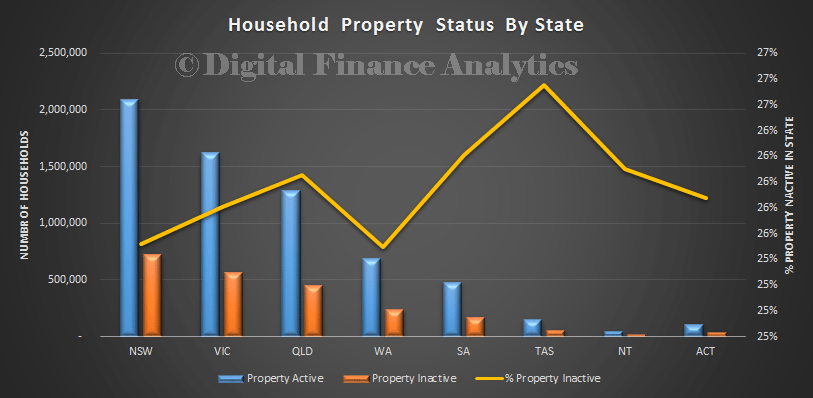
 We also see some state variations, with the highest proportion of inactive households founds in Tasmania and South Australia, whilst households in Western Australia, then New South Wales and Victoria have a lower mix of those inactive. That said, the absolute numbers are still increasing in these states too. This is the continuation of a long term trend.
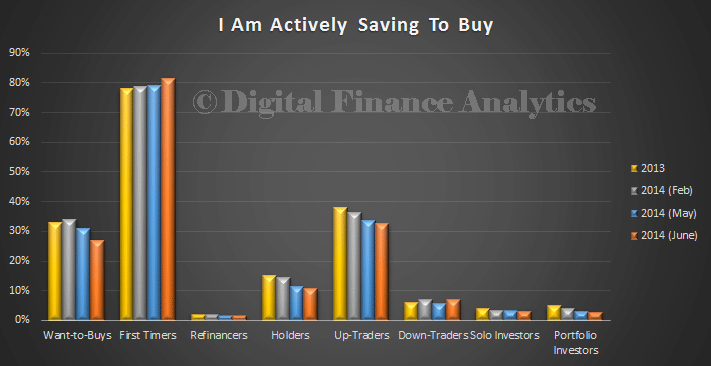
 So, next we turn to the active households and begin to look at the more detailed data. We start by looking across our segments, later we will dive more deeply into specific segmental analysis. We start with saving activity trends over time. We see that first time buyers (defined as those seeking to buy for the first time) are still saving hard, but other segments are less inclined or less able to save to purchase a property. Want to buy households (defined as those who would like to buy, but who cannot), are less likely to save than in 2013.
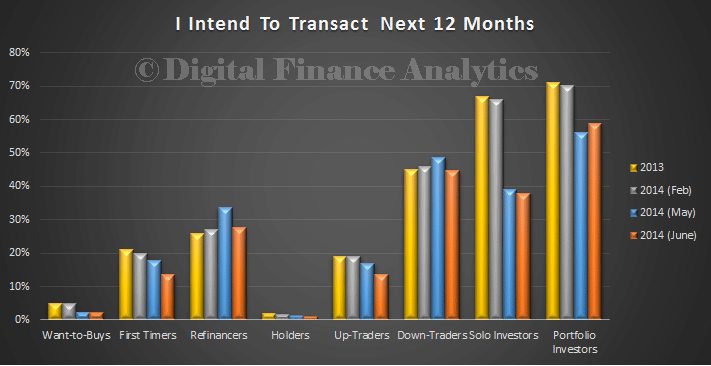
 Looking at transaction intentions over the next 12 months, we see a significant fall in those investors expecting to enter the market. First time buyers are still being squeezed out, and those seeking to refinance an existing loan are now slightly less likely to transact. Down traders are still active (these are households seeking to sell to buy a smaller property, to release capital, or other factors), though we detect a slowing here too. Therefore we predict that demand for property will decline from recent levels in coming months. This is especially the case in New South Wales and Victoria.
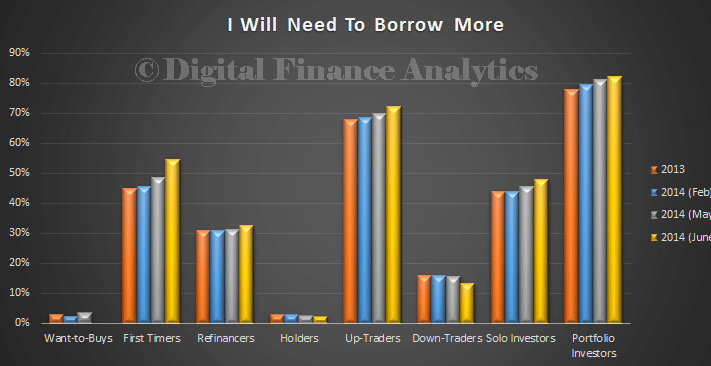
 Looking next at borrowing intentions, we see that property investors and up traders are most likely to seeking funding. First time buyers are needing to borrow more also, though as highlighted above they are less likely to transact. Therefore we expect to see some ongoing demand for investment housing funding, but at lower levels than those we saw last year. Funding for owner occupation will likely grow more slowly.
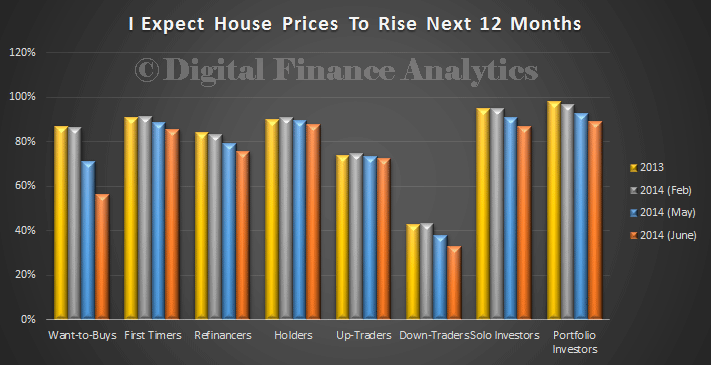
Finally, today we look at house price growth expectations. Overall expectation are still quite bullish, but we see a general small fall in the households who believe that house prices will rise in the next 12 months. Down traders are the least bullish.
 So our initial findings highlight that we expect momentum in the property market to ease in coming months, even before any interest rate rise. In fact we think that the fall in momentum may postpone potential rate rises, and may begin to turn expectations towards a rate cut, especially if the proposed budget cuts are passed, and the international political scene gets more unstable.
Next time we will start to look at segment specific factors, as each segment exists in its own micro market, and dynamics are quite different.
One thought on “Property Inactive Households Rise Again, As Market Outlook Slows”