ME Bank ‘Forced’ to Hike Mortgage Interest Rates – More Banks Will Follow

More evidence of the rising costs of funds as ME Bank says it has lifted its standard variable rate on existing owner-occupier principal and interest mortgages, effective today, 19 April 2018.

ME’s standard variable rate for existing owner-occupier principal-and-interest borrowers with an LVR of 80% or less, will increase by 6 basis points to 5.09% p.a. (comparison rate 5.11% p.a.^).

Variable rates for existing investor principal-and-interest borrowers will increase by 11 basis points, while rates for existing interest-only borrowers will increase by 16 basis points.

ME CEO Mr Jamie McPhee said the changes are in response to increasing funding costs and increased compliance costs.

“Funding costs have been steadily increasing over the last few months primarily due to rising US interest rates that have flowed through to higher short-term interest rates in Australia.

“In addition, ME continues to transition its funding mix to ensure the requirements of the Net Stable Funding Ratio will be met, and this is also increasing our funding costs.

“At the same time, industry reforms and increasing regulatory obligations are increasing our compliance costs.

“Despite these increases ME’s standard variable home loan for owner-occupier principal-and-interest borrowers with LVR 80% or less, is still lower than the major banks as it has been since ME became a bank in 2001. In addition ME also continues to offer some of the highest deposit rates in the market.

“This was not an easy decision, but rising costs have forced us to reset prices to maintain a balance between borrowers, depositors and our industry super fund shareholders and their members, all while ensuring we continue to grow and provide a genuine long-term banking alternative,” McPhee said.

“We will continue to assess market conditions and make changes to prices to maintain this balance if necessary.”

More hikes will follow, across the industry together with reductions in rates paid on deposits as the fallout of the Royal Commission and higher international funding costs take their toll.

The 10-year US Bond rate is moving higher again, following some slight fall earlier in April. Have no doubt, funding cost pressure will continue to rise.

^Home loan comparison rates calculated on a loan of $150,000 for a term of 25 years, repaid monthly.

730 Does AMP, CBA At The Royal Commission

A segment broadcast 18 April 2018 discussing the issues raised in the inquiry, and shortcomings of the regulator.

More evidence of bankers behaving badly (on purpose) and regulators “asleep at the wheel”.

And remember the number of financial planners continues to increase..

Later in the evening, Matter of Fact went further into the structural issues arising.

Small Business Finance Roundtable

The Reserve Bank hosted a roundtable discussion on small business finance today, along with the Australian Banking Association and the Council of Small Business Australia. The roundtable was chaired by Philip Lowe, Governor of the Reserve Bank.

Small businesses are very important for the economy. They generate significant employment growth, drive innovation and boost competition in markets. Access to external finance is an important issue for many small businesses, particularly when they are looking to expand.

Our own SME survey highlights the problems SME’s face in getting finance in the face of the banks focus on mortgage lending.  The latest edition of our report reveals that more than half of small business owners are not getting the financial assistance they require from lenders in Australia to grow their businesses.

The aim of the roundtable was to provide a forum for the discussion of small business lending in Australia. The participants included entrepreneurs from the Reserve Bank’s Small Business Finance Advisory Panel along with representatives from financial institutions, government and the financial regulators.

The challenges faced by small businesses when borrowing were discussed. The entrepreneurs highlighted a number of issues, including:

  • access to lending for start-ups
  • the heavy reliance on secured lending and the role of housing collateral and personal guarantees in lending
  • the loan application process, including the administrative burden
  • the ability to compare products across lenders and to switch lenders.

The participants discussed a range of ideas for addressing these challenges. Financial institutions shared their perspectives and discussed some of the steps that are being taken to address concerns of small business. The roundtable heard some suggestions about how to improve the accessibility of information for small businesses about their financing options. The roundtable also heard from the Australian Prudential Regulation Authority regarding the proposed revisions to the bank capital framework that relate to small business lending.

The roundtable discussed some other policy initiatives that are currently underway, including the introduction of comprehensive credit reporting and open banking. Participants agreed that these initiatives could help to improve access to finance, and the Reserve Bank will continue to monitor developments closely.

Background

The Small Business Finance Advisory Panel was established by the Reserve Bank in 1993 and meets annually to discuss issues relating to the provision of finance, as well as the broader economic environment for small businesses. The panel provides valuable information to the Reserve Bank on the financial and economic conditions faced by small businesses in Australia.

The Reserve Bank has previously hosted discussions on small business finance issues, including a Small Business Finance Roundtable in 2012 and a Conference on Small Business Conditions and Finance in 2015.

The Australian Banking Association, along with the Australian Council of Small business, representatives for member Banks and other stakeholders were also in attendance to bring their own perspective on the issues and to answer questions. The event was agreed to and organised at the end of last year.

Australian Banking Association CEO Anna Bligh said that the Roundtable was an important opportunity for Australia’s banks to listen first hand to the needs of small business.

“Small business is the engine room of the Australian economy, accounting for more than 40% of all jobs or around 4.7 million people,” Ms Bligh said.

“This Roundtable was an important step in building the relationship between banks, small businesses and their representatives.

“Banks are working hard to better understand the needs of business, their challenges and how they can work with them to help them achieve their goals,” she said.

Household Finance Confidence Slides Again In March

The latest Digital Finance Analytics Household Finance Confidence Index for March 2018 shows a further slide in confidence compared with the previous month.

The current score is 92.3, down from 94. 6 in February, and it has continued to drop since October 2016. The trend is firmly lower.

Across the states, confidence is continuing to fall in NSW and VIC, was little changes in SA and QLD, but rose in WA.

Across the age bands, there were falls in all age groups.

Turning to the property-based segmentation, owner occupied householders remain the most confident, while property investors continue to become more concerned about the market. Those who are property inactive – renting, or living with parents or friends remain the least confident. Nevertheless those who are property owners remain more confident relative to property inactive households.

We can look at the various drivers which underpin the finance confidence index.

We start with job security. This month, there was a rise 6% in households who are less confident about their job security compared with last month,  up to 25.8%. Those who felt more secure fell by 1.5% to 12.1% while 61% saw no change. Availability of work was a primary concern, but the security concerns were more around job terms and conditions, and the requirement to work unsocial hours and weekends.

Turning to concerns about levels of debt, 44.5% of households were more concerned about their outstanding loans, up 1.5% from last month. Under 3% of households were more comfortable with the debt they hold. 49% reported no change this month. Those who were more concerned about debt highlighted concerns about higher interest rates, and the ability to service their current loans in a flat income environment.

52% of households reported their incomes had fallen in the past month, in real terms. This is up 1.5% this month. Just over 1% of households reported a pay rise, and 43% reported no change in real incomes.  More households comprise of members who are working multiple jobs to maintain income.

In contrast, cost of living continues to rise faster than incomes for many households. 77% of households said their costs had indeed risen, up slightly from last month. 18% of households said costs had stayed the same and 3% said costs had fallen. Households said the costs of electricity, petrol, school fees and child care costs all hit home.  Health care costs, and especially the costs of private health care cover also figured in their responses.  More households are seriously considering terminating their health insurance cover due to the rising expense.

Turning to savings, 46% of households were less comfortable with their savings a rise of 1.5% compared with last month. 4% were more comfortable. 50% were about the same. There were ongoing concerns about further falls in interest rates on deposit accounts, and the need to continue to raid savings to support ongoing household budgets.

Finally, we look at household overall net worth. Despite the volatility seen in the financial markets, the main concern captured in answers to this question related to potential falls in property values. 52% said their total net worth was higher, down 3% from last month. 18% said their net worth was lower, a rise of 2% compared with last month. 28% remained the same.  Both those with higher levels of education, and males tended to report more of a rise in net worth. Women were considerable more concerned about the current  trajectory of home prices, and the risks relating to future falls.  Households in regional centres remained more concerned about their net worth, not least because in many areas home prices have risen less strongly in recent years.

So in conclusion, based on the latest results, we see little on the horizon to suggest that household financial confidence will improve. We expect wages growth to remain contained, and home prices to slide, while costs of living pressures continue to grow. There will also be more pressure on mortgage interest rates as funding costs rise, and lower rates on deposits as banks trim these rates to protect their net margins.

By way of background, these results are derived from our household surveys, averaged across Australia. We have 52,000 households in our sample at any one time. We include detailed questions covering various aspects of a household’s financial footprint. The index measures how households are feeling about their financial health. To calculate the index we ask questions which cover a number of different dimensions. We start by asking households how confident they are feeling about their job security, whether their real income has risen or fallen in the past year, their view on their costs of living over the same period, whether they have increased their loans and other outstanding debts including credit cards and whether they are saving more than last year. Finally we ask about their overall change in net worth over the past 12 months – by net worth we mean net assets less outstanding debts.

We will update the index next month.

Preparing for the Switch

From Australian Broker.

Interest only loans are rarely out of the news. Following ASIC’s interim review the September quarter posted a knee-jerk 44.8% decline in new IO loans and lending practices are now firmly in the regulator’s crosshairs. APRA and RBA have already clamped down and further scrutiny is expected during the royal commission.

The regulators aren’t the only ones concerned. In February, assistant governor Michele Bullock delivered a speech on mortgage stress in which she highlighted a “large proportion of interest-only loans are due to expire between 2018 and 2022”.

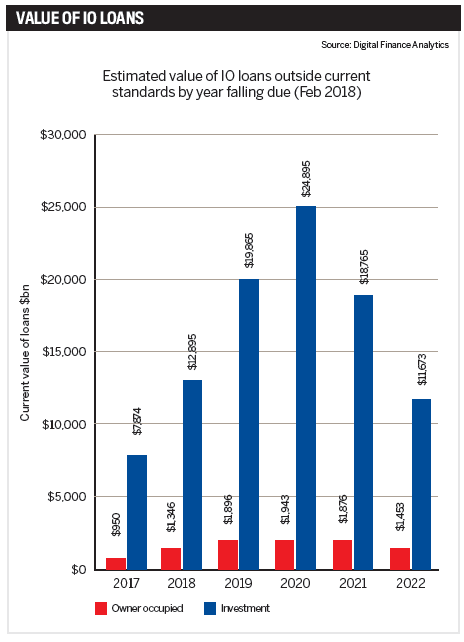
That large proportion is, in fact, almost every IO loan written between 2013 and 2016, and subsequent analysis of IO property fixed-term lending by Digital Finance Analytics has calculated the total number at 220,000, with values upwards of $100bn.

These loans originate from before the reviews of 2015 and 2017, and in the coming year the fixed terms on 14% of them will face a reset outside of current lending criteria. By 2020, the value of loans due for renegotiation is expected to reach $27bn.

While there are many options open to these borrowers, Bullock calls it an “area to watch”, saying many could find themselves in financial stress.

“Some homeowners may not realise they are fast approaching the end of their five-year term and, if they do nothing, their lender will automatically roll them onto a P&I loan that could be challenging for them to support,” says Zippy Loans’ principal broker Louisa Sanghera.

“Combine this scenario with a slowing of the property market and clients may not have the buffer of equity to soften the blow.”

To the customer, interest-only is an attractive proposition for a number of reasons, from freeing up cash to tax incentives. Additionally, investors have widely financed rental property investments on an IO basis while paying down their owner-occupied P&I loan. Executive director of The Local Loan Company, Ray Hair, observes that it’s a decades-long trend, one that has taken place right under the radar of regulators and banks.

To date, availability has largely driven demand for IO, but with many borrowers now preparing to face the consequences of their honeymoon financial planning, a mounting collection of horror stories could change that.

“Whenever regulators initiate corrective action in a market there is an initial period of over correction, however the pendulum generally swings back to a position of equilibrium. Sadly, this is of little comfort to those caught out by the overnight changes in policy, increased interest rates and institutional disregard for the personal cost,” says Hair.

“Expect to see some very angry investors looking for a lender, broker or adviser to blame, and pay compensation” Ray Hair, The Local Loan Company

Major lenders are preparing their broker networks for further changes to lending criteria, and are actively assessing the terms of loans due to expire to 2022. But with many below the cap and borrowers looking for IO products, the call to return to business as (almost) usual has been too strong to resist.

“We have seen several major lenders loosen the reigns and cut the rates for interest-only loans again, likely because they are sitting below the cap and are looking to add more interest-only loans to their books. It will be interesting to observe whether other lenders follow and how this plays out in terms of consumer behaviour,” says Uno Home Loans CEO Vincent Turner.

The mortgage crunch

In January, UNSW professor of economics Richard Holden published a sobering observation of Australia’s relationship with high-LVR and IO loans. In it he reported Australian banks lend an average 25% more than their US counterparts and that these loans are poorly structured and sometimes based on falsified or inaccurate household finances.


A decade ago, US banks learned this lesson the hard way, when five-year adjustable rate mortgages could not be refinanced and the fallout triggered a chain reaction that dragged most of the globe into recession.

In Australia, IO lending has comprised as much as 40% of the loan book at the major banks, and a particularly large share of property investors choose IO. The number of new IO loans is in overall decline, $156bn borrowed in 2015 to $135.5bn in 2017, but their share is still significant. In the owner-occupier market they count for one in four loans, and in the investor market it’s two in three.

“Interest-only loans in Australia typically have a five-year horizon and to date have often been refinanced. If this stops then repayments will soar, adding to mortgage stress, delinquencies, and eventually foreclosures,” Holden told Australian Broker at the time.

“It’s our professional and ethical obligation to look after the best interests of our clients and help them plan strategies” Louisa Sanghera, Zippy Loans

A teacher at the University of Chicago when the US housing market crashed, he added, “The high proportion is similar to the high proportion of adjustable rate mortgages in the US circa 2007.”

So how scared should people be? According to Hair, a lot of people “should be very afraid”, although he says dynamic lending policies, a banking sector unwilling to lose market share and strength in non-bank lenders will dampen some impact.

Quoting the DFA data, he adds, “Unfortunately, there will be pain for highly leveraged borrowers with negative equity, as there has been in the past with an oversupply of apartments, restrictions on non-resident lending and the fall
in property values in mining-dependent regional towns.”

For Turner, the concerns are overstated on a macro level, and reasonable lead times for a switch are all most borrowers will need. However, he warns, “The bigger concern should always be unemployment that triggers substantial hardship, very quickly across a broad group of people, which has the effect of contagion.”

Hero or villain?

While there are many unknowns in how borrowers and lenders will cope with the switch to P&I, what is known is that brokers could find themselves very busy between now and 2022.

“It’s our professional and ethical obligation to look after the best interests of our clients and help them plan strategies that are sustainable and supportive of their personal financial goals,” says Sanghera, who predicts a “positive impact overall” for brokers.

At Zippy Loans active management of IO customers means the lender has very few of the loans on its books. Responding to the rises in interest rate charges over recent months, Zippy has contacted its IO clients to move them onto a workable P&I solution.

“Clients will need to consider a broader range of lending options to find a product that works for them and brokers are ideally placed to research these options on their behalf. I believe this will result in more people turning to brokers to navigate the ever-more complex market place and secure the right solution,” she adds.

Throughout this process, transparency will be key, as Turner notes, “Brokers who continue to push expensive interest-only loans will probably lose business to those who show their customers when P&I works and when IO is the better option. In most cases it isn’t.”

However, brokers will also be the bearers of bad news as some are forced to sell and, according to Hair, it’s likely a lot of disgruntled borrowers will pursue their brokers in the courts, as many have done before when things have not gone their way.

Advising brokers to keep “well documented notes” of original transactions and borrower objectives, as well as subsequent attempts to refinance, he says: “Brokers will be both the heroes and the villains in this pantomime.”

“Expect to see some very angry investors looking for a lender, broker or adviser to blame, and pay compensation, for the position they find themselves in,” he adds.

Is this Australia’s sub-prime crisis? From those in the industry it’s a unanimous no. However that doesn’t mean to say a significant number of borrowers won’t receive a harsh wake-up call.

“The bigger concern should always be unemployment that triggers substantial hardship … which has the effect of contagion” Richard Holden, UNSW

For Holden, the damage has already happened and recent measures are too little too late. Although he refers to tighter lending standards as “comforting”, he says the 30% cap is “about all that can be done” at this point.

Australia’s smaller lenders lack the resources to manage more of the IO debt burden, meaning a mass exodus of customers away from the majors is unlikely. That doesn’t mean to say the majors won’t step up to the potential competition. As Hair predicts,
this could bring some attractive offers for borrowers looking to switch or refinance.

For now, it’s all eyes on the interest rate. On the one hand, no change in the cash rate for 19 months has manufactured a level of stability, on the other it’s delayed the hangover. The IMF has already advised implementation of US-style signalling for potential hikes, although after the last month there is some way to go before reaching the 4% rate it expects to see by late 2019.

Regardless of what happens, some pockets of stress are expected.

Within the industry, brokers have a chance to step up and guide customers through the uncertainties, but the watchful eyes of the regulators will be on them.

A $100bn question remains: how wealthy is the average Australian borrower? Those writing the rulebook say wealthy enough to cover higher mortgage payments. Those who have seen the cycle play out elsewhere, say otherwise.

Canada’s housing prices just stalled for the first time outside of a recession

From Business Insider.

Canadian real estate prices are acting a little skittish. The TeranetNational Bank House Price Index, shows real estate prices stalled across the country. In addition, the index is making moves we haven’t seen outside of a recession.

Tera-What?

If you’re a regular reader, feel free to skip this. For those that don’t know, The Teranet-National Bank HPI is a different measure of real estate data, that relies on property registry information instead of sales. Many misinformed agents refer to this as a “delayed” measure, but that’s not the case. The use of registry data means that the information is “late” compared to the MLS, but it’s more accurate.

Using registry information means only completed sales are included. In contrast, the MLS uses just sales. In a hot market, few sales fall through, so the MLS is definitely a faster read. In a cooling market, sales can start to fall through, as some buyers look for a way out while prices drop. This is often not reflected in MLS data, since a transfer occurs 30 to 90 days after a sale. They each have their trade offs, and neither is better or worse than they other. If you’re really into housing data, it’s best to check both to get a real feel for the market.

Screen Shot 2018 04 16 at 2.59.24 PM 

Canadian Real Estate Prices Are Unchanged

Canadian real estate prices didn’t do a whole lot in March. The 11 City Composite index remained virtually unchanged compared to February. Prices are up 6.61% compared to the year before. National Bank analysts noted this is “the first time outside a recession when the March composite index was not up at least 0.2%” It was also the first time that only 4 out of the 11 markets saw an increase, outside of a recession. The unusual move is definitely worth noting from a macro perspective.

Screen Shot 2018 04 16 at 3.00.13 PM 

Toronto Real Estate Prices Are Flat

The Toronto real estate market has no idea what to do right now. The index showed prices remained flat from last month, and up 4.31% from last year. Prices are down 7.3% from the July peak when adjusted, and 7.9% when non-adjusted. This is the lowest pace of annual price growth since November 2013.

Screen Shot 2018 04 16 at 3.01.33 PM 

Funny thing to note is experts, including some bank executives, are saying the correction is over. Technically speaking, a correction hasn’t even begun according to this index. A correction is when prices fall more than 10% from peak, in less than a year, which we haven’t seen yet. If I didn’t know any better, it would appear that mortgage sellers bank executives are misinformed. How strange.

Vancouver Real Estate Prices Hit A New All-Time High

Vancouver real estate prices, driven entirely by condo appreciation, hit a new all-time high. Prices increased 0.5% from the month before, and are up 15.43% from the same month last year. Prices on the index showed monthly increases in 13 of the past 15 months. Teranet-National Bank analysts noted that gains are tapering, and this is “consistent with the Real Estate Board of Greater Vancouver.”

Screen Shot 2018 04 16 at 3.02.15 PM 

Montreal Real Estate Prices Drop 0.2%

The market brokerages have been attempting to rocket, appears to be a failure to launch. The index showed that prices declined 0.2% in March, and are up just 4.27% from the same month last year. Annual price increases peaked in December at just under 6%, and has been tapering ever since. Technically speaking, Montreal has yet to outperform the general Canadian market. Despite what you may have read in Montreal media.

Screen Shot 2018 04 16 at 3.02.53 PM 

Canadian real estate prices are acting unusual compared to movements typically made outside of a recession. However, they are moving in a typical real estate cycle. A gain as large as we’ve seen nationally, has never not been followed by a negative price movement. Try to act surprised when you see it. Bank economists will.

More Cultural Badness From The Finance Sector.

Today we take a look at the latest from the Royal Commission into Financial Service Misconduct, which recommenced its hearings yesterday again, with a focus on the Financial Planning Sector.

Financial Advisers provide advice on a range of areas of consumer finance, investing, superannuation, retirement planning, estate planning, risk management, insurance and taxation.

ASIC says between 20 and 40% of the Australian adult population use or have used a Financial Planner.  That means that around 2.3 million Australians over 18 received advice. A number of issues have surfaced in recent years, including charging fees for no service, or advice not provided in full, the provision of inappropriate financial advice, as well as improper conduct by financial advisors and the misappropriation of customer’s funds.

There has been massive growth in the number of financial advisers, to more than 25,000 up 41% from 2009.  5,822 Financial Advice licences were issued in Australia to firms able to offer advice. What you may not know is that the top five players in Financial Advice in Australia are the big four banks and AMP, who together have nearly 48% of the $4.6 billion dollars in annual revenue.  30% of advisers work for one of the major banks and 44% work for the top 10 organisations by revenue, so it is very concentrated. Then there is a long tail of smaller organisations with 78% operating a firm with less than 10 advisors. The average advice licence covers 34 individuals operating under it.

There have been a number of significant scandals relating to the provision of financial advice in recent years.

Townsville based Storm Financial encourage investors to borrow against their home to invest in indexed share funds, in a “one size fits all model” of advice. Storm collapsed in 2009 will losses of more than $3 billion dollars. Around 3,000 of its 14,000 clients had suffered significant losses. Many of the investors were retired or about to retire, and with limited assets and income. Some lost their family homes or had to postpone their retirement. The founders were found to have caused or permitted inappropriate advice to be given and had breech their duty of care under the corporations’ act. Specifically, the one size fits all model of advice failed to take into account individual circumstances which led to devastating consequences for the individual investors. They had focused too much on the profitability of the business as opposed to the best interests of individual investors. ASIC worked with a number of major players for customers who had made investments through Storm. CBA undertook to make $136 million dollars in compensation to many CBA customers who borrowed from the bank to invest through Storm and who had suffered financial losses. This is in addition to $132 million CBA paid under the Storm resolution scheme.  ASIC looked at settlements distributed by Macquarie Bank to Storm investors leading to a revised agreement where the bank agreed to pay $82.5 million by way of compensation and costs. Bank of Queensland agreed to pay $17 million as compensation for Storm related losses.

The second scandal involved Commonwealth Financial Planning Limited. A whistle-blower revealed allegations of misconduct within CFL to ASIC in 2010. It was suggested that some advisers were encouraging investors to invest in high risk, but profit generating products which were not appropriate. Some were even switching products without the client’s permission. This also included forging client signatures. When the GFC hit in 2008, thousands of CFL clients, many of whom were nearing or in retirement, lost significant amounts as a result of this misconduct.   More than $22 million was paid to clients in compensation for receiving inappropriate financial advice from two financial planning advisers. Later it became evident the misconduct was more widespread so CBA implemented a second programme of compensation relating to advice from advisers. Their Open Advice programme had conducted more than 8,600 assessments, of which more than 2,500 required compensations to a total of $37.6 million has been offered.

So turning to the hearings. First up was Peter Kell from ASIC who described the “Fee for no service” problem.

The Future of Financial Advice reforms (FOFA) has tightened the rules, but the fees can be significant. And as we will see, some players simply took the fees to bolster their profits.

Next up was AMP, and we heard over the next day or so of more than 20 occasions when AMP failed in their duty to notify ASIC of a number of potential breaches.

Despite the fact AMP was aware of a range of issues they simply allowed the practices to continue.  There was an absence of monitoring activities, what AMP said it was going to do to ASIC, e.g. training for staff in new procedures was different from what they actually did.  The issues had been occurring since 2009, and AMP acknowledge that on at least 20 occasions they made false and misleading statements to ASIC about potential breeches.

Worse, the Royal Commission revealed today that AMP’s law firm, Clayton Utz, removed outgoing chief executive Craig Meller’s name from a draft of a critical report about the business.

So once again we see the cultural norms in financial services driving poor behaviour, which may bolster profits but at the expense of their customers, and an apparent willingness to avoid the issues with the regulators. This is shameful, but not surprising.

So we see mismanagement again, and failure of regulation.

We suspect we will see more of the same in the day ahead. Frankly I am not surprised because the cultural norms we see displayed here are precisely the same as were observed in the previous lending related hearings. The quantum of change required within our financial services organisations is profound and I also believe the scope of the Royal Commission should be expanded to include the role and function of our regulators.

Multiple failures are clearly costing households dear. But then the companies seem willing to cop the settlements, and move on, without root cause analysis and fixing the problem. This is not acceptable behaviour in my book and is well below community expectations.

Has The Next Asset Collapse Begun?

From  Econimica

After nearly a half century of unlimited dollar creation, multiple bubbles and busts…the current asset reflation has been the most spectacular…but alas, perhaps too successful.

The Fed’s answer to control or restrain this present reflation is raising interest rates to stem the flow of business activity, lending, and excessive leverage in financial markets.  But in the Fed’s post QE world, a massive $2 trillion in private bank excess reserves still waits like a coil under tension, ready to release if it leaves the Federal Reserve.  Thus, the only means to control this centrally created asset bubble is to continuously pay banks higher interest rates (almost like paying the mafia for protection…from the mafia) not to return those dollars to their original owners or put them to work.  With each successive hike, banks are paid another quarter point to take no risk, make no loan, and just get paid billions for literally doing nothing.

The chart below shows the nearly $4.4 trillion Federal Reserve balance sheet, (acquired via QE, red line), nearly $2 trillion in private bank excess reserves (blue line), and the interest rate paid on those excess reserves (black line).  While the Fed’s balance sheet has begun the process of “normalization”, declining from peak by just over a hundred billion, bank excess reserves have fallen by over $700 billion since QE ended.  So what?


The difference between the Federal Reserve balance sheet and the excess reserves of private banks is simply pure monetization (the yellow line in the chart below).  This is the quantity of dollars that were conjured from nothing to purchase Treasury’s and mortgage backed securities from the banks.  But instead of heading to the Fed to be held as excess reserves, went in search of assets, likely leveraged 2x’s to 5x’s (resulting anywhere from $3 trillion to $7.5+ trillion in new buying power).


From world war II until 1995, equities were closely tied to the disposable personal income of the American citizens (DPI representing total annual national income remaining after all taxation is paid, blue line).  However, since ’95 lower and longer interest rate cuts have induced extreme levels of leverage and debt.  The Fed actions have created progressively larger asset bubbles more divergent from disposable personal income at peak…but falling below DPI during market troughs.  But after the ’07 bubble, the pure monetization found its way into the market with spectacular effect.  As the chart below shows, the Wilshire 5000 (representing the market value of all publicly traded US equities, red line) has deviated from the basis of US spending, US total disposable income (the total amount of money left nationally after all taxes are paid, blue line).

In the chart below, the growth in monetization has acted as a very nice leading indicator for equities.  As each successive pump of new money left the Federal Reserve and entered found its way to the market in search of assets, assets subsequently reacted.  Likewise, each drawdown in monetization saw a similar pullback in equities.

What happens next?  The Federal Reserve plans to systematically reduce its balance sheet via raising interest rates on excess reserves.  This is to incent and richly reward the largest of banks to maintain these trillions at the Federal Reserve.  As the chart below shows, theoretically this means the monetized money is set to continue evaporating, and assuming it was highly levered, then the unwind and volatility of deleveraging should only continue to worsen.

And…if the Federal Reserve is true to its word and even halves its balance sheet while banks maintain the excess reserves at the Fed, then all the digitally conjured $1.5 trillion is set to be “un-conjured”.  Again, assuming the monetized monies were at least somewhat levered, the unwind of that leverage will continue to produce a chaotic and volatile slide in markets.  As the chart below suggests, if US equities (and broader assets) follow the unwind of the monetization, then equities are likely on their way back down to and through their natural support line, disposable personal income.  Conversely, I’ve included the 7.5% long term anticipated market appreciation for reference (green dashed line).  Quite a spread between those differing views on future asset valuations.

Of course, the “data dependent” Fed could change its mind, or perhaps banks will continue to pull those excess reserves and put them to work (with growing leverage) rather than take the risk-free money from the Fed…either way this is something worth watching.

ABA Says Banking Reforms Progressing At Cracking Pace

The ABA says today’s release of the final report of independent governance expert, Mr Ian McPhee AO PSM, shows that Australia’s banks have made significant progress on the Better Banking Reform Program, including finalising many of its measures.

The program, which began in April 2016, outlined a range of changes and initiatives to achieve three outcomes – better products, better service and better culture. Banks have been implementing these reforms over the last two years, with Mr McPhee independently monitoring their program as part of the industry’s commitment to accountability and transparency.

A major part of this reform has revolved around changes to the way banks pay their staff, as outlined in the Sedgwick Review completed in 2017. These changes include removing direct sales incentives, abolishing mortgage broker commissions directly linked to loan size and introducing balanced scorecards in each bank. The review set a deadline for these changes to be completed by 2020 however banks are already well underway in implementing these reforms.

Australian Banking Association CEO Anna Bligh thanked Mr McPhee for his expert oversight over the last two years providing independent governance advice and monitoring for the ambitious industry reform program.

“Ian McPhee and Price Waterhouse Coopers have done a rigorous job over the last two years in their independent monitoring of the implementation of the Better Banking Reform Program,” Ms Bligh said.

“The industry has set a cracking pace on some of the toughest reforms in over a decade, as detailed in Mr McPhee’s final report, however there is still further work to be done to bed these down.

“Banks have made a large investment in reform to better meet community expectations, such as changing the way bank staff are paid and improving customer protections under the new Banking Code.

“Banks are on track to meet the 2020 deadline set by the Sedgwick Review to reform the way they pay their staff including abolishing direct sales incentives and scrapping mortgage broker commissions directly linked to loan size.

“While this is the final report by Ian McPhee the industry has taken his advice and will be putting in place further arrangements for public reporting.

“Banks will be making further regular public reports on the success of the program and their ongoing implementation of the Sedgwick recommendations and the new Banking Code,” she said.

Key initiatives already implemented include:

  • Customer advocates within banks to ensure complaints are resolved quickly and fairly
  • Improving protections and awareness of processes for whistleblowers, including best practice industry guidelines
  • Stamping out poor conduct in the industry by ensuring staff with records of poor behaviour do not simply move around the industry.

Bank of Queensland 1H 18 Results – Meh!

Bank of Queensland (BOQ) has announced cash earnings after tax of $182 million for 1H18, up 4 per cent on 1H17. This is weaker than expected. They continue to bat on a sticky wicket. Being a regional bank is a tough gig! The BOQ Board has maintained a fully franked interim dividend of 38 cents per ordinary share.

Statutory net profit after tax increased by 8 per cent to $174 million.

Net Interest Margin was up 1 basis point on the prior half to 1.97%, helped by loan book growth and deposit repricing, but under pressure thanks to intense new mortgage loan discounting. Growth in overall NIM was lower than expected. Ahead we think the higher BSBW rates will impact NIM adversely alongside discounted attractor rates..

In addition, lower than expected non-interest income hit the result, thanks to an ATM fee impact of $0.6m, banking fees under pressure and a fall in trading income opportunities.

Also higher than expected costs impacted the result. Their Cost to Income ratio was up 20 bps to 47.6%

BOQ also today announced the sale of St Andrew’s Insurance to Freedom Insurance Group. More detail on this transaction is provided in a separate announcement. The CET1 uplift was estimated at 20 basis points after completion, with completion expected in second half of the year.

The Banks says there has been a notable improvement in lending growth, continuing the positive business momentum that returned in the previous half. This was supported by the commercial niche segments, as well as home loan growth through the Virgin Money, BOQ Specialist and BOQ Broker channels. Total lending growth of $671 million in 1H18 represents an uplift of more than $800 million compared to the contraction of $157 million in 1H17.

This has been delivered through 3 per cent annualised housing loan growth (+$382 million) at 0.5x system, together with strong commercial loan growth of 6 per cent annualised (+$292 million), which was 1.6x system.

They show that broker settlements increased to 30%, including via Virgin Money, whilst the proportion of investment loans rose to 39%, compared with 30% a year ago. Interest only loans were 16% of flows, compared with 38% a year ago, and represents 32% of their portfolio.  The average loan balance has risen to $394k and the weighted average LVR on new loans was 68%.

“We moved to adopt enhanced servicing, validation and responsible lending practices much earlier than many of our peers” the bank said.

“Although this has hampered our growth in prior periods, we think it was the most prudent approach to take for the long term,” he said.

Impaired assets as a percentage of gross loans were down to 39 basis points, while loan impairment expense was just 10 basis points of gross loans during the half.

Arrears levels remained benign across all portfolios and there were signs of improvement in the Queensland and Western Australian economies. But they noted an uptick in the most recent quarter in housing …

… and consumer credit.

They also showed potential construction exposure to apartments – at $90m, at 16 developments across 3 states completing 2018 to 2019. They observed this was a well diversified cross-state portfolio.  But $53m is in Victoria.

They also have $100m exposure to the mining sector.

Loan impairment rose, but remained at 10 basis points of GLA. Impaired assets fell a further 10% from 2H17 and new impaired asset volumes also reduced to the lowest level since pre-2012.

Specific provisions were increased to 57%.

They say total provisions remain strong and provisional coverage compares favorably with peers.

BOQ’s capital position has been maintained. The CET1 ratio was up 3 basis points over the half to 9.42 per cent.

The bank said that the recent Basel and APRA papers suggest BOQ’s current CET1 ratio positions it well for the changes that are coming.

Ahead, they said that the industry was facing a number of headwinds, but BOQ remains well placed.

“The industry faces challenges of low credit growth, low interest rates, regulatory uncertainty, increasing consumer expectations and increased scrutiny of conduct and culture.

“In this environment, our long term strategy remains the right one; we are building out our business bank in higher growth sectors of the economy and opening up new retail channels.

“We also remain focused on our customers, investing in a number of initiatives across the group that will improve our digital offering, bring us closer to our customers and enable us to provide them with a differentiated service offering.

“Our very strong capital position provides us with flexibility to consider options that will deliver the best value to our shareholders,”