A new campaign is encouraging Australians to ’Own Your Banking’ and to look at the benefits of customer owned banking. It includes a range of digital advertising, designed to highlight the benefits of Customer Owned Banks. We highlighted the opportunity for COBA aligned organisations in our recent post.
The Customer Owned Banking Association launched the campaign today following increased interest and demand from customers for banking they can trust.
“Own Your Banking is a direct response to our members telling us they’ve seen an uptick in customer interest and enquiries because people are shocked by stories they’ve been hearing in the Royal Commission,” COBA CEO Michael Lawrence said.
“Our model is the only alternative that can claim it is solely customer focused because 100% of profits are used to benefit customers. This is what we’re communicating through the ‘Own your Banking’ campaign.
“4 million Australians already own their banking – they are customers of mutual banks, credit unions and building societies across Australia.
“We hope ‘Own Your Banking’ will let consumers know there are plenty of alternatives in the Australian banking market that can be trusted to put them first.
“There are more than 70 mutual banks, credit unions and building societies located across Australia. We are market leaders in customer satisfaction and offer award winning home loans and low rate credit cards.
“We encourage consumers to take a look at our campaign and learn more about how to Own Your Banking.”
The bank bill swap rate (BBSW) rate is a major interest rate benchmark for the Australian dollar and is widely referenced in many financial contracts. Previously, BBSW was calculated from the best executable bids and offers for Prime Bank securities. A major concern over recent years has been the low trading volumes during the rate-set window, the period over which the BBSW is measured.
The new BBSW methodology calculates the benchmark directly from market transactions during a longer rate-set window and involves a larger number of participants. This means that the benchmark is anchored to real transactions at traded prices. ASX, the administrator of BBSW, has consulted market participants on this new methodology. In addition, the ASX has recently conducted a successful parallel run of the new methodology against the existing method.
RBA Deputy Governor Guy Debelle said, ‘The new methodology strengthens BBSW by anchoring the benchmark to a greater number of transactions. This should help to ensure that BBSW remains robust.’
ASIC Commissioner Cathie Armour said, ‘A transaction-based BBSW supports the market’s trust in the robustness and reliability of BBSW.’
‘ASIC and the RBA expect all bank bill market participants – including the banks that issue the bank bills, as well as the participants that buy them – to adhere to the ASX BBSW Guidelines and support the new BBSW methodology. The rate-set window is the most liquid period in the bank bills market, and market participants are therefore likely to get the best outcomes for their institutions and their clients by trading during this time.’
‘We expect market participants to put in place procedures so that as much trading as possible happens during the rate-set window.
This change follows passage through the Parliament in March of legislation that puts in place a framework for licensing benchmark administrators. Consistent with the approach taken in a number of other jurisdictions, it also made manipulation of any financial benchmark, or products used to determine such a benchmark, a specific offence and subject to civil and criminal penalties.
ASIC intends shortly to make financial benchmark rules, on which ASIC consulted in 2017. ASIC also expects to declare BBSW, and a number of other financial benchmarks, as ‘significant benchmarks’ in Australia and to license the administrators of those significant benchmarks.
The rapid growth of the giant online accommodation-sharing platform, aka Airbnb, is creating serious concerns about equity and the impacts on our cities and neighbourhoods as we know them. Our recent research shows that the patterns of Airbnb listings in Australia’s biggest cities are highly uneven. The findings suggest impacts on rental housing are likely to be biggest in high-end areas that appeal to tourists. Low-income areas are less affected.
Our research – focusing on the Sydney and Melbourne metropolitan regions – looked into three important questions:
Where are the listings?
Who is hosting Airbnb?
What are the impacts on rental markets?
Where are Airbnb listings located?
The maps below show the distribution of Airbnb offerings in the Sydney and Melbourne metropolitan regions. These also show the composition of listings: entire (house/apartment, shown in red) versus partial (room only or shared room, in blue).
In Sydney (shown above), Airbnb offerings are mostly concentrated in popular tourist areas. Interestingly, partial house/apartment listings spread out more to the middle and fringe suburbs. Entire house/apartment listings are more concentrated around the city centre and eastern beaches.
We see a similar pattern in Melbourne (above). Airbnb listings aggregate around the city centre but also extend beyond the inner core to the residential outskirts. However, the composition of listings (entire versus partial) has less effect on their distribution in Melbourne than in Sydney.
Interestingly, the cities have very different Airbnb market sizes. The populations of the two regions are almost on a par, but Sydney has almost twice as many Airbnb listings as Melbourne. The difference in entire house/apartment listings is even greater.
SEIFA is a suite of four summary measures created from Census information. For each index, every geographic area is given a SEIFA score. This shows how that area compares with others in Australia.
All areas are ordered from lowest to highest SEIFA score. This ranges from the lowest 10% of areas, which are given a score of 1, up to the highest 10%, with a score of 10.
Our analysis showed the sheer scale of inequity of Airbnb listings distribution. Over 95% of all entire house/apartment listings and about 87% of partial house/apartment listings (room only or shared room) in Sydney are in the socio-economically best-off areas (SEIFA deciles 9 and 10).
Airbnb offerings in Melbourne follow a similar pattern. Over 80% of entire house/apartment listings and about 70% of partial house/apartment listings are found in the best-off areas.
Our data analysis establishes that Airbnb hosting mainly occurs in the most affluent pockets of both regions.
What are the impacts on the rental market?
We also looked at the ratio of the size of the rental market to the size of Airbnb listings with specific attention to the socioeconomic status (using SEIFA) of each local government area in Melbourne and Sydney. This produced a few interesting observations, which help illustrate how local long term rental housing stock is, or could be, lost by conversion to Airbnb short-term listings.
In Sydney, there are no low socio-economic areas (SEIFA scores of 1-5) with high numbers of rental dwellings that also have high numbers of entire house/apartment Airbnb listings. This means that, to date, Airbnb is not displacing the rental stock in the most disadvantaged pockets of the Sydney metropolitan region.
Nevertheless, in a small number of high socio-economic areas (SEIFA scores of 8-10), the Airbnb market (entire listing only) represents sizeable proportions of the rental market. For the beachside location of Waverley (decile 10), for example, the number of Airbnb entire listings is almost equivalent to a quarter of the number of rental dwellings. Similarly, in Manly and Pittwater (both 10), Airbnb entire home listings are about 20% of the rental market size.
In other words, considering the very small size of Airbnb in comparison to the total rental market in Sydney – less than 3.5% – the overall impact can be expected to be minimal. However, the impact is not equally distributed, either geographically or socio-economically.
Indeed, the impact of Airbnb on the rental market is of concern in a limited number of areas in Sydney, mainly strategic tourism locations such as beachside areas. Although these are at the highest end of socio-economic spectrum, there is a danger of some local residents being pushed out of the most sought-after areas so tourists can move in.
The pattern in Melbourne is slightly different or, in a sense, less intense than in Sydney. Again, the general trend of high Airbnb listings in high socio-economic areas is observed.
The Melbourne CBD, which has a SEIFA score of 8, has the most Airbnb entire house/apartment listings. These listings represent the highest proportion, about 8%, when compared to the size of the local rental market. The pressure on the rental market, then, is far less than what we see in popular Airbnb spots in Sydney, such as Waverley, Manly and Pittwater.
We also see in Melbourne that popular rental areas in lower SEIFA areas have low numbers of entire house/apartment Airbnb listings. This confirms the Sydney hypothesis that the loss of rental supply is not yet a major concern at the lower end of the rental market.
The patterns we observed suggest that the pressure Airbnb puts on the rental market – at least at this point of time – is limited to a small number of high-end areas, mainly locations that are attractive to tourists. This represents a concern in terms of rental supply in these areas, where some local residents in the long-term rental market might be losing out to the short-term tourism market.
Authors: Tooran Alizadeh, Senior Lecturer, Director of Urban Design, University of Sydney; Reza Farid, Adjunct Research Fellow, Griffith University; Somwrita Sarkar, Senior Lecturer in Design and Computation, University of Sydney
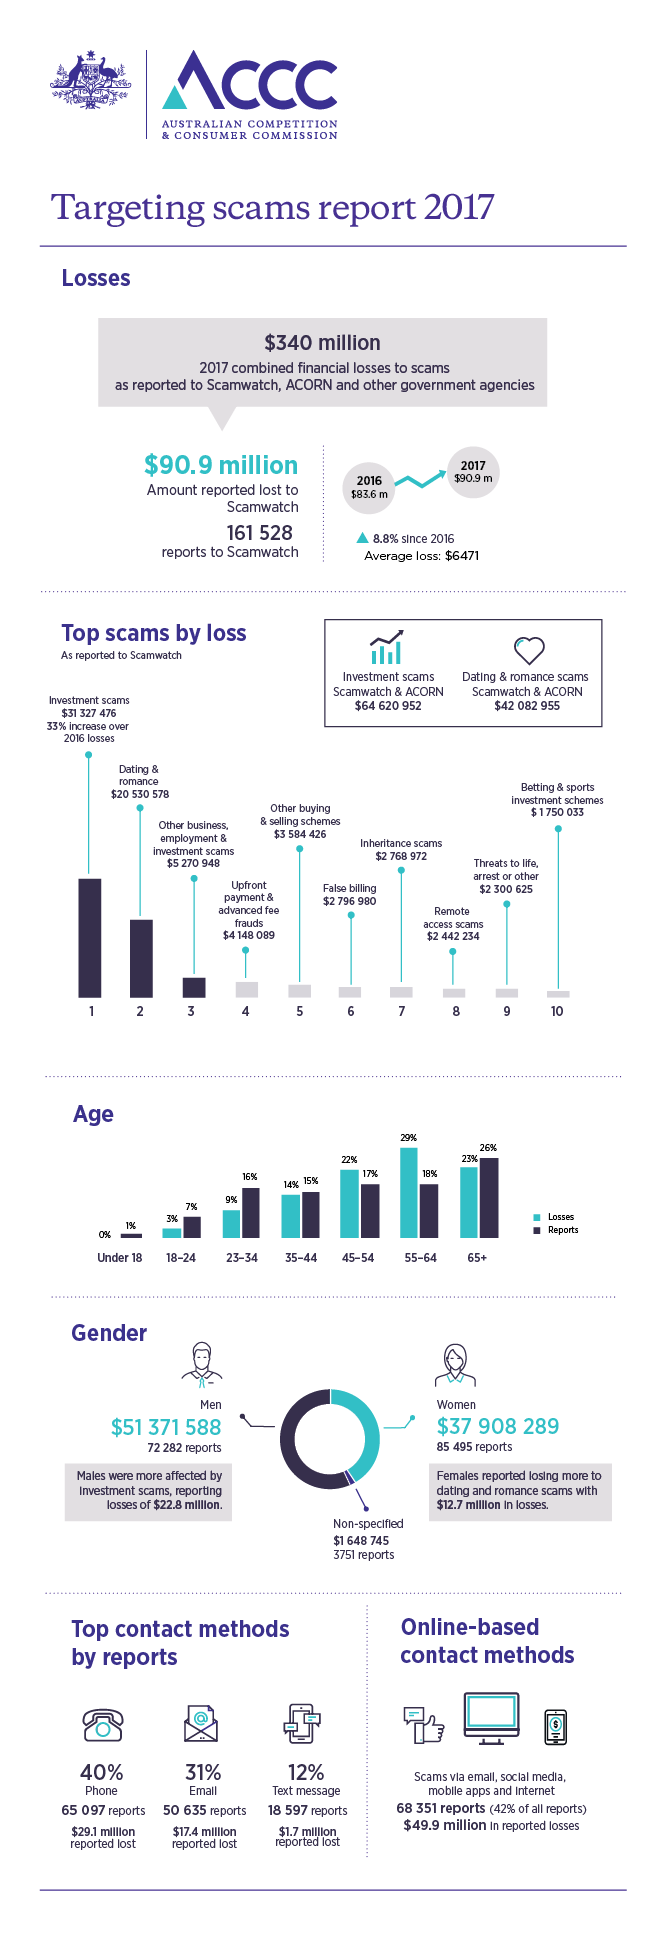
The ACCC says that Australians lost more money to scammers in 2017 than in any other year since the ACCC began reporting on scam activity. According to the ACCC’s ninth annual Targeting scams report more than 200,000 scam reports were submitted to the ACCC, Australian Cybercrime Online Reporting Network (ACORN) and other federal and state-based government agencies in 2017. Total losses reported were $340 million – a $40 million increase compared to 2016.
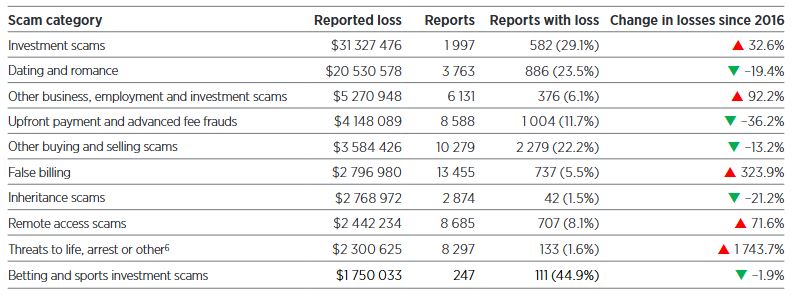
The top three most reported scam categories of 2017 were phishing, identity theft and false billing scams. Losses to investment scams reported to Scamwatch increased by 33 per cent which translates to an increase in losses of $7.6 million. Combined losses with ACORN reports brings investment scam losses to $64.6 million in 2017, an increase over the $59 million in combined losses reported in 2016. False billing scams reported to Scamwatch increased by 324 per cent, from $659 835 in 2016 to
$2.7 million in 2017. Remote access scams reported to Scamwatch increased by 72 per cent representing an increase in losses of $1 million.
This is the first time reported losses to scams have totalled more than $300 million and demonstrates the increasing impact of scams on Australians. Investment scams topped the losses at $64 million, an increase of more than 8 per cent. Dating and romance scams caused the second greatest losses at $42 million.
“It’s very worrying that Australians are losing such extraordinary amounts to scammers. Based on just the reports provided to the ACCC, victims are losing an average of $6500. In some cases people have lost more than $1 million,” ACCC Deputy Chair Delia Rickard said.
“Some scams are becoming very sophisticated and hard to spot. Scammers use modern technology like social media to contact and deceive their victims. In the past few years, reports indicate scammers are using aggressive techniques both over the phone and online.”
Today marks the beginning of Scams Awareness Week 2018 and this year Scamwatch is asking people to “Stop and check: is this for real?” when they’re contacted by scammers who are pretending to be from well-known government organisations or businesses.
Scamwatch received almost 33,000 reports of these threat-based impersonation scams in 2017. Over $4.7 million was reported lost and more than 2800 people gave their personal information to these scammers.
“These scams can be very frightening. For example, scammers will impersonate the Australian Taxation Office and threaten people with immediate arrest unless they pay an outstanding tax bill. They may pretend to be from Telstra to try to hack into your computer or from Centrelink promising extra payments in return for a ‘fee’,” Ms Rickard said.
“Scammers scare us or butter us up with promises of cash because they know it clouds our judgement. People get so worried about being arrested they don’t question if the person threatening them is genuine.”
“If you’re being threatened, take a deep breath, and ask yourself if the call makes sense. The ATO will never threaten you with immediate arrest; Telstra will never need to access your computer to ‘fix’ a problem; and Centrelink will never require a fee to pay money it owes you. Finally, none of these organisations will ask you to pay using iTunes gift cards,” Ms Rickard said.
“If something doesn’t feel right, hang up the phone or hit delete. If the person said they were, for example, from Telstra or the ATO, find the phone number for that organisation online or in the phone book, call them and let them know about the call you received. They’ll let you know if it’s genuine or a scam.”
The ACCC encourages people to visit www.scamwatch.gov.au (link is external) to report scams so we can warn others about them and learn more about what to do if they’re targeted by scams.
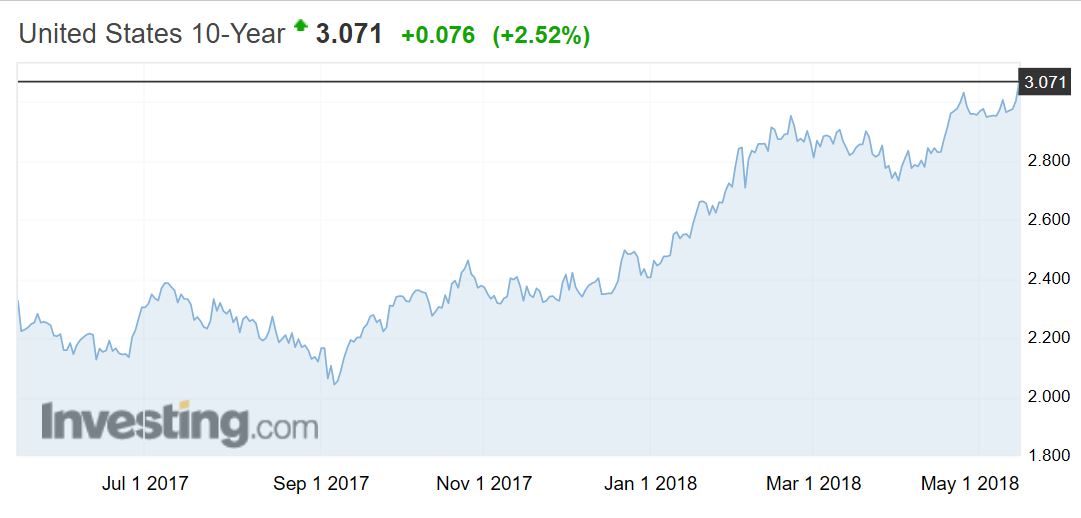
With US 10-year bond yields at a seven-year high, a relatively minor shock could be enough to trigger forced selling on equity markets, says FIIG via InvestorDaily.
The yield on 10-year US treasuries closed at 3.11 per cent overnight on Friday, a seven-year high that prompted speculation about a shift out of equities.
Speaking to InvestorDaily, FIIG NSW state manager Jon Sheridan said that if the 10-year holds at this level it will have broken the long-term secular downtrend in yields.
While he did not profess to be a “massive believer” in technical analysis, he said it is important to realise that many of the people trading in markets do.
And with high levels of margin debt and stretched valuations on the S&P 500 index, equity markets are looking like a “bit of a house of cards at the moment”, Mr Sheridan said.
“A strong gust, whatever that might be – it might be a geopolitical thing, or Facebook getting regulated, or Tesla raising capital – could break the fragile confidence,” he said.
“And then it all comes tumbling down and then you’ve got algorithmic selling, and margin debt being called and forced selling – all the waterfall effects that you don’t want to see if you’re an equity investor.”
There are three indicators that have Mr Sheridan worried about the future trajectory of the current US equity bull run.
First, the three-month US treasury bill is now above the yield on the S&P 500. In other words, he said, investors can get a higher (and risk-free) yield on three-month treasuries than they can get from the dividend yield of the stocks on the S&P 500.
Second, the 10-year treasury yield, at 3.11 per cent, is above the terminal US Federal Reserve funds rate of 2.75-3 per cent – something that has never happened before (at least “sustainably”).
“What that means is that if you think history will play out again, you should actually be a buyer of longer-dated bonds, because the chances are that yields aren’t going any higher from here. And in fact may even go lower,” Mr Sheridan said.
Finally, the spread between the US 10-year and 2-year yields has fallen to 51 basis points (down from 1 per cent a year ago, and from 2.62 per cent in December 2013).
When the spread goes negative (i.e, ‘inverts’) it means 2-year yields are higher than their 10-year counterparts.
“Every time since World War Two there has been a recession within 1 to 3 years from that inversion,” Mr Sheridan said.
“That’s the main signalling influence that the yield curve has in terms of the general economic outlook, and of course recession is terrible for stocks and property, because they’re risk-on assets,” he said.
I discussed the future of ATMs with Neil Mitchell on 3AW following the banks’ removal of withdrawal fees last year. Now many banks are removing these devices as usage falls, but should they have a social obligation (in the light of the Royal Commission)?
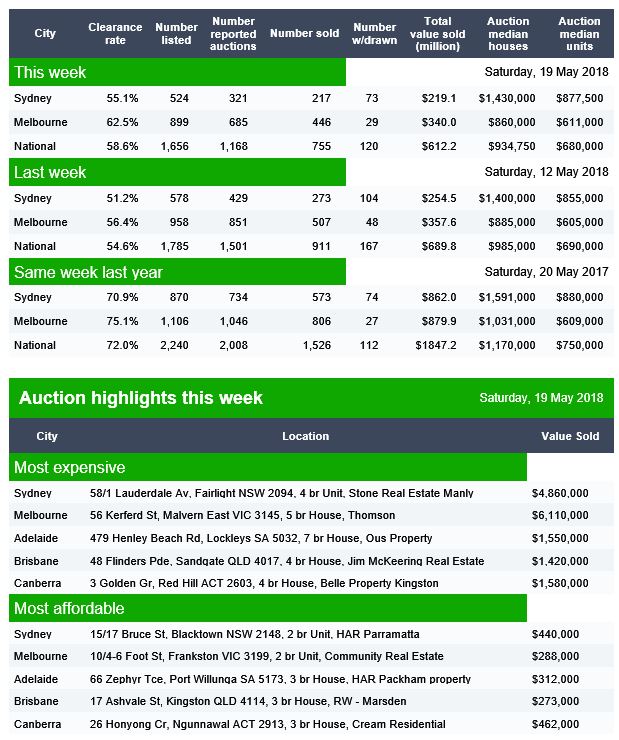
Domain have released their preliminary auction clearance results and the weakness in the stats continues, both in terms of volumes and clearance rates. The final results will settle lower still. They are way down on last years.
There is also a larger drop between those listed for auction compared with those auctioned.
In Canberra, 58 were listed for auction and 36 sold. In Brisbane 107 were listed and 27 sold. In Adelaide 68 were listed and 29 sold.
You can watch our recent video blog where we discussed how the auction results are calculated and how reliable they may be, especially in a falling market.
Welcome to our latest summary of finance and property news to the 19th May 2018.
Watch the video or read the transcript.
Today we start with bank culture and the next round of the Royal Commission.New ASIC chairman James Shipton was at the Australian Council of Superannuation Investors conference in Sydney and was asked how seriously he was taking the threat to the financial system given the failures aired at the royal commission. He said the threat is great. As a former member of the finance profession – as a person who is proud to be a financier – I find it jarring and disappointing that this is where we find ourselves,” he said. As a proud Australian who is returning from nearly 25 years overseas, it is very confronting that we find ourselves in this situation. The misconduct discussed at the royal commission “must not stand, [it] must be addressed”
Mr Shipton also highlighted the “proliferation” of conflicts of interest in parts of the financial industry. “It is clear to me that a number of institutions have not taken the management of conflicts of interest to heart,” he said. “This is verging on a systemic issue. Indeed, it is the source of much of the misconduct ASIC has been responding to and which is being highlighted by the royal commission hearings.” Mr Shipton expressed his “surprise” that many Australian firms have “turned a blind eye” to conflicts of interest as their businesses have grown. “Too often, unacceptable conflicts were justified by firms on the basis that ‘everyone else is doing it’, even though it’s the right thing to do to end them .“A business culture that is blind to conflicts of interest is a business culture that does not have the best interests of its customer in mind. Moreover, it is one that is not observing the spirit as well as the letter of the law,” he said.
These are relevant comments in the light of the next round of the Royal Commission which starts on 21st May. This round of public hearings will consider the conduct of financial services entities and their dealings with small and medium enterprises, in particular in providing credit to businesses. The hearings will also explore the current legal and regulatory regimes, as well as self-regulation under the Code of Banking Practice. They will use the same case study approach.
They will be considering Responsible lending to small businesses, with ANZ, Bank of Queensland, CBA, Westpac and Suncorp on the stand. They will then consider the Approach of banks to enforcement, management and monitoring of loans to businesses with CBA / Bankwest and NAB. Third will be Product and account administration with CBA and Westpac; then the Extension of unfair contract terms legislation to small business contracts with ASIC and finally The Code of Banking Practice with ABA and ASIC. This should be worth watching, as we are expecting more cases of misconduct and poor behaviour. Our Small and Medium Business surveys highlight the problem many have with getting credit and being treated unfairly. There is a link below if you want to grab a free copy.
So now to the statistics. The ABS data this week painted a rather unsettling picture. The latest unemployment data to April 2018 showed that employment growth is slowing. The trend unemployment rate rose from 5.53 per cent to 5.54 per cent in April 2018 after the March figure was revised down, while the seasonally adjusted unemployment rate increased 0.1 percentage points to 5.6 per cent. The trend participation rate increased to a further record high of 65.7 per cent in April 2018 and in line with the increasing participation rate, employment increased by around 14,000 with part-time employment increasing by 8,000 persons and full-time employment by 6,000 persons in April 2018. But as we discussed in our separate post “Jobs Aren’t What They Use To Be” underutilisation – or those in work who want more work, continues to running at very high rates, and this helps to explain the low wages growth, which was also reported by the ABS this week. This showed a showed a further fall compared with last time with the seasonally adjusted Wage Price Index up 0.5 per cent in March quarter and 2.1 per cent through the year. Seasonally adjusted, private sector wages rose 1.9 per cent and public sector wages grew 2.3 per cent through the year to March quarter.
We discussed this in our post “Some Disturbing Trends”. In fact, you can mount an argument the federal budget is already shot as a result. The gap is large, and growing. And for comparison, the Average Compensation of Employees from the national accounts which is to December 2017 is tracking even lower circa 1.3%. And the latest inflation figure is sitting at 1.9%.
An article in The Conversation this week by Stephen Kirchner, from the University of Sydney, argued that the RBA is making an explicit trade-off between inflation and financial stability concerns which is weighing on Australians’ wages. In the past, the RBA focused more on keeping inflation in check, the usual role of the central bank. But now the bank is playing more into concerns about financial stability risks in explaining why it is persistently undershooting the middle of its inflation target. In the wake of the global financial crisis, the federal Treasurer and Reserve Bank governor signed an updated agreement on what the bank should focus on in setting interest rates. This included a new section on financial stability. That statement made clear that financial stability was to be pursued without compromising the RBA’s traditional focus on inflation. But the latest agreement, adopted when Philip Lowe became governor of the bank in 2016, means the bank can pursue the financial stability objective even at the expense of the inflation target, at least in the short-term. He concluded that when the RBA governor and the federal treasurer renegotiate their agreement on monetary policy after the next election, the treasurer should insist on reinstating the wording of the 2010 statement that explicitly prioritised the inflation target over financial stability risks. If the RBA continues to sacrifice its inflation target on the altar of financial stability risks, inflation expectations and wages growth will continue to languish and the economy underperform its potential.
International funding costs continue to rise with the US 10 Year Treasury rising this week, as yields were boosted after a report on U.S. retail sales for April indicated that consumer spending is on track to rebound after a soft patch in the first quarter. Yields have climbing higher since the Fed said on at its May meeting that inflation is moving closer to its 2% target. The Fed raised rates in March and projected two more rate hikes this year, although many investors see three hikes as possible.There is a strong correlation between the 10-year bond yield and the quantitate tightening which is occurring – making the point again that the rate rises are directly correlated with the change in policy.
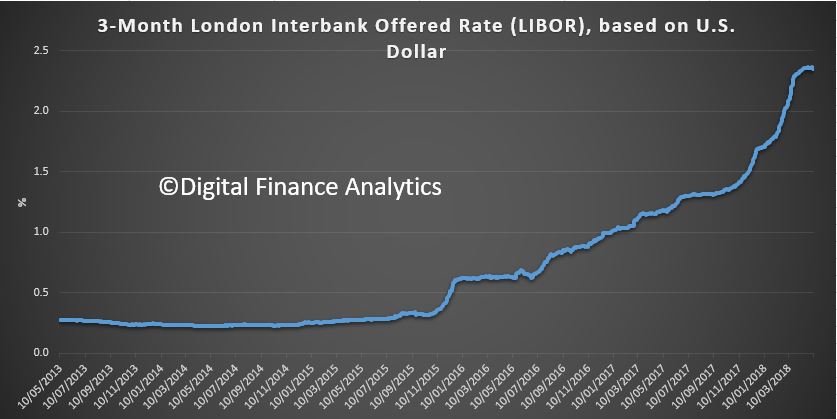
Libor, the interbank benchmark continued to rise, as we discussed in our post “The Problem with LIBOR”. And this translates to higher mortgage rates in the US, with US headlines speaking of “the highest mortgage rates in seven years.
To be clear, we watch the US markets, and especially the capital market rates. because these movements impact the cost of bank funding and the Australian banks, especially the larger ones need access to these funds to cover perhaps 30% of their mortgage books. As a result, there is pressure on mortgage rates locally, with the BBSW reflecting some of this already.
Canada is another market worth watching, because it shares a number of the same characteristics as our own. The authorities tightened mortgage underwriting standards earlier in the year, and the results are now some significant slowing of purchase volumes, and home prices.
Significantly, the lenders are discounting new loans to try to maintain mortgage underwriting volumes in the fading market, which is similar to the dynamics here, with some Australian lenders now offering discounts to property investors for the first time in a year or so.
We hold our view that credit growth will continue to slow, as underwriting standards get tightened further. Investor lending has fallen by 16.1 per cent over the year to March, while owner-occupied lending is off by 2.2 per cent, according to the Australian Bureau of Statistics. The latest housing finance statistics show that lending to owner-occupiers fell by 1.9 per cent in March, the highest rate of decline in over two years; investor lending fell by 9 per cent over the month.
However, these figures are yet to reflect the latest round of credit tightening by the major banks, who face increased scrutiny amid damning evidence of irresponsible lending during the first round of the royal commission.
Both the major banks and the RBA expect credit growth to slow. We are now entering a “credit crunch”, which will reduce total mortgage volumes by around 10 per cent over the next year. The chances are that people will not be moving as swiftly as they had previously and not only is there lower demand now, particularly for property investors, but tighter lending criteria means that brokers will have to work a lot harder to get the information from clients and go through more hoops to get an application processed. Overall volumes will be down.
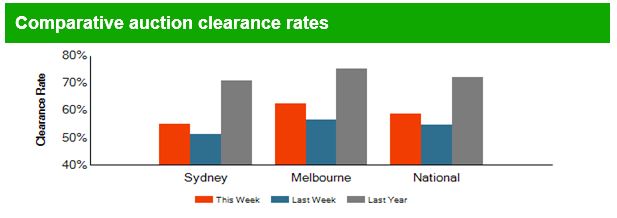
The Auction clearance rates continue lower, according to CoreLogic. Last week, a total of 2,279 auctions were held across combined capital cities, returning a final clearance rate of 58.2 per cent, the lowest clearance rate seen since late 2015. This time last year, the clearance rate was much stronger with 72.8 per cent of the 2,409 auctions returning a successful result.
Melbourne’s final clearance rate dropped to 59.8 per cent this week across 1,099 auctions making it the lowest clearance rate the city has seen since Easter 2014 (58.1 per cent).
Sydney’s final auction clearance rate fell to 57.5 per cent across 787 auctions last week, down from 63.1 per cent across 797 auctions over the previous week. Over the same week last year, 960 homes went to auction and a clearance rate of 74.5 per cent was recorded.
Across the smaller auction markets, Canberra, Perth and Tasmania saw clearance rates improve while clearance rates across Adelaide and Brisbane fell slightly. Of the non-capital city auction markets, Geelong returned the highest final clearance rate once again, with a success rate of 83.0 per cent across 50 auctions.
This week they expect to see a lower volume of auctions – 1,931, down from 2,279 last week. Melbourne is the busiest city for auctions again this week, with 948 auctions being tracked so far, down from 1,099 last week. Sydney has 637 auctions scheduled this week, down from 787 last week.
Adelaide and Perth are expecting to see a slight increase in auction volumes this week, with Adelaide tracking 102 auctions, up from 97 last week, while Perth currently has 43 auctions scheduled, up from 40 last week.
In terms of home price movements, prices are continuing to fall in all states last week, according to the CoreLogic Indices, other than Adelaide which was just a tad higher. Perth fell the most, down 0.11% followed by Sydney down 0.10%. The year to data movements, and the rolling 12-month view shows that Sydney is leading the way down. As we have said before, we think Melbourne is 6-9 months behind Sydney. But remember that the latest spate of lending tightening has yet to work though, so we expect prices to continue to fall. Of course prices are still well above those from the previous peak, with Sydney still up 60% and Melbourne up 44%. However, Perth is down 11%, and the overall average is 37% higher.
Finally, The Australian Financial Security Authority released the personal insolvency activity statistics for the March quarter 2018. In state and territory terms, personal insolvencies reached a record quarterly high in Western Australia (1,020) and the highest level since the September quarter 2014 in New South Wales (2,372). Total personal insolvencies in the March quarter 2018 increased slightly by 0.1% compared to the March quarter 2017. We discussed this data in more detail in our video “Some Disturbing Trends”
Given all the data we discussed today, we expect the insolvencies will continue to rise in the months ahead, as the impact of flat incomes, rising costs, and big debt continue to press home.
Centrally cleared cryptocurrency derivatives could be a real-world test of clearinghouses’ margining and default procedures, particularly if derivative notional volumes increase and cryptocurrencies exhibit heightened price volatility, says Fitch Ratings.
Although they have largely avoided direct exposure to cryptocurrencies, banks’ role as clearing members creates a secondary channel for cryptocurrency risk. This could indirectly affect banks under more extreme stress scenarios, such as if margining and clearinghouse capital contributions prove insufficient to absorb counterparty defaults.
A dramatic increase in financial institutions’ exposure to cryptocurrency derivatives could challenge clearinghouses and large financial institution clearing members in ways beyond those typically associated with the introduction of new market products. Cryptocurrencies are prone to extreme price volatility, which has been exacerbated by a nascent, unregulated underlying market with a limited price history and without generally accepted fundamental valuation principles. These factors complicate margin calculations, particularly related to short positions, for which losses cannot be capped. Inadequate margins may lead to use of clearinghouses’ collective funds to mitigate losses, thus calling upon the resources of non-defaulting clearing members, including many of the world’s largest banks and other financial institutions.
Bitcoin futures are cash-settled derivatives (i.e. without delivery of the base asset) that allow investors to assume long and short exposures to bitcoin prices without directly facing the cryptocurrency itself. In December 2017, CME Group and CBOE introduced the trading of bitcoin futures under the tickers BTC and XBT, respectively. BTC contracts are cleared through CME Clearing, while XBT contracts are cleared through Options Clearing Corporation (OCC).
As of May 9, 2018, open interests in XBT and BTC were modest at 6,287 and 2,479 contracts, respectively, worth approximately $59 million and $116 million, respectively. However, if challenges associated with trading the cryptocurrency are addressed, including uncertainty over regulatory, tax and legal frameworks, cryptocurrency derivative volumes could grow.
Clearinghouses have imposed high initial margin requirements, as well as price and position size limitations, suggesting a cautious approach thus far to trading cryptocurrency derivatives. As of May 9, 2018, initial (maintenance) margin requirements at CME were 43% of the associated notional amount, while at OCC the percentage was 44%, up from around 30% at the derivatives’ introduction in December 2017. Position limits at both exchanges are limited to 5,000 contracts in total or 1,000 in spot/expiring contracts. Consistent with price limitations for equity indexes, the maximum price limits at CME and CBOE are set at 20% above or below the previous day’s closing price, and trading is not permitted outside this band. There are also special price fluctuation limits set at 7% and 13%, which lead to temporary trading suspension.
The CME and OCC have not yet established separate legal entities or default funds for cryptocurrency derivatives, instead allocating exposure to the same default funds as equity indexes. This is understandable given the cost inefficiencies of establishing entities and default funds for what is currently a relatively low volume business. Nevertheless, a member default from losses on cryptocurrency derivatives may cause disruptions in other cleared products. Should centrally-cleared cryptocurrency derivatives materially grow, Fitch would expect clearinghouses at a minimum to establish separate default funds in an effort to isolate and mitigate associated risks.
The cost of money continues to rise, and this includes the LIBOR benchmark rate, as shown by this chart. LIBOR or ICE LIBOR (previously BBA LIBOR) is a benchmark rate that some of the world’s leading banks charge each other for short-term loans. As it climbs, it signals rate rises ahead.
But what is LIBOR, and more importantly, will it survive?
ICE LIBOR stands for Intercontinental Exchange London Interbank Offered Rate and serves as the first step to calculating interest rates on various loans throughout the world. LIBOR is administered by the ICE Benchmark Administration (IBA) and is based on five currencies: the U.S. dollar (USD), euro (EUR), pound sterling (GBP), Japanese yen (JPY), and Swiss franc (CHF). The LIBOR serves seven different maturities: overnight, one week, and 1, 2, 3, 6 and 12 months. There is a total of 35 different LIBOR rates each business day. The most commonly quoted rate is the three-month U.S. dollar rate (usually referred to as the “current LIBOR rate”), as shown in the chart.
So, LIBOR is the key interest rate benchmark for several major currencies, including the US dollar and British pound and is referenced in around US$350 trillion worth of contracts globally. A large share of these contracts have short durations, often three months or less. But it’s up for a shakeout as RBA Deputy Governor Guy Debelle Discussed recently.
Last year, the UK Financial Conduct Authority raised some serious questions about the sustainability of LIBOR. That is, apart from the rate fixing problems and the ensuing large fines.
The key problem is that there are not enough transactions in the short-term interbank funding market to reliably calculate the benchmark. In fact, the banks that make the submissions used to calculate LIBOR are uncomfortable about continuing to do this, as they have to rely mainly on their ‘expert judgment’ in determining where LIBOR should be rather than on actual transactions. To prevent LIBOR from abruptly ceasing to exist, the FCA has received assurances from the current banks on the LIBOR panel that they will continue to submit their estimates to sustain LIBOR until the end of 2021. But beyond that point, there is no guarantee that LIBOR will continue to exist. The FCA will not compel banks to provide submissions and the panel banks may not voluntarily continue to do so. There is no guarantee at all that will be the case.
So market participants that use LIBOR need to work on transitioning their contracts to alternative reference rates. The transition will involve a substantial amount of work for users of LIBOR, both to amend contracts and update systems. The process is not straightforward. A large share of these contracts have short durations, so these will roll off well ahead of 2021, but they should not continue to be replaced with another short-dated contract referencing LIBOR. A very sizeable number of current contracts would extend beyond 2021, with some lasting as long as 100 years.
So regulators around the world have been working closely with the industry to identify alternative risk-free rates that can be used instead of LIBOR. These alternative rates are based on overnight funding markets since there are plenty of transactions in these markets to calculate robust benchmarks. Last month, the Federal Reserve Bank of New York began publishing the Secured Overnight Financing Rate (SOFR) as the recommended alternative to US dollar LIBOR. For the British pound, SONIA has been identified as the alternative risk-free rate, and the Bank of England has recently put in place reforms to ensure that it remains a robust benchmark.
But these chosen risk-free rates are overnight rates, while the LIBOR benchmarks are term rates. Some market participants would prefer for the LIBOR replacements to also be term rates. While the development of term risk-free rates is on the long-term agenda for some currencies, they are unlikely to be available anytime soon. This reflects that there are currently not enough transactions in markets for term risk-free rates – such as overnight indexed swaps (OIS) – to support robust benchmarks. Given this reality, it is very important that users of LIBOR are planning their transition to the overnight risk-free benchmarks that are available, such as SOFR for the US dollar and SONIA for the British pound.
For the risk-free rates to provide an alternative to LIBOR, the next challenge is to generate sufficient liquidity in derivative products that reference the risk-free rates. This will take some time, particularly for the US dollar, where SOFR only recently started being published. Nevertheless, progress is being made, with the first futures contracts referencing SOFR recently being launched.
Market participants also need to be prepared for a scenario where the LIBOR benchmarks abruptly cease to be published. In such an event, users would have to rely on the fall-back provisions in their contracts. However, for many products the existing fall-back provisions would be cumbersome to apply and could generate significant market disruption. For instance, some existing fall-backs involve calling reference banks and asking them to quote a rate. To address this risk, the Financial Stability Board has encouraged ISDA to work with market participants to develop a more suitable fall-back methodology, using the risk-free rates that have been identified. But LIBOR is very different from an overnight risk-free rate as it includes bank credit risk and is a term rate. So the key challenge is to agree on a standard methodology for calculating credit and term spreads that can be added to the risk-free rate to construct a fall-back for LIBOR. This needs to be resolved as soon as possible, and we encourage users of LIBOR to engage with ISDA on this important work.
Finally, In Australia, the key InterBank Offer Rate benchmark for the Australian dollar is BBSW. Again we saw a spate of rate manipulations around BBSW, but the RBA and the Australian Securities and Investments Commission (ASIC) have been working closely with industry to ensure that it remains robust. The RBA argues the critical difference between BBSW and LIBOR is that there are enough transactions in the local bank bill market each day to calculate a robust benchmark. Australia has an active bank bill market, where the major banks issue bills as a regular source of funding, and a wide range of wholesale investors purchase bills as a liquid cash management product.
They think that BBSW can continue to exist even if credit-based benchmarks, such as LIBOR, are discontinued in other jurisdictions. But in the event that LIBOR was to be discontinued, with contracts transitioning to risk-free rates, there may be some corresponding migration away from BBSW towards the cash rate. This will depend on how international markets for products such as derivatives and syndicated loans end up adapting in a post-LIBOR world.
The infrastructure is already in place for BBSW and the cash rate to coexist as the key interest rate benchmarks for the Australian dollar. The OIS market is linked to the cash rate and has been operating for almost 20 years. It already has good liquidity at the short end, and the infrastructure is there for longer term OIS. A functioning derivatives market for trading the basis between the benchmarks is important for BBSW and the cash rate to smoothly coexist. Such a basis swap market is also in place, allowing market participants to exchange the cash flows under these benchmarks.
So the bottom line is that these Interbank Offer Rates are not as immutable as might be imagined, and this uncertainty is likely to continue for some time to come.