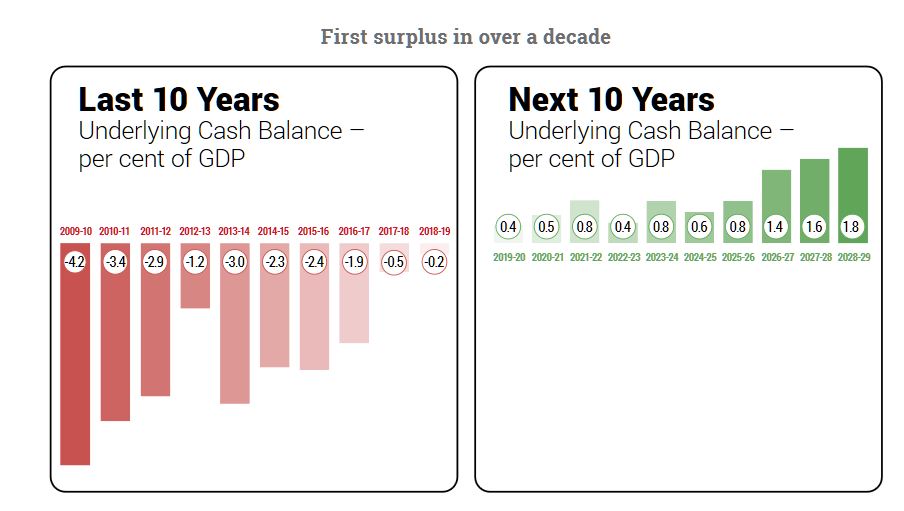
The Treasurer Josh Frydenberg has given his budget speech tonight, and he said that for the first time in 12 years the federal budget has returned to surplus.
His first budget includes billions of dollars for tax cuts, major road upgrades and health care. But actually, it is due to return to surplus in the NEXT financial year, and project small surpluses in subsequent years.
He is also spending big ahead of the election, so yes this is political (and in some regards intimating Labor’s policies in places) . This is a “boots and all” approach to try and gain election ground. Reminds me of Howard and Costello!
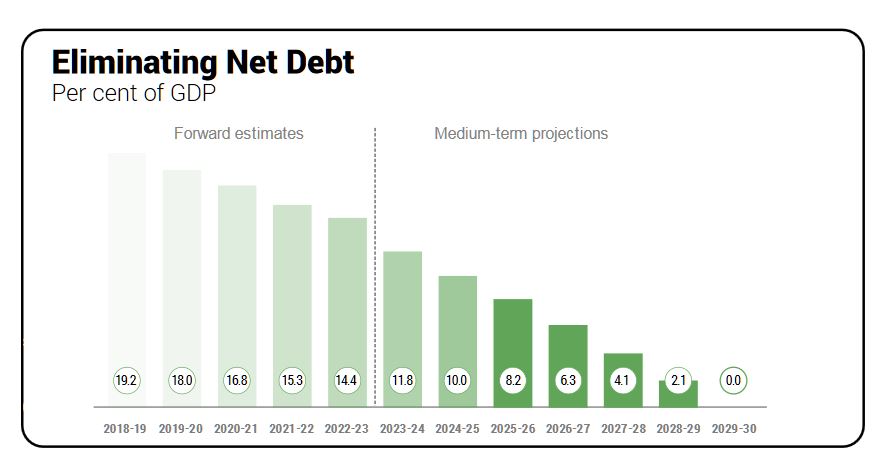
Net debt is forecast to be $360 billion next financial year, but the Coalition is promising to eliminate it by 2030 if it retains government (if the aggressive assumptions and no slow-down occurs in that time).
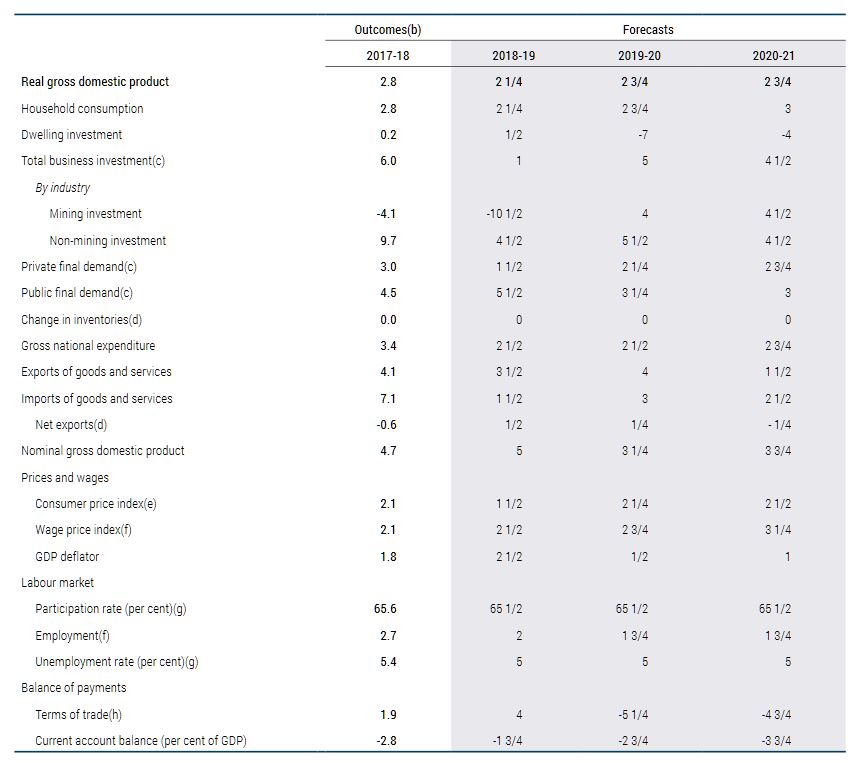
But it forecasts lower wages growth, then a jump back to higher rates (why?) and the same is true of economic growth at 2.75% next year, then higher later. Plus a promise for another 1.25 million jobs in the next 5 years (what type of jobs?).
“The budget is back in the black and Australia is back on track,” the treasurer said, announcing that the coalition delivered a $7.1 billion surplus
The Budget forecasts surpluses in each year over the forward estimates, reaching as high as $17.8 billion in 2012-22.
But the budget recognizes a number of risks locally and internationally and is under-funding the NDIS by $3 billion in the next two years.
“The residential housing market has cooled, credit growth has eased and we are yet to see the full impact of flood and drought on the economy.”
The mantra though the speech was that the budget would restore the nation’s finances without raising taxes.
“We are reducing the debt and this interest bill, not by higher taxes, but by good financial management and growing the economy.”
The truth is the budget may go into surplus next year thanks to very high iron ore export prices to China. This was lucky, and is explained by supply disruption from other sources lifting prices.
He makes the point that Australia has a significant national debt which is currently costing $18 billion, and this with interest rates ultra low!
Last year the coalition had announced plans to reduce income taxes for Australians by $144 billion. Now the Treasurer said the government would deliver more than $150 billion in income tax cuts.
From 1 July 2024 taxes will be reduced from 32.5 per cent to 30 per cent for those earning between $45,000 and $200,000.
“Taxes
will always be lower under the coalition,” Mr Frydenberg said, adding
that small businesses will also get tax relief from the 2019 budget.
“Small
business taxes have been reduced to 25 per cent and the instant asset
write-off will be increased from $25,000 to $30,000 and can be used
every time and asset under that amount is purchased.
“The instant asset write-off will also be expanded to businesses with a maximum turnover of $50 million.”
The coalition will also boost infrastructure spending to $100 billion over the next ten years.
Finally, the Government has matched Labor’s commitment to end a freeze on the Medicare rebate for GP visits from the first of July, as part of a $1.1 billion primary healthcare plan.
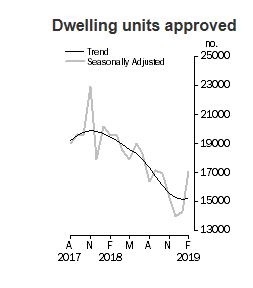
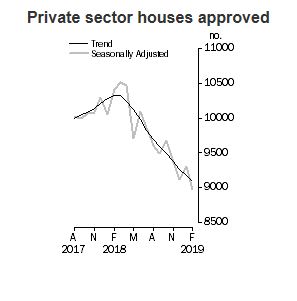
A rise in building approvals for apartments and townhouses has driven a 0.4 per cent increase in the total number of dwellings approved in Australia in February 2019, in trend terms, according to data released by the Australian Bureau of Statistics (ABS) today.
“Building approvals for private dwellings excluding houses rose 2.6 per cent in February.” said Justin Lokhorst, Director of Construction Statistics at the ABS. “Meanwhile, private houses fell a further 0.8 per cent”.
Among the states and territories, total dwelling approvals rose in February in New South Wales (3.1 per cent) and Western Australia (2.0 per cent), in trend terms. Falls were recorded in the Northern Territory (6.5 per cent), the Australian Capital Territory (6.3 per cent), Queensland (2.0 per cent), South Australia (1.1 per cent) and Victoria (0.8 per cent). Tasmania was flat.
Declines in approvals for private houses were recorded in New South Wales (2.0 per cent), Victoria (1.1 per cent) and Queensland (0.8 per cent), while increases were recorded in South Australia (2.0 per cent) and Western Australia (0.5 per cent).
In seasonally adjusted terms, total dwellings rose by 19.1 per cent in February, largely driven by rises in Victoria (37.3 per cent) and New South Wales (25.2 per cent). Private dwellings excluding houses rose 64.6 per cent, while private houses decreased by 3.6 per cent.
The value of total building approved rose 1.3 per cent in February, in trend terms. The value of non-residential building rose 1.9 per cent, while residential building increased 0.8 per cent.
The fall in residential property values is “losing steam” but could be reinvigorated by changes in the political and economic landscape, according to CoreLogic, via The Adviser.
The latest Hedonic Home Value Index from Property research group CoreLogic has
revealed that, in the month to 31 March 2019, national home values
dropped by 0.6 per cent, driven by a 0.6 per cent drop across
Australia’s combined capital cities and a 0.4 per cent fall across
combined regional locations.
The sharpest reported fall was in
Sydney (0.9 per cent), followed by Melbourne (0.8 per cent), Brisbane
and Darwin (0.6 per cent), Perth (0.4 per cent) and Adelaide (0.2 per
cent).
Hobart was the only capital city to report growth, with
dwelling values rising by 0.6 per cent, while prices in Canberra
remained stable.
Reflecting on the results, CoreLogic’s head of
research, Tim Lawless, said that the downturn could be “losing some
steam”, with the pace of falls slowing month-on-month.
However,
Mr Lawless added that the scope of the downturn has become “more
geographically widespread”, with monthly declines reported across six of
Australia’s eight capital cities and across most “rest of state”
regional locations.
Mr Lawless stated that the outlook for the
housing market continues to be plagued by uncertainty related to the
federal election, lending policies and domestic economic conditions.
Specific
reference was made to the federal Labor opposition’s proposals to limit
negative gearing to new housing and halve the capital gains tax
discount to 25 per cent.
“Federal elections generally cause some
uncertainty, which is likely amplified more so this time around
considering the potential for a change of government, which will also
involve significant changes to taxation policies related to investment,”
he continued.
“No doubt, some prospective buyers and sellers are
delaying their housing decisions until after the election; however,
there is no guarantee that certainty will improve post-election,
considering the impact of a wind back to negative gearing and halving of
the capital gains tax concession is largely unknown.”
Mr Lawless said that he expects Labor’s proposed changes to exacerbate the downturn in the housing market.
“It
seems a reasonable assumption that removing an incentive from the
market would result in some downwards pressure on activity and prices
for a period of time,” he said.
Credit availability was also cited as a source of continued uncertainty, with Mr Lawless pointing to the fall in the value of housing finance commitments, particularly in the owner-occupied space – as reported by the Australian Bureau of Statistics.
“The
value of owner-occupier lending is around 2.6 times the value of
investor lending, so the substantial drop in owner-occupier mortgage
commitments perhaps explains why the housing downturn is becoming more
widespread,” he said.
“The value of owner-occupier housing finance
commitments (excluding refinancing) was down 17.1 per cent compared
with January last year and investment credit was 24.6 per cent lower.”
Mr
Lawless said that monetary policy movements could help stimulate credit
demand but noted that tighter lending standards would limit the effect
of lower interest rates.
“While any cuts to the cash rate may
not be passed on in full, a lower cost of debt will provide some
positive stimulus for the housing market,” he said.
“Arguably,
this stimulus won’t be as effective as previous interest rate cuts due
to the high serviceability buffer applied to borrowers, whereby lenders
are still required to assess serviceability at a mortgage rate of at
least 7 per cent despite mortgage rates which are now available around
the 4 per cent mark or even lower.”
According to CoreLogic’s
research, the national median home price currently sits at $524,149,
with the median value across the country’s combined capital cities at
$597,860, and $376,728 across combined regional locations.
ANZ CEO Shayne Elliott has told a parliamentary inquiry that banks triggered the credit downturn impacting the supply of housing finance, via InvestorDaily.
Softening
conditions in the credit and housing space has sparked debate among
market analysts regarding the cause of the downturn, with some
stakeholders, including governor of the Reserve Bank of Australia (RBA)
Phillip Lowe claiming that the “main story” of the downturn is one of
“reduced demand for credit, rather than reduced supply”.
Mr Lowe claimed that falling property prices have deterred borrowers, particularly investors, from seeking credit.
According
to the Australian Prudential Regulation Authority’s latest residential
property exposure statistics for authorised deposit-taking institutions,
new home lending volumes fell by $25.1 billion (6.5 per cent) over the
year to 31 December 2018. The decline was driven by a sharp reduction in
new investment lending, which dropped by $17.7 billion (14 per cent),
from $126.9 billion to $109.2 billion over the same period.
However,
the ANZ CEO has told the House of Representatives’ standing committee
on economics that he believes the downturn in the credit space has been
primarily driven by the tightening of lending standards by lenders off
the back of scrutiny from regulators and from the banking royal
commission.
Liberal MP and chair of the committee Tim Wilson
asked: “Is the reported credit squeeze more demand-driven by borrowers
pulling back or supply-driven by banks being more conservative?”
To
which Mr Elliott responded: “This is a significant question that’s
alive today, and there are multiple views on it. I can’t portion between
those two.
“I’m probably more in the camp that says conservatism
and interpretation of our responsible lending obligations and others
has caused a fundamental change in our processes, and that has led to a
tightening of credit availability.
“It’s a little bit ‘chicken and
egg’,” Mr Elliott added. “If people find it a little bit harder to get
credit, they might step back from wanting to invest in their business or
buy a home, so I think they’re highly correlated, but I do think banks’
risk appetite has had a significant impact.”
Mr Elliott said
that “vagueness and greyness” regarding what’s “reasonable” and “not
unsuitable” as part of the responsible lending test have left the law to
the interpretation of lenders.
“Unfortunately, we haven’t always
had the benefit of a significant amount of precedence or court rulings
on some of those definitions, so we’ve done our best,” he said.
“I
think the processes recently, the questions that this committee has
asked, the questions in the royal commission, have started a debate, not
just with the regulators but with the community about what is the real
definition of [responsible] lending.”
He added: “As a result of
that, we’ve become more conservative in our interpretation, and so we’ve
tightened up, [and some] Australians will find it a little bit harder
to either get credit or get the amount of credit that they would have
otherwise had in the past or would like.
“I’m not suggesting for a minute that it’s wrong, it’s just the reality.”
In an article on Livewire, John Abernethy from Clime Asset Management really goes to town on monetary policy, saying that “The central bankers and bureaucrats of Europe and Japan are bereft of new ideas that will stimulate their economies. In our view they seem totally deluded in the belief that they are doing a good job. Rather they are seemingly repeating the same mistakes. Their policies have previously and once again taken their economies towards stagnation”.
Today they have no more ammunition – short of printing money and giving it to the public – to stimulate economic activity and business confidence.
We agree. Madness. Yet it appears we are headed the same way. To be clear, ultra-low interest rates is not an economic fix. The negative cash rates simply stimulate demand for government bonds as banks in particular seek yield from other sources.
And worth remembering, as we highlighted yesterday, the IMF says we are out of ammo. Time for some fresh thinking, though it might already be too late!
Worth reading….
Someone (maybe it was Albert Einstein) once opined that: “Insanity Is Doing the Same Thing Over and Over Again and Expecting Different Results”
It is our view that the maintenance of negative rates of interest
across both Europe and Japan with no positive economic result, is an act
of economic insanity. Further the continuation of quantitative easing
for nearly 8 years (in Europe) and over 15 years (in Japan) with no
discernible economic benefit are also acts of economic madness.
What will it take for the central bankers of Europe and Japan to
realise that their management of monetary policy is not working and that
there is no proof that it can work? Surely, they can see that negative
cash rates do not stimulate or even hold economic growth?
The recent readings of declining economic activity across Europe and
most notably in Germany, reflect poorly on the excessive use of monetary
stimulation. Further, the declining business confidence in Japan
recorded in February is a replay of many prior poor readings. Negative interest rates have done nothing to stimulate business confidence.
Our conclusion is this….
The central bankers and bureaucrats of Europe and Japan are bereft of
new ideas that will stimulate their economies. In our view they seem
totally deluded in the belief that they are doing a good job. Rather
they are seemingly repeating the same mistakes. Their policies have
previously and once again taken their economies towards stagnation.
Today they have no more ammunition – short of printing money and
giving it to the public – to stimulate economic activity and business
confidence.
Japanese economic growth over the last ten years is represented in
our first chart. Throughout this period Japan was effectively full
throttle with monetary policy.
Eurozone growth is hardly much better, and it has had its foot to the floor with both QE and zero interest rates.
These feeble growth outcomes follow years of aggressive monetary
policy. The next chart tracks the growth of the European Central Bank
balance sheet (QE) that has grown by over 2.8 trillion euros over the
last 4 years.
The purchase and the holdings of government bonds have ballooned.
Across most of the individual economies in the Eurozone the ECB holds
over 20% of all bonds on issue and in reviewing the purchases, there
seems to be little logic to the process. For instance, the acquisition
of German bonds seems inconsistent with the need to finance the German
government given its fiscal position is very strong. So why is the ECB
holding of German bonds the same as for Italy or Portugal, which are
economies in a fiscal mess?
It seems that the Germans, who effectively run the ECB, believe that
the likes of Italy or Portugal should receive no preferential treatment,
even if they are in dire need and Germany is not!
The maintenance of zero and negative cash rates since 2012 is shown
on our next chart. While the US has tried desperately to normalise
rates, the Europeans and Japanese have gone the other way – further into
negative.
The policy of negative cash rates is designed to penalise banks for
not lending. The excess reserves (or liquidity) of banks must be
deposited with the central bank and therefore are effectively taxed by
negative interest rates. To stop their loss the banks can push credit
out, but with no inflation, no business confidence and no perceived growth, there is little demand for credit.
The negative cash rates do stimulate demand for government bonds as
banks in particular seek yield from other sources. The maintenance of
negative cash yields combined with QE has pushed government bond yields
into negative territory and so the banks are stymied here as well. No
wonder the profits of the European banks is dreadful and the two largest
German banks (Deutsche Bank and Commerzbank) are now trying to merge to
drive costs down.
Our next chart (as at December 2018) tracks the amount of government
bonds that trade in markets with negative yields. It shows that at that
time 64% of all Japanese bonds on issue had a negative yield – even
though Japanese ten year bonds were yielding a positive return. Since
December, Japanese ten year bonds have fallen below a zero yield and the
percentage of negative yielding bonds has lurched higher towards 70%.
The cost to the economies and the investors of Europe and Japan is
immense. It is the savers and providers of capital that suffer most. The
destruction of the capital of pension funds must surely be a hidden
time bomb.
How can pension funds that generate little or no return meet the liabilities of an ageing population?
How significant is the pension shortfall across Europe and Japan? We can only wonder.
But if there is a grand covert plan to recapitalise Europe and Japan
through QE – it could be this. The central banks buy all of the
government debt on issue and then write it off or roll it into 100 year
bonds. The debt will never be repaid and effectively disappears! There is no other logical explanation for what is happening in Europe and Japan – other than insanity!
Unfortunately, it is the policies of central bankers in Europe and
Japan that is affecting the growth outlook for the whole world. It is
their policies that have stymied the US monetary policy adjustment that
is now on hold. It is their policies that are increasingly influencing
the investment returns of Australian retirees.
The outlook for Australian asset classes
There is no doubt that the declining and manipulated bond yields of
Europe and Japan directly influence the bond yields in the US and
therefore Australia. However over recent months the interplay between US
and Australian bonds has passed through a significant and historic
point.
As can be seen from the chart below, the Australian ten year bond has dipped below the US bond yield and has continued to do so.
The Australian bond yield lurched lower this week to a record low
that is now 0.25% below the RBA targeted rate of inflation. Thus ten
year bonds are close to having a negative “real” yield.
The RBA inflation target, which does influence the expected return
from investment assets, remains unmet. The recent reading of inflation
at about 1.5% is well below the target range of 2% to 3%.
Thus, the RBA is hamstrung by both the low inflation rate and the
influences from offshore policy settings. We predict that Australian
cash rates will remain at current levels for at least another 12 months.
Australia currently has “negative” real cash rates which are feeding
into bank bill rates and thus the term deposit rates offered to SMSFs by
banks. The outlook for term deposit rates is depressing!
A source of yield has been the Australian equity market. The
grossed-up yield (with the benefit of franking credits) has averaged
around 6% and given SMSF investors a yield that compensates for the
appalling alternatives of bank deposits and government bonds. Therefore,
the policy of the ALP to stop franked cash rebates would make yield
investing even more difficult in an historically low yield market.
Low investment returns on savings and cash deposits in SMSFs is
having an effect on the savings ratio. These negative influences have
added to stagnant wages growth (below inflation) and the rising cost of
basic public services to push Australia’s savings rate down. Normally a
declining savings ratio indicates growing consumption and consumer
confidence – but not this time.
This analysis supports our view that the outlook for investment returns is unexciting. Low growth, low inflation and low interest rates (short and long term) all suggest that investors need to adjust downwards their outlook for investment returns – from all asset classes.
Finally, in a most disturbing development, our last chart shows that
Australian business confidence is waning. While many commentators track
the investment intentions of business to determine the outlook for
growth, we are more interested in actual investment.
The chart below from the RBA shows that Australian listed companies
dramatically reduced capital raisings in 2018. Indeed the non-financial
sector actually reduced capital employed (it returned capital to
shareholders) for the first time in over twenty years.
Thus, if Australian companies are finding it difficult to justify
investment of their capital, with no need to raise more, then why would
investors in the Australian market believe that they can?
The emphasis for investment in equities in Australia must be tilted
towards smaller companies and those focused on offshore markets (mainly
emerging Asia and US).
It remains a difficult climate for investing. SMSFs must remain
disciplined and diversified. They should not be driven by greed to chase
excessive returns that are high risk.
Not in a world driven by insane monetary management.
The chief executive of AllianceBernstein has said that there will ultimately be a recession but it would not be happening this year, via InvestorDaily.
Seth
Bernstein, AB’s president and chief executive officer said that the
firm did not see the economy tumbling over the next twelve months.
“There is clearly a slowdown underway globally but we don’t see the US economy tumbling into a recession this year,” he said.
Mr
Bernstein during a visit to Australian clients said the yield curves
were a good predictor of recessions but were rarely good indicators of
when.
“There will ultimately be a recession but they [yield
curves] are a terrible predictor of the timing of that recession,” he
said.
However, investors would see signs as the markets moved closer to recession territory said Mr Bernstein.
“The yield curve has been flat for a very long time and it will invert closer to a recession,” he said.
Currently
the market was worried about macro events particularly the ongoing
transition of the global trade framework said Mr Bernstein.
“There
is resistance to that framework wherever anyone is disenfranchised or
where anyone finds themselves on the wrong end of change,” he said.
The
blame for the disenfranchised did not just lay with US President Donald
Trump, said Mr Bernstein, but he was the one that inflamed it.
“This
has been going on well before Donald Trump took office but Trump, in
his own distinctive way, is able to articulate it and respond to it very
forcibly for his core constituents – and he has been methodical about
checking off promises that he has made,” he said.
The current
trade barriers had led to a potentially less stable environment that was
not to the benefit of any nation, said Mr Bernstein.
“We are
concerned about a much less stable global trading environment. Lower
levels of global trade will mean lower levels of growth for Australia,
for the US, for the global economy more generally,” he said.
Ultimately,
the trade spat with China would be solved; however, Mr Bernstein said
that while it would be a deal that cuts the trade deficit, it would not
be as far reaching as the trade officials would like.
“Cooler
heads will prevail. I think the president wants a deal with the Chinese,
because he loves deals and he can talk about it in the news cycle, but
it probably won’t be as far reaching as many of us want it to be,” he
said.
The most accurate signal of a US economic recession (i.e. two or more quarters of negative economic growth) has manifested itself in the US Bond market – that being an inversion of the ‘1-year to 10-year’ yield curve.
Economist John Adams and Analyst Martin North discuss the consequences.
My ON THE GROUND METRICS are not as conventional as the MSM economists – then again, I have found these to be great indicators over the years. They haven’t failed me yet and they continue to repeat themselves over the property cycles. The difference with this fall is that it is the MOTHER LOAD the downturn on steroids. And do note, we don’t sit in plush offices with only Eastern Suburbs Data to make up rosy charts and graphs….
1) Shopping centers are running at 60%-70% rental arrears with their tenants. Yes Westfields being one.
2) For-Lease signs popping up like mushrooms in strip-shop areas and malls.
3) Coffee consumption over 13 cafes we have polled has dropped by almost 40% across them and is growing over the months.
4) Pawnshops are seeing an increase in people selling household items, jewelry and the electrical tools.
5) We will see more and more cars with FOR-SALE signs parking along roads and in front of homes.
6) Increase listings on Gumtree and other sights, like I have been receiving more sale notifications on FaceBook pages.
7) More and more calls to assist solicitors with property disputes due to financial tress.
These are my on the ground indicators combined with the property sales and listing data we receive from over 150 agencies across NSW. Hope it helps and please do share what you are seeing on the ground as you go for daily jog…