The ABS has reported that Australia’s trend estimate of employment increased by 20,700 persons in March 2019, with:
the number of unemployed persons increasing by 3,000 persons;
the unemployment rate remaining steady at 5.0%;
the underemployment rate remaining steady at 8.2%;
the underutilisation rate remaining steady at 13.2%;
the participation rate remaining steady at 65.6%; and
the employment to population ratio remaining steady at 62.4%.
Over the past year, trend employment increased by 299,100 persons (or
2.4%), which was above the average annual growth rate over the past 20
years of 2.0%. Over the same 12 month period the trend employment to
population ratio, which is a measure of how employed the population
(aged 15 years and over) is, increased by 0.4 percentage points (pts) to
62.4%.
Trend employment increased by 20,700 persons between February and March
2019. This represents an increase of 0.16%, similar to the monthly
average growth rate over the past 20 years (0.17%), and less than the
monthly average growth rate over the past five years (0.22%).
Underpinning these net changes in employment is extensive dynamic
change, which occurs each month in the labour market. In recent months
there has been around 300,000 people entering and leaving employment.
There is also further dynamic change in the hours that people work,
which results in changes in the full-time and part-time composition of
employment.
Trend full-time employment increased by 18,000 persons between February
and March 2019, and part-time employment increased by 2,700 persons.
Compared to a year ago, there are 252,800 more persons employed
full-time and 46,300 more persons employed part-time. This compositional
shift led to a decrease in the part-time share of employment over the
past 12 months, from 31.7% to 31.3%.
The trend estimate of monthly hours worked in all jobs increased by 4.3
million hours (or 0.2%) in March 2019, to 1,776.8 million hours. Monthly
hours worked increased by 2.4% over the past year, equal to the
increase in employed persons (2.4%). The average hours worked per
employed person was 138.9 hours per month, or around 32.0 hours per
week.
The trend unemployment rate remained steady at 5.0% in March 2019. The
number of unemployed persons increased by 3,000 to 675,700 persons. Over
the past year, the trend unemployment rate decreased by 0.5 pts, with
the number of unemployed decreasing by 51,100 persons.
The trend participation rate remained steady at 65.6% in March 2019,
which was equal to March 2018 (65.6%). The female participation rate
remained steady at 60.6% and the male participation rate remained steady
at 70.9%.
The labour force includes the total number of employed and unemployed
persons. Over the past year, the labour force increased by 248,000
persons (1.9%). This rate of increase was above the rate of increase for
the total Civilian Population aged 15 years and over (360,500 persons,
or 1.8%).
The trend participation rate for 15-64 year olds, which controls (in
part) for the effects of an ageing population remained steady at 78.1%.
The gap between male and female participation rates in this age range is
less than 10 pts, at 82.8% and 73.6% respectively, continuing the long
term convergence of male and female participation.
The trend participation rate for 15-24 year olds (who are often referred
to as the “youth” group in the labour market) remained steady at 68.0%.
The unemployment rate for this group remained steady at 11.4% in March
2019 and decreased by 0.7% over the year.
The trend series smooths the more volatile seasonally adjusted estimates
and provide the best measure of the underlying behaviour of the labour
market.
SEASONALLY ADJUSTED ESTIMATES
Seasonally adjusted employment increased by 25,700 persons from February
to March 2019. The underlying composition of the net change was an
increase of 48,300 persons in full-time employment and a decrease of
22,600 persons in part-time employment. Since March 2018, full-time
employment increased by 289,800 persons, while part-time employment
increased by 14,900 persons.
Seasonally adjusted monthly hours worked in all jobs increased by 13.2
million hours (or 0.7%) in March 2019 to 1,785.4 million hours.
The seasonally adjusted employment to population remained steady at
62.3% in March 2019, and increased by 0.4 pts from the same time last
year.
GRAPH 1. EMPLOYMENT TO POPULATION RATIO, PERSONS, March 2009 to March 2019
The seasonally adjusted unemployment rate increased by 0.1 pts to 5.0%
in March 2019. The participation rate increased by 0.1 pts to 65.7%.
STATE AND TERRITORY ESTIMATES
TREND ESTIMATES
In March 2019, increases in trend employment were observed in all states
and territories except Western Australia (down 200 persons) and
Tasmania (down 100 persons). The largest increases were in Victoria (up
7,600 persons), followed by New South Wales (up 6,800 persons) and
Queensland (up 4,900 persons).
Over the past year, increases in employment were also observed in all
states except Tasmania (down 2,300 persons). Both territories recorded
falls with the Australian Capital Territory (down 1,600 persons) and
Northern Territory (down 4,800 persons). The largest increases were in
Victoria (up 127,500 persons), New South Wales (up 118,500 persons),
Queensland (up 36,100 persons). The highest annual employment growth
rates were in the Victoria at 3.9%, followed by New South Wales at 3.0%
and Queensland at 1.5%. For most states and territories, year-on-year
growth in trend employment was below their 20 year average, the
exceptions being New South Wales and Victoria.
The monthly trend unemployment rate increased by 0.1 pts in Tasmania
(6.5%) and the Australian Capital Territory (3.6%). It remained
unchanged in New South Wales (4.3%), Victoria (4.6%) and South Australia
(5.9%). It decreased by under 0.1 pts in Western Australia (6.1%) and
Queensland (5.9%), and fell 0.2 pts in the Northern Territory to 4.4%.
The monthly trend underemployment rate increased in the Northern
Territory (up 0.2 pts to 5.4%), Victoria (up 0.1 pts to 8.4%) and
Tasmania (up less than 0.1 pts to 10.1%). Decreases of up to 0.1 pts
were seen in New South Wales (7.5%), South Australia (8.9%), Queensland
(8.6%), Western Australia (8.9%) and the Australian Capital Territory
(5.9%).
Monthly trend participation rate decreases were observed in Northern
Territory (down 0.2 pts to 73.8%), Western Australia (down 0.1 pts to
67.8%) and Australian Capital Territory (down 0.1 pts to 69.2%). The
monthly trend participation rate increased less than 0.1 pts in New
South Wales (65.2%) and Victoria (66.1%). It remained unchanged in all
remaining states.
SEASONALLY ADJUSTED ESTIMATES
In seasonally adjusted terms, the largest increase in employment was in
Queensland (up 10,400 persons), followed by Victoria (up 10,000 persons)
and South Australia (up 8,500 persons). The largest decrease was in New
South Wales (down 2,600 persons) followed by Tasmania (down 1,800
persons).
The seasonally adjusted unemployment rate increased in Queensland (up
0.7 pts to 6.1%), South Australia (up 0.2 pts to 5.9%), Tasmania (up 0.2
pts to 6.7%), Western Australia (up 0.1 pts to 6.0%) and New South
Wales (up 0.1 pts to 4.3%). The only decrease in the unemployment rate
was observed in Victoria (down 0.1 pts to 4.6%).
The largest underemployment rate increase in seasonally adjusted terms
was seen in Queensland (up 0.9 pts to 8.9%) followed by South Australia
(up 0.4 pts to 8.8%), Western Australia (up 0.3 pts to 8.9%) and
Tasmania (up 0.2 pts to 9.9%). The only decrease was seen in New South
Wales (down 0.2 pts to 7.4%).
The largest increases in the seasonally adjusted participation rate were
in South Australia (up 0.7 pts to 63.2%) and Queensland (up 0.6 pts to
65.6%). The seasonally adjusted participation rate decreased in
Tasmania (down 0.4 pts to 60.3%), New South Wales (down 0.1 pts to
65.1%) and Victoria (down 0.1 pts to 66.0%).
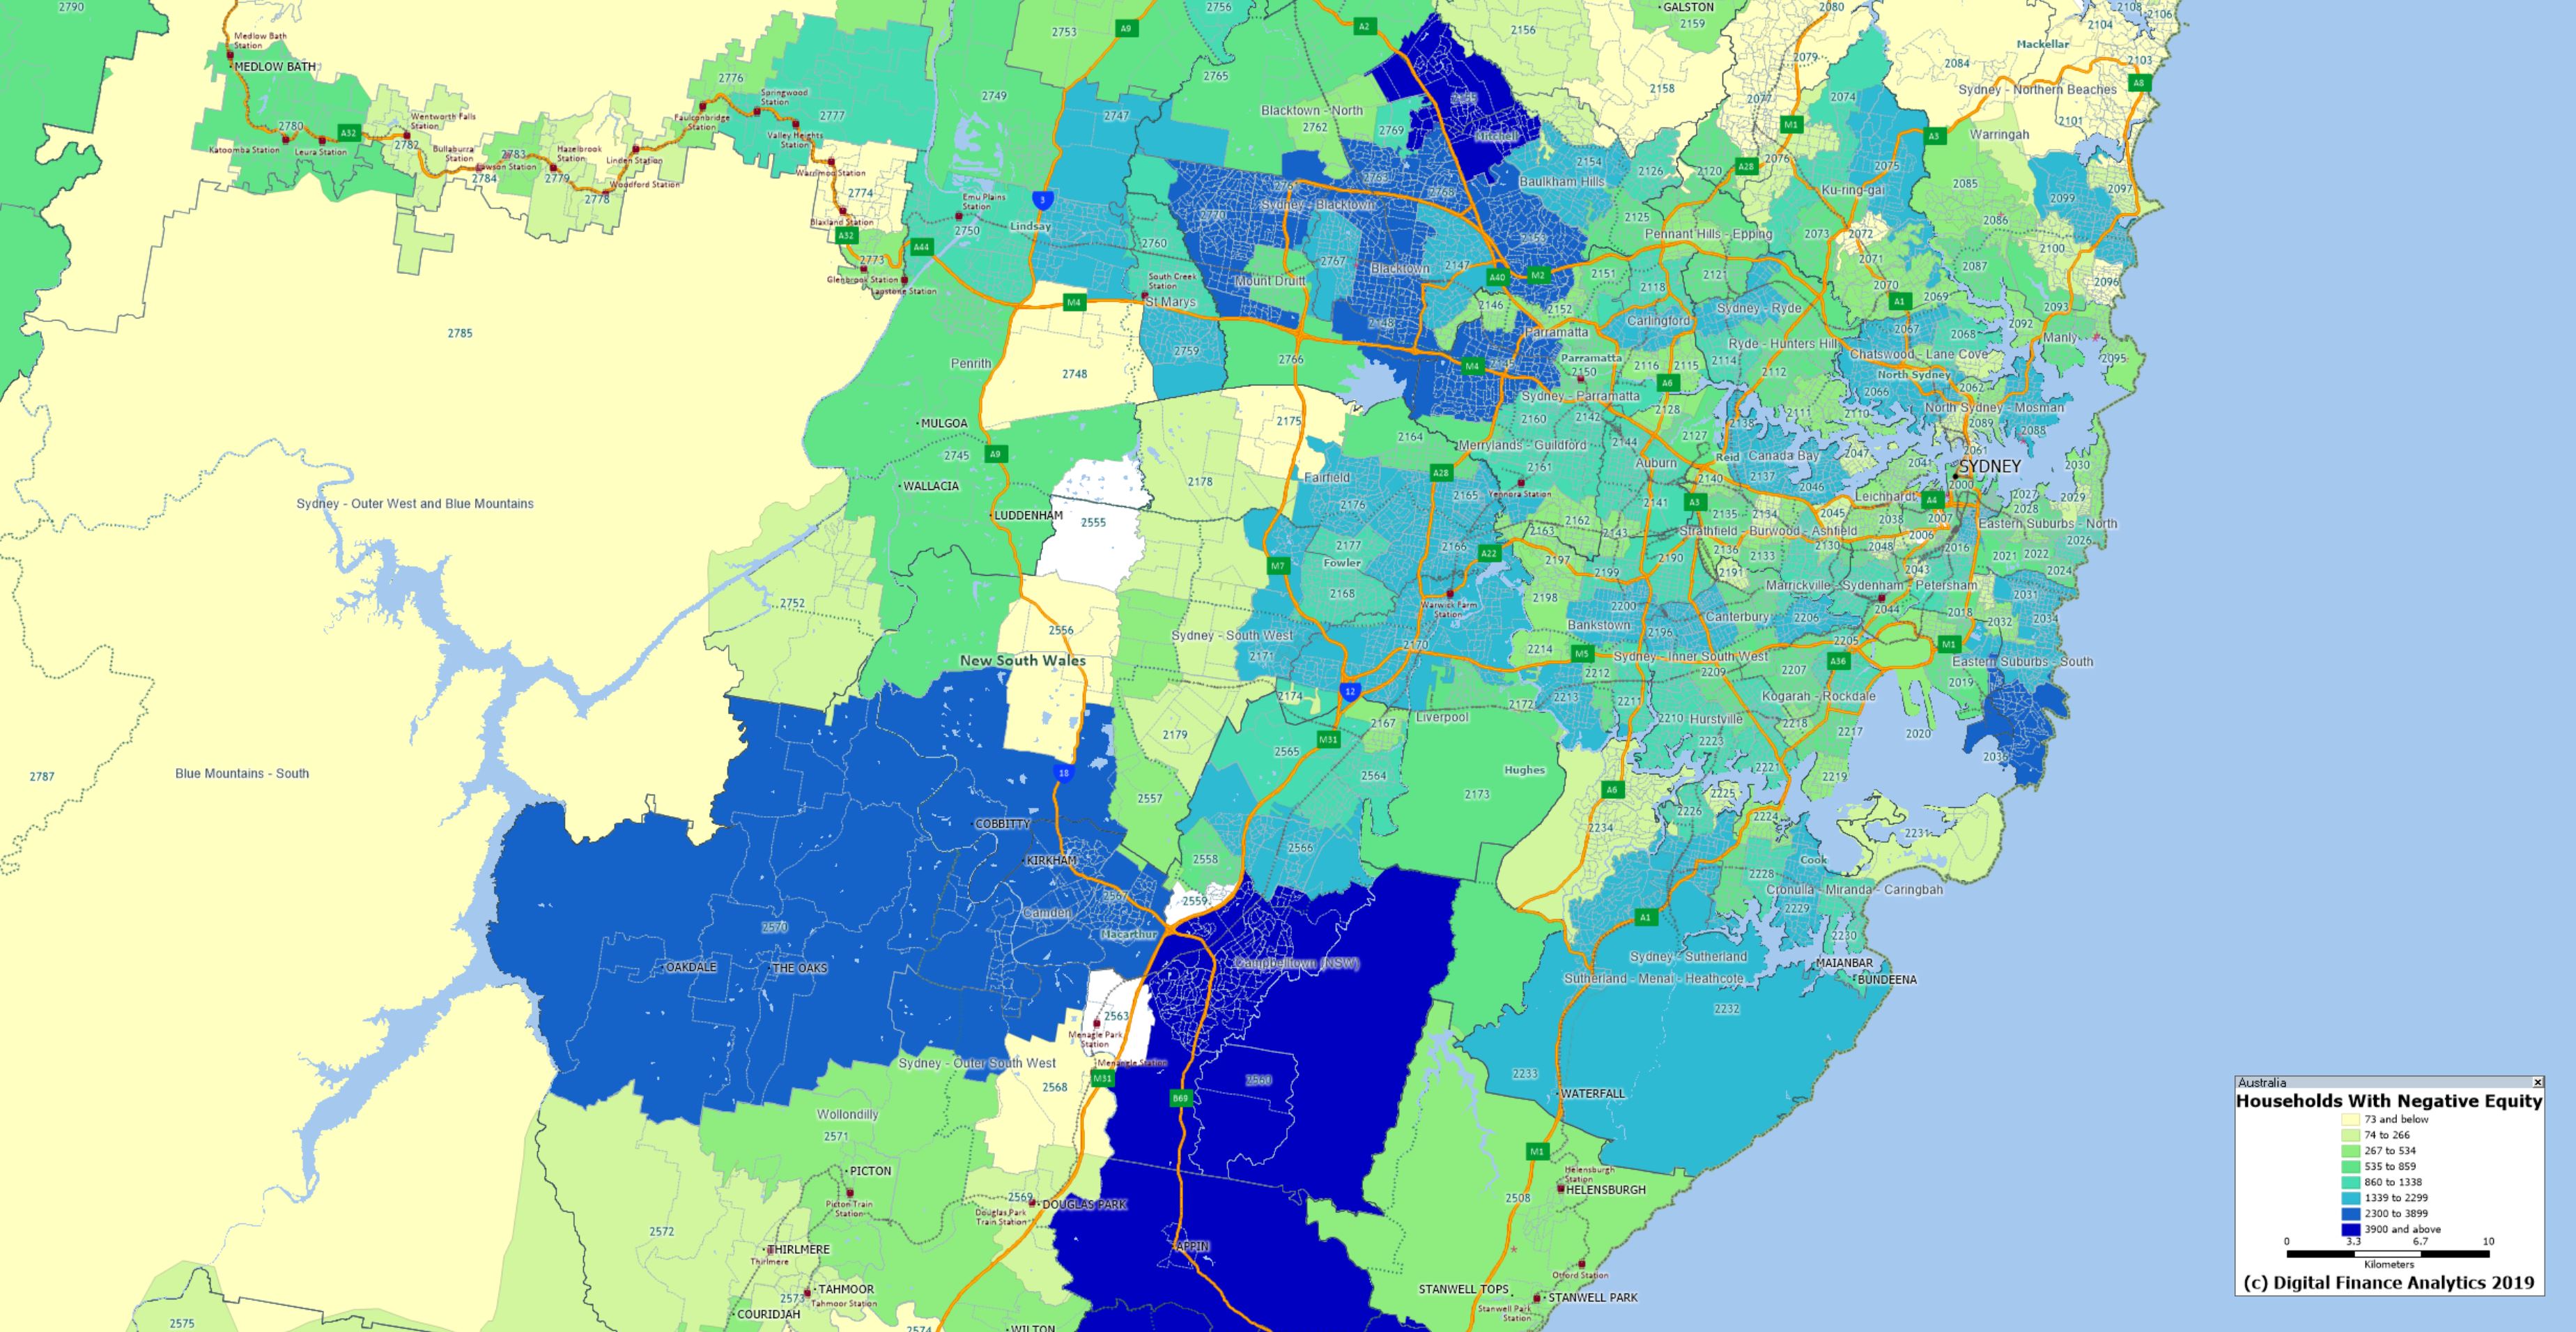
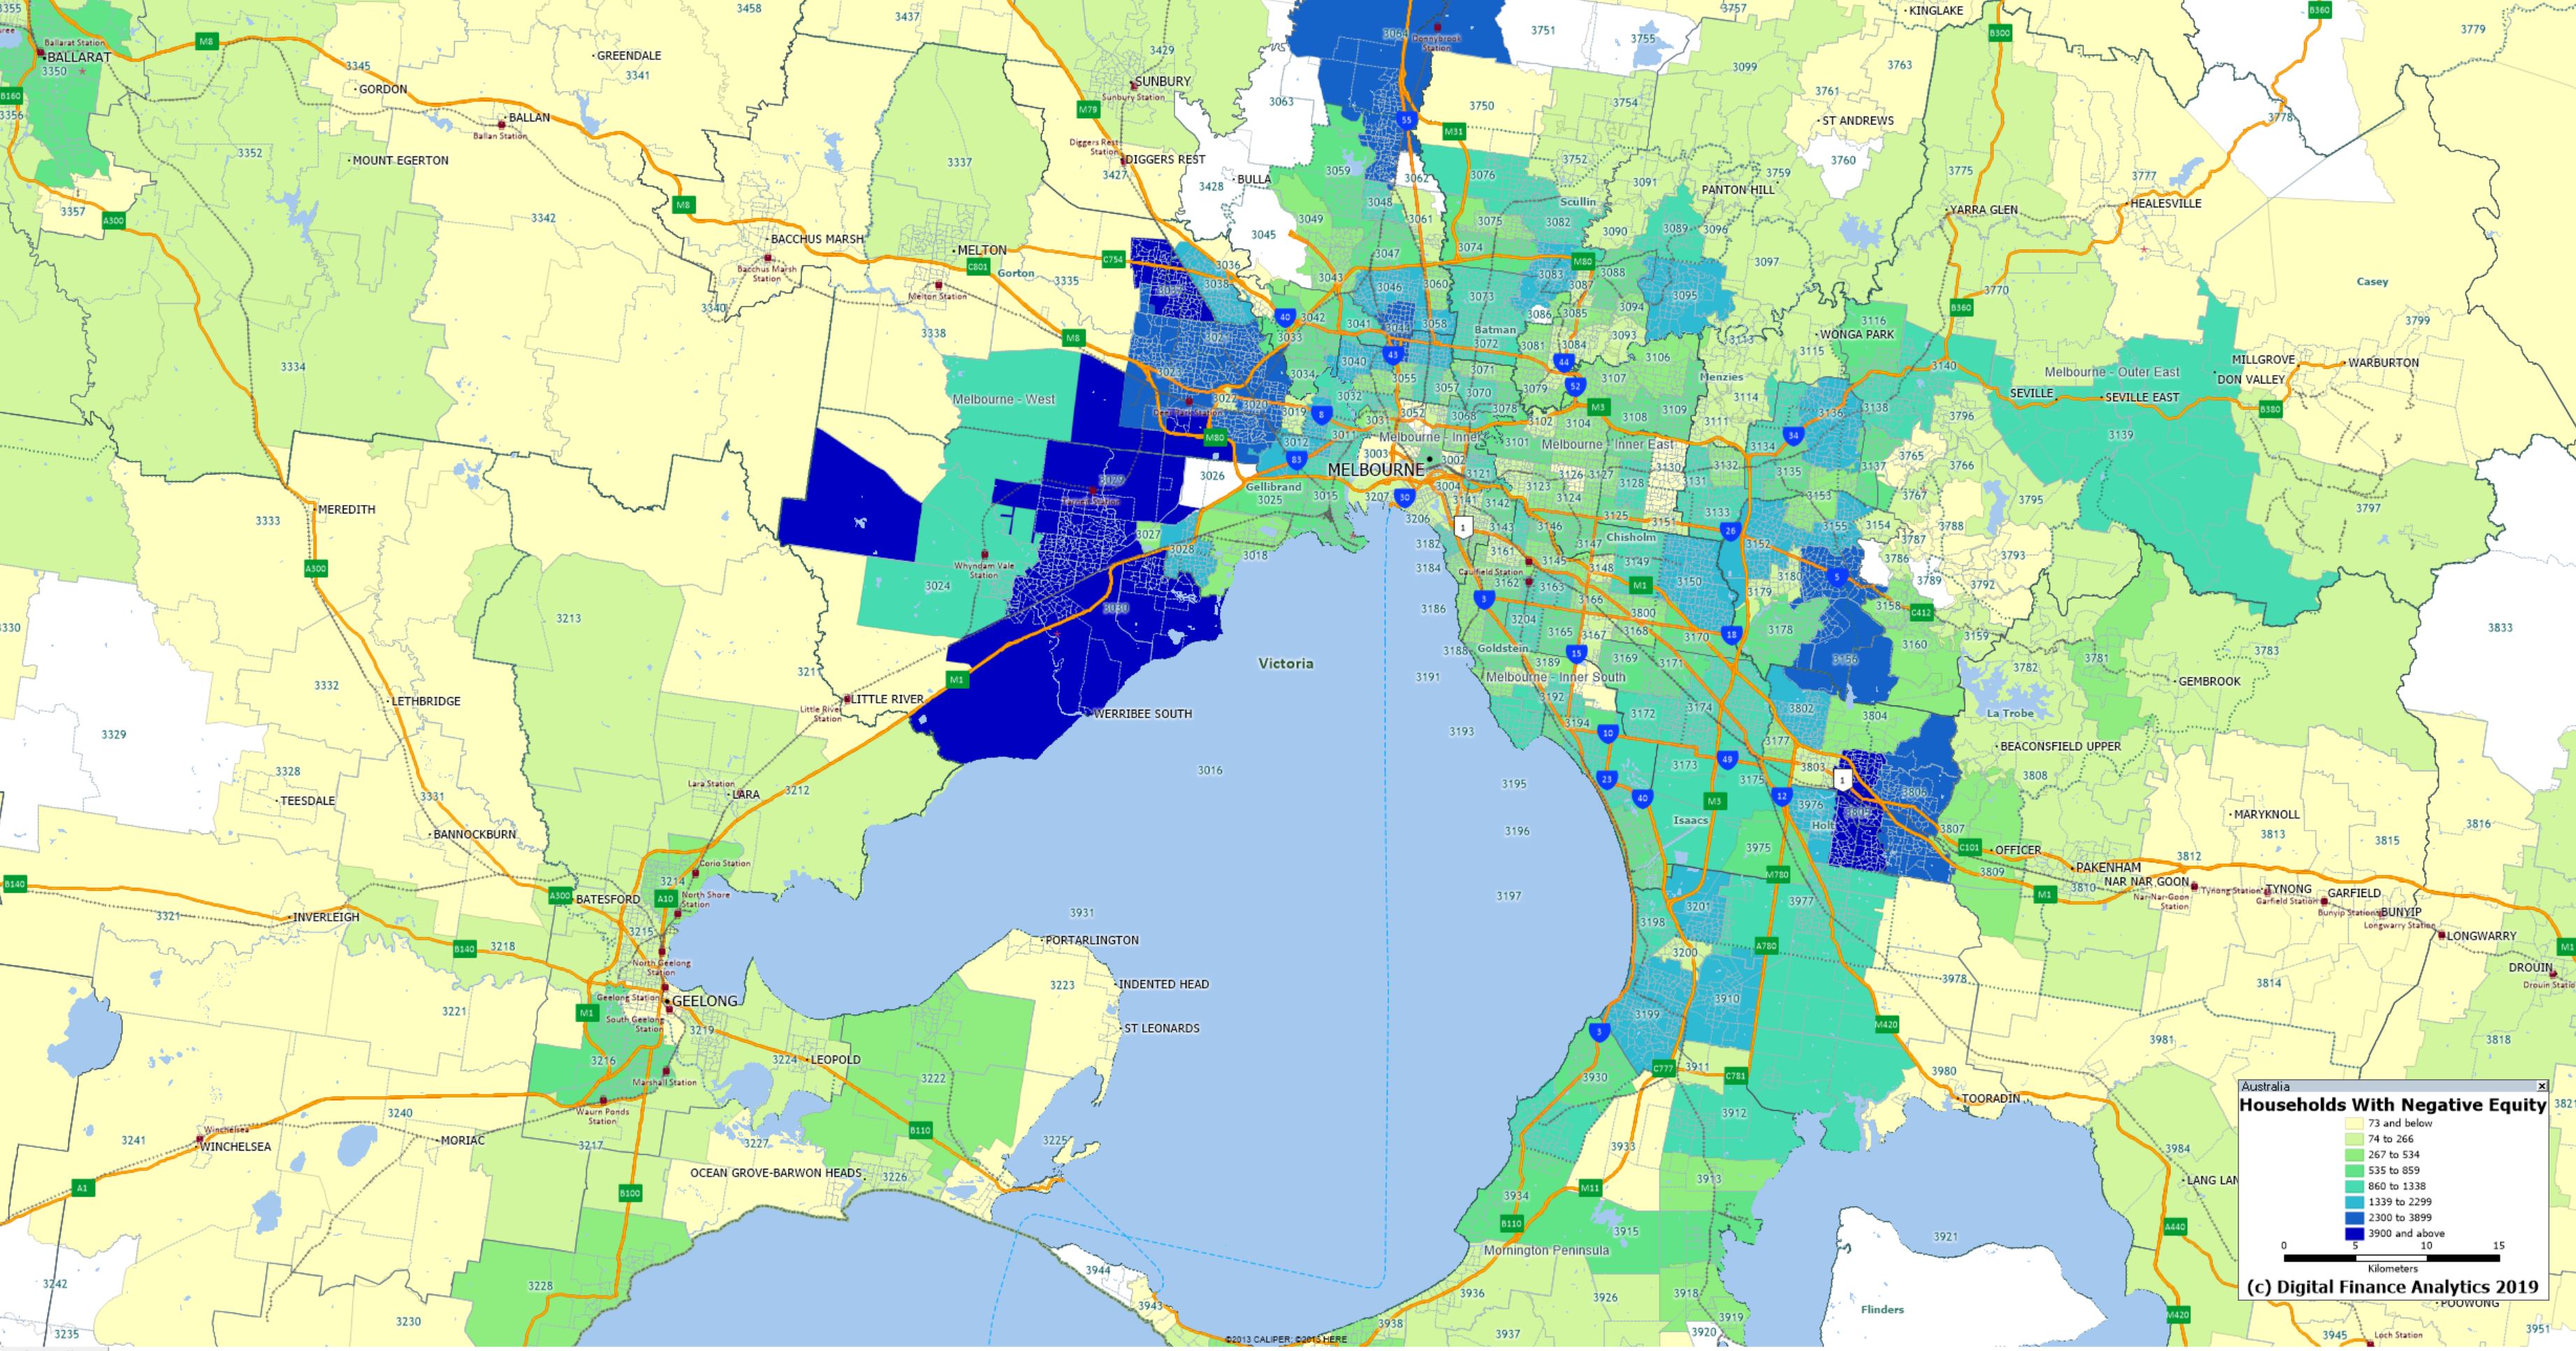
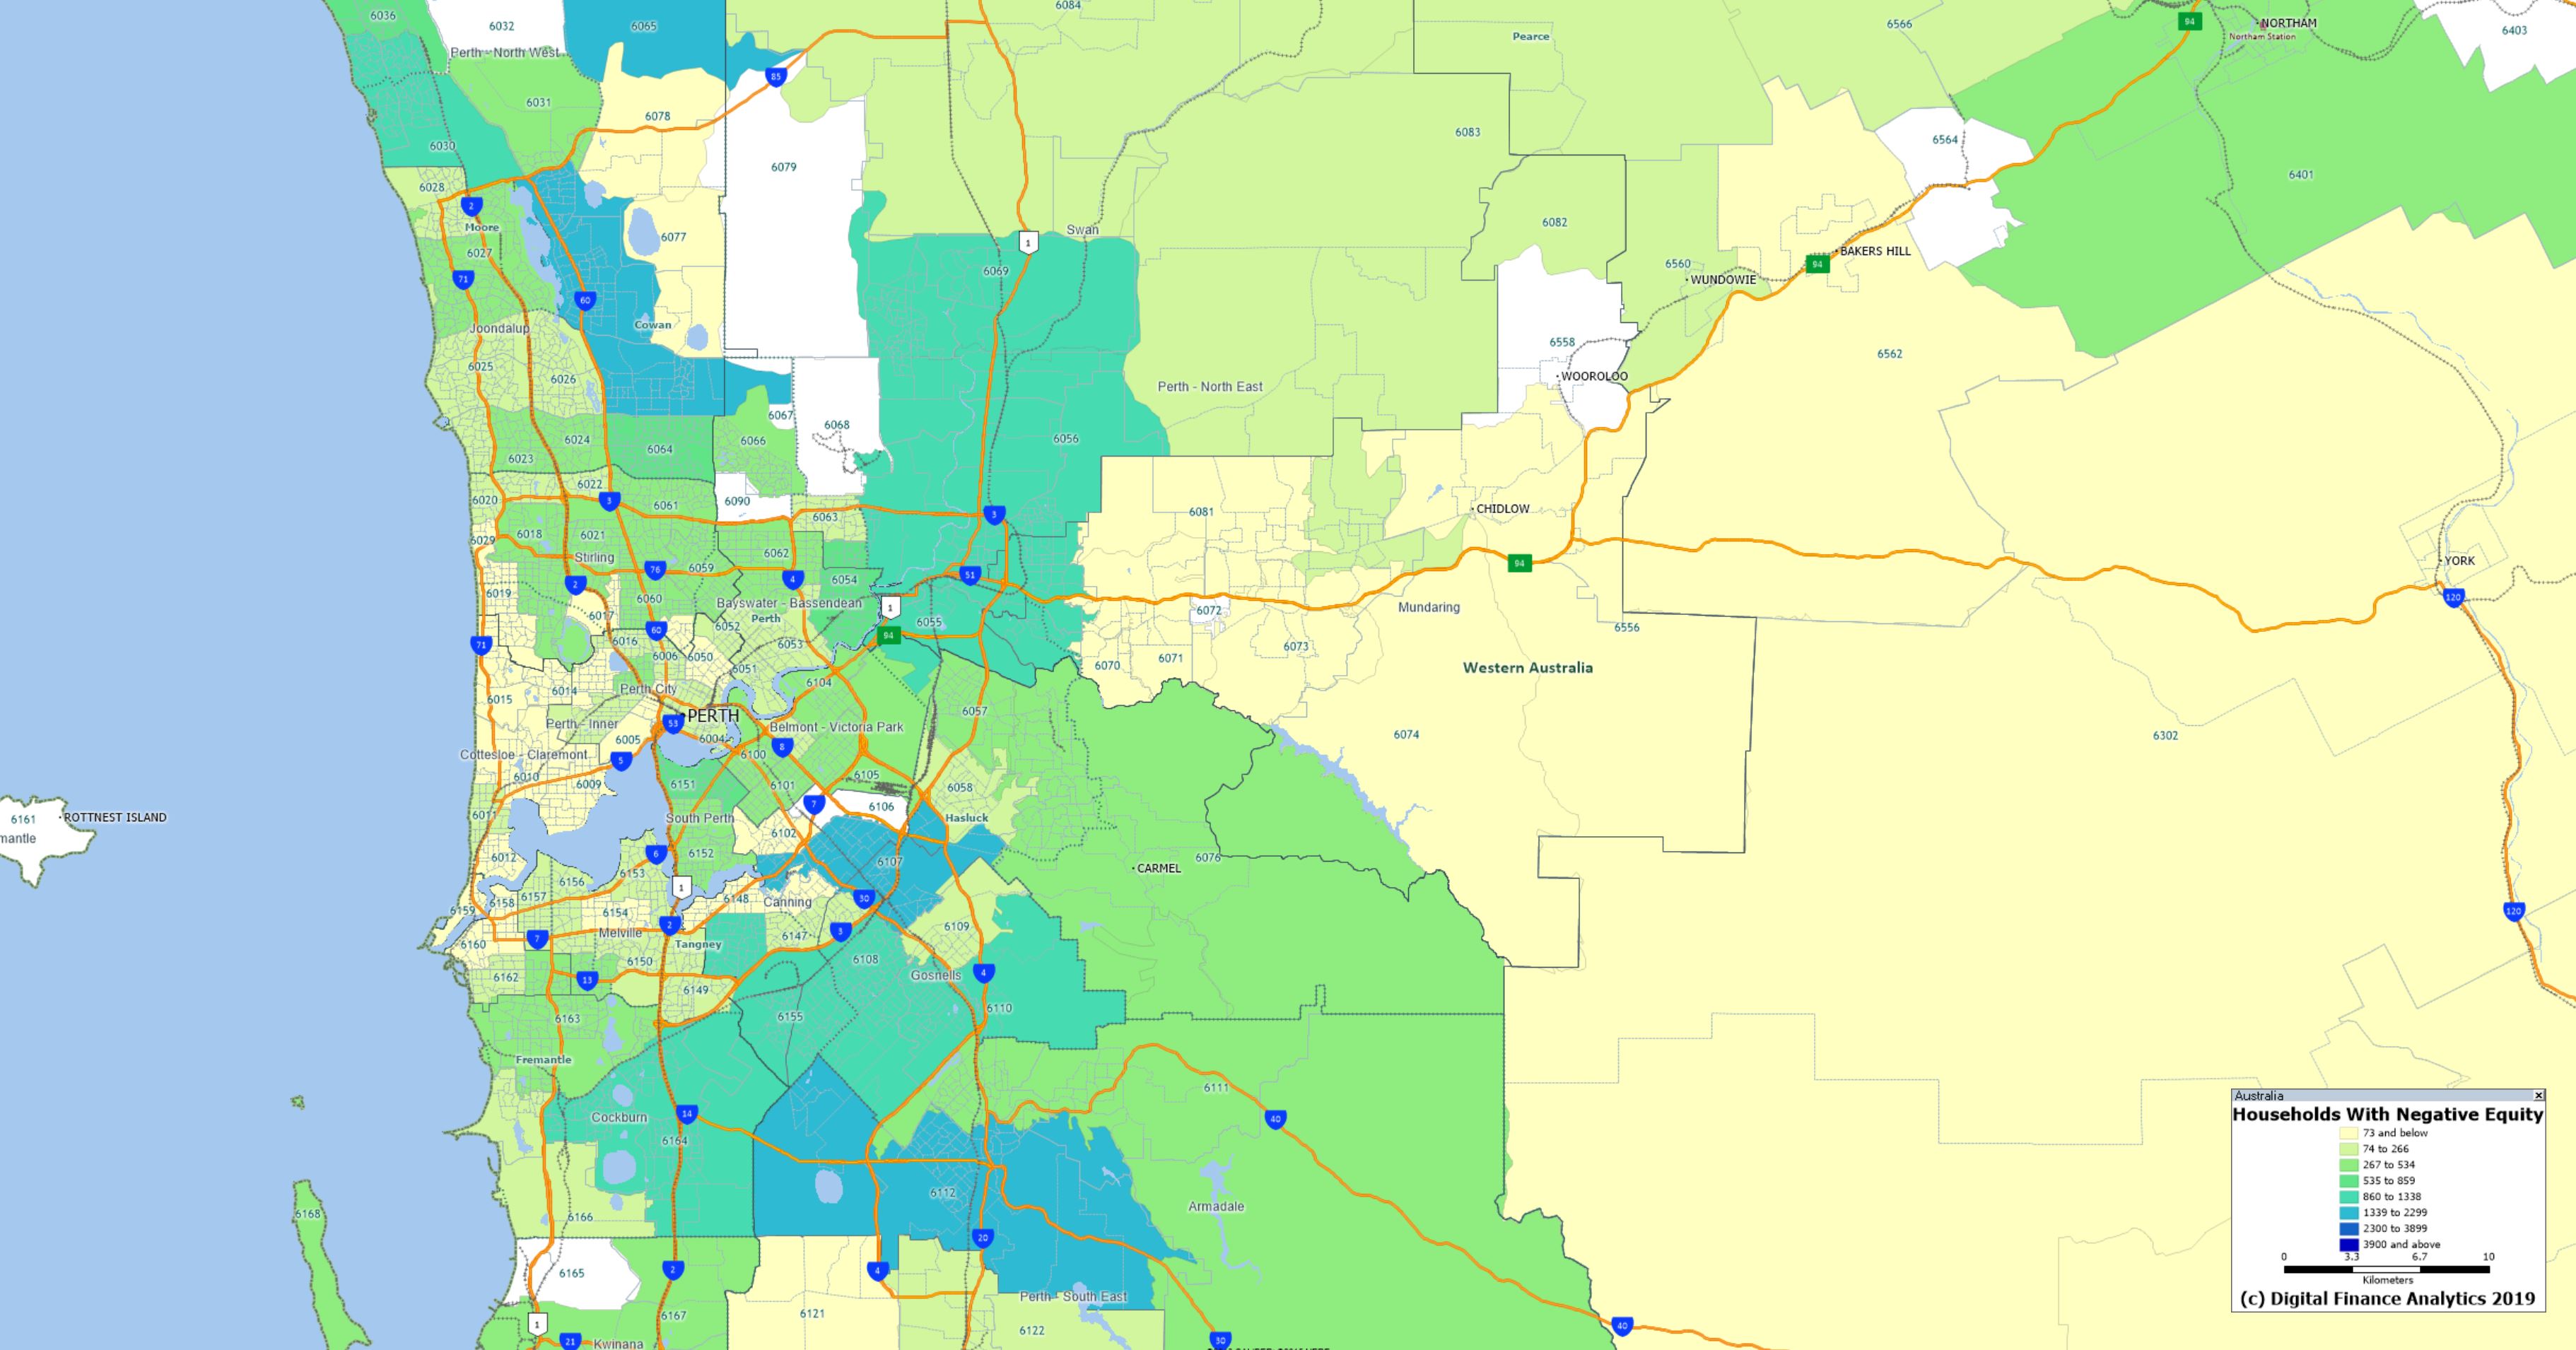
Following 7/30’s report last night I have received a number of requests for access to the maps. So here are the high resolution versions for Sydney, Melbourne and Perth. If they are reproduced elsewhere, please attribute DFA.
As discussed in my video, this is based on the number of households in each post code recording at least one property in negative equity – where the current mortgage (net of any offset accounts) in greater than the estimated current forced sale value plus sale costs. The analysis is based on results from our 52,000 household surveys nationwide.
The major
banks have seen their reputations significantly downgraded in an annual
perception survey, with AMP placing last out of 60 Australian companies.
The
Reputation Institute’s Australia RepTrak 2019 list examined 60 of the
top revenue making Australian firms, which saw all of the big four banks
and AMP ranked within the bottom ten.
The list was based on a
survey with around 10,000 respondents giving ratings across factors such
as trust and respect to generate overall reputation, in addition to
seven parameters: products/services, innovation, workplace, citizenship,
governance, leadership and performance.
AMP scored the lowest out of any company across all seven dimensions, dropping by 18 rankings from 2018.
NAB was the next lowest bank, falling at 58th place and having fallen 15 rankings from the year before.
Commonwealth Bank of Australia remained at its spot of 57th, while Westpac fell nine places to 55th.
ANZ fared the best of the big four, coming in at 51st, having fallen 16 places.
“In
the past 12 months we’ve seen many issues raised about corporate
behaviour and consumer trust,” Oliver Freedman, vice president and
market leader, Reputation Institute said.
“As a result, the reputations of our major banks and some financial services organisations have taken a major hit.”
Meanwhile,
Bendigo and Adelaide Bank rose seven places to 11th, which Mr Freedman
said was due to a strong performance in the individual measurements of
citizenship and governance.
“This proves that you can be a bank
and still have a strong reputation if you are focused on reputation
drivers that resonate with customers and increase trust,” he added.
Macquarie on the other hand came in at 42nd, down five places, as Allianz fell seven places from the year before to 37th.
New addition to the list Rest Super ranked 21st,while the Reserve Bank of Australia placed 18th, having risen by eight places.
AustralianSuper was down eight places to 15th.
“The
banking sector has a long road to recovery and could learn a lot from
those with consistently strong rankings, like Qantas and Air New
Zealand,” Mr Freedman said.
A brief segment on the ABC today which includes DFA data on negative equity, the Kouk, and reference to the RBA data.
They missed two important points I made in my interview, first my data is households not loans, and second the falls in value should require banks to mark to market their portfolios.
The maps can be seen here. This video walks through the mapping in detail.
The latest global bank ratings from S&P Global Market Intelligence has once again concluded that China’s big four state-backed banks are the world’s largest, via InvestorDaily.
The
big four – Industrial & Commercial Bank of China, China
Construction Bank Corp, Agricultural Bank of China and Bank of China –
posted a combined $13.647 trillion in assets, up $1.727 trillion since
last year.
A weakened dollar hampered the US bank’s rankings with
Wells Fargo & Co being pushed out by France’s Credit Agricole Group
to take the number 10 spot.
Strengthening currencies assisted a
number of banks in the Asia-Pacific region, with the Chinese yuan
appreciating by 6.81 per cent against the US dollar in 2017.
This
let the four Chinese banks post $13.637 trillion, which was up 14.43
per cent from 2016. Had the yuan remained flat against the dollar, the
institutions would only have posted US$12.768 trillion in assets.
JP Morgan Chase & Co took out number 6 but
would have taken number 4 if the company reported under IFRS, which
requires the gross value of derivative assets to be reported, rather
than the net value which it currently reports.
Eighteen of the
top 100 banks are based in China with $23.761 trillion in assets,
followed by the US with 11 banks holding $12.196 trillion and then Japan
with eight banks at $10.534 trillion.
The largest bank in
Australia was Commonwealth Bank with $751.39 billion in assets taking
out number 43, down from last years 42.
ANZ came in next at spot
45, falling two spots from 2017’s 43 and then Westpac took out spot 47
which was up from last year’s 48 and NAB came in at 50, down from 49.
In
the Asia-Pacific region, three of Australia’s big four took out spots
in the top 20, with CBA, ANZ and Westpac taking out rankings 18, 19 and
20 respectively. NAB, meanwhile, was just behind in spot 22. The big
four were the only Australian banks to make it into the top 50 for the
Asia-Pacific region.
China again dominated the top 50 with 21
institutions, followed by Japan and South Korea who had eight and six
institutions respectively.
There were two new comers to the list,
one from Taiwan, CTBC Financial Holding which placed 46 with US$180.03
billion in assets and Indian-based HDFC which took out number 50 with
$169.53 billion.
The RBA released their minutes today, and they highlight the current tensions between the domestic GDP and labour market data evolve. But more negative news was recited in the minutes, and this suggests rate cuts, not rate rises.
International Economic Conditions
Members commenced their discussion by noting that the slower pace of global economic activity had
continued in recent months. This had been particularly evident in the manufacturing sector. Survey
measures of conditions in the manufacturing sector had declined across a range of economies, although
they had ticked up in China in March. Slower external demand, especially from China, had continued to
weigh on export growth and the manufacturing sectors in the trade-exposed economies of east Asia, Japan
and the euro area. In east Asia, the electronics cycle had turned, which had affected the
region’s exports as well as investment in those economies with sizeable semi-conductor
sectors.
Recent trade talks between the United States and China had taken on a somewhat more positive tone.
However, the United States had also said it would consider imposing restrictions on automotive imports,
which would affect large car exporters, including Germany and Japan.
In the major advanced economies, however, domestic demand conditions had remained positive, supported
by an easing in financial conditions since the beginning of 2019, and were consistent with growth being
around, or even above, potential. Underlying inflation had remained close to target in a number of
advanced economies, but global headline inflation had declined since late 2018 because of the fall in
oil prices.
Growth in consumption in the advanced economies had been supported by ongoing tightness in labour
markets, which had led to an upward trend in wages growth over a number of years. In the United States,
the unemployment rate had remained below levels consistent with full employment and employers had been
finding it increasingly difficult to find suitable labour. Members observed that most sectors of the US
labour market had experienced strong conditions and the pick-up in wages growth had been most pronounced
for lower-income workers.
In Japan, consumption was expected to be supported by a bring-forward of spending ahead of an increase
in the consumption tax in October 2019, as well as ongoing tightness in the labour market. In the euro
area, the unemployment rate had been declining gradually and wage pressures had increased. However,
employment intentions had eased in the euro area and, more sharply, in the United Kingdom in the context
of ongoing uncertainty around Britain’s exit from the European Union.
The outlook for investment across the major advanced economies had been more mixed. In the United
States, investment indicators had eased a little but remained above average, while investment in the
euro area had weakened further. Members noted that political uncertainty in the United Kingdom and the
euro area was weighing on investment in those economies. In Japan, survey measures suggested that
business conditions would remain strong despite a prospective moderation in investment growth.
In China, growth in domestic demand had slowed. At its March meeting, the National People’s
Congress had set a target of 6–6.5 per cent for growth in output in 2019, which was
below the target of around 6.5 per cent in 2018. Members noted signs that stimulus measures
implemented by the authorities over recent months were having an impact: growth in total social
financing had increased a little, after slowing over the preceding year, and growth in infrastructure
investment and retail spending had recovered. Residential construction activity had also increased.
However, some recent indicators of production and investment in the manufacturing sector, which is more
exposed to external demand, had been subdued. Exports from China to the United States had continued to
decline, but China’s imports from the United States had increased a little over the first few
months of 2019, after an earlier sharp decline. Australian coal shipments had continued to be affected
by customs delays at Chinese ports.
Australia’s terms of trade had increased in the December quarter to be around
6 per cent higher over 2018. The terms of trade were expected to have increased further in the
March quarter, although commodity price developments had been mixed since the previous meeting. Bulk
commodity prices had been little changed because falls in coal prices had been largely offset by an
increase in iron ore prices. Oil prices had risen, but were still 20 per cent below their
recent peak in October 2018. Reflecting oil price movements in late 2018, liquefied natural gas (LNG)
prices were expected to have declined over the first quarter of 2019. Other commodity prices had been
little changed over the previous month.
Domestic Economic Conditions
Members commenced their discussion of the domestic economy by observing that growth had slowed markedly
in the second half of 2018 compared with the first half. GDP had increased by 0.2 per cent in
the December quarter and by 2.3 per cent over the year, which was below the forecasts
presented in the February Statement on Monetary Policy. The soft December quarter outcome
partly reflected another weak quarter of consumption growth and a larger-than-expected fall in dwelling
investment. It also reflected some temporary factors, such as the weather-related disruption to resource
exports and the effect of the drought. Public demand and non-mining investment had supported output
growth. Members noted that the income-based measure of GDP growth had been particularly weak over the
preceding year, while the expenditure-based measure had been stronger.
Growth in consumption had clearly slowed in the second half of 2018. The weakness had been concentrated
in discretionary items, especially those that have historically been most correlated with housing prices
and housing turnover, such as motor vehicles and home furnishings. Retail sales data and contacts in the
Bank’s liaison program suggested that growth in housing-related consumption had remained soft in
recent months.
Members noted that growth in household disposable income, which is an important driver of consumption
growth, had been subdued for a number of years. In 2018, labour income growth had been above the very
low rates seen in recent years, supported by a pick-up in growth in average hourly earnings and
continued employment growth, but non-labour income growth had remained weak. Members observed that tax
payments by households had been growing noticeably faster than income growth in recent years, partly
because of efforts to increase tax compliance.
Dwelling investment appeared to have passed its peak, although there continued to be uncertainty about
how quickly dwelling investment might decline over the forecast period. Construction of new dwellings
had contracted in the second half of 2018; the largest falls in the December quarter had been for
apartments in New South Wales and detached housing in Queensland. Slower housing activity had also
weighed on the incomes of some building contractors and property professionals in the December quarter.
There continued to be a large amount of work in the pipeline, which should support a relatively high
level of building activity in the near term. Members noted that there had been a substantial rise in
building approvals for high-density residential projects in February, although this series was volatile
and in trend terms remained well below earlier peaks. Members also noted that population growth was
expected to continue to support demand for housing over the medium term.
Conditions in the established housing market had remained weak in recent months. Housing prices had
continued to fall in Sydney, Melbourne and Perth, and had declined a little in most other capital cities
and regional areas. In March, Sydney prices were 13 per cent below their 2017 peak and
Melbourne prices were 10 per cent below their peak. Although auction clearance rates in Sydney
and Melbourne had increased over the first quarter of 2019, they remained at relatively low levels.
Members noted that in Perth, housing prices had declined over the previous year, while the rental
vacancy rate had declined sharply and there were signs that newly advertised rents were starting to
increase. By contrast, rental vacancies in Sydney had risen, particularly in suburbs where the supply of
new apartments had increased significantly.
Non-mining business investment had grown solidly in the December quarter, with non-residential
construction having made the largest contribution to growth in the quarter, driven partly by strong
growth in private sector infrastructure projects, such as roads and renewable energy. Forward-looking
indicators, such as the substantial amount of work still to be done on private infrastructure projects,
the relatively high level of non-residential building approvals and positive business investment
intentions, pointed to further growth in non-mining business investment. Survey measures of business
conditions had declined in late 2018, but had stabilised at above-average levels.
Mining activity had subtracted from growth in the second half of 2018, mainly reflecting ongoing
declines in mining investment as remaining LNG projects approached completion. Members noted that
investment required to sustain capacity and recently announced expansion projects were expected to
support stronger mining investment over the medium term. Declines in resource exports, partly related to
supply disruptions, had also subtracted from growth in the second half of 2018. Coal exports to China
had declined by 20 per cent, partly as a result of weather-related disruptions. The longer
time taken for imports of coal to clear Chinese customs in recent months was also likely to have played
a role. Liaison contacts had reported that they expected to continue to be able to redirect coal
shipments intended for China to other destinations. Members noted that there had been some disruptions
to iron ore shipments as a result of Tropical Cyclone Veronica, which were likely to have affected iron
ore export volumes in March.
The ongoing effects of the drought had weighed on farm output and income in the December quarter, and
rural exports had declined; farm GDP had fallen by more than 6 per cent over the second half
of 2018. Based on the latest estimates from the Australian Bureau of Agricultural and Resource Economics
and Sciences, farm production was expected to improve gradually in 2019/20
assuming rainfall returned to average levels. This was a more favourable outlook than had been assumed
in the forecasts presented in the February Statement on Monetary Policy. However, members
noted that shortages of water in the Murray-Darling Basin had been severe and that it would take
significant rainfall to increase soil moisture content from current low levels in this region.
Public demand had contributed strongly to GDP growth over 2018, supported by spending on the National
Disability Insurance Scheme and aged care and health services, and investment in infrastructure. Members
noted that, despite this, the overall fiscal impact on the economy had been negative because of slow
growth in some other forms of government expenditure and strong growth in tax revenues.
The labour market had continued to improve in early 2019, despite the slowing in growth recorded in the
national accounts through 2018. Employment had increased a little in February, following strong growth
in January, and the unemployment rate had declined to 4.9 per cent, continuing the run of
months with an unemployment rate at or around 5 per cent. Other measures of spare capacity,
including the underemployment rate and the long-term unemployment rate, had also trended downwards. The
participation rate had been relatively stable at a high level over the preceding year or so.
Employment growth over the previous year had been particularly strong in the health care & social
assistance, professional services and construction industries. Over the same period,
employment-to-population ratios had increased further in New South Wales and Victoria, where
unemployment rates had been around historically low levels. Employment-to-population ratios had declined
a little in other states more recently. Forward-looking indicators of labour demand had been mixed in
recent months. Job advertisements had eased, but job vacancies reported by employers through the ABS
survey had increased further as a share of the labour force in February.
Financial Markets
Members commenced their discussion of financial market developments by noting that global financial
conditions remained accommodative and had eased over the preceding couple of months.
Market expectations for the future path of monetary policy in a number of economies had been lowered
since the beginning of the year. This was consistent with guidance from major central banks that
monetary policy would remain more accommodative than earlier expected, given downward revisions to
growth forecasts and little upside risk to inflation despite increasingly tight labour markets.
At its March meeting, the US Federal Open Market Committee (FOMC) had kept the federal funds rate
unchanged and announced that the decline in the Federal Reserve’s asset holdings would slow from
May and cease after September, which was sooner than had been expected. The FOMC also published the
quarterly update of its members’ projections for where they believed the federal funds rate was
likely to be in coming years. These projections implied that the federal funds rate was likely to remain
unchanged throughout the rest of 2019, followed by one increase (of 25 basis points) in 2020. By
contrast, at the time of the December 2018 meeting, the median FOMC projection had been for two rate
increases in 2019 and one in 2020. Policy expectations implied by financial market pricing had also been
revised down since December. These implied that the next move in the federal funds rate was expected to
be down.
In the euro area and Japan, financial market pricing indicated that policy rates were expected to be
maintained at very low levels for an extended period, in line with recent statements by the respective
central banks. In March, the European Central Bank had announced that it would roll over a long-term
lending program to euro area banks. In Canada, New Zealand and Australia, financial market pricing
implied that declines in policy rates were expected in the coming year or so.
Members noted that 10-year government bond yields had declined noticeably across all major markets over
the preceding month. In some cases, including in Australia, yields had declined to historic lows. These
declines had reflected lower expected paths for monetary policy, lower term premiums and, to varying
extents, lower inflation expectations. In Germany and Japan, long-term bond yields had again turned
negative, approaching the lows that had been reached in 2016. In the United States, long-term rates had
moved below some short-term rates for a brief period, with market commentators noting that past episodes
of yield curve inversion had tended to precede recessions. At the same time, the recent decline in risk
premiums in credit and equity markets suggested financial market participants did not consider a
recession to be likely.
Members observed that financing conditions for corporations had improved. Corporate bond yields had
moved lower, reflecting the decline in government bond yields as well as a decline in spreads following
increases in late 2018. Non-financial firms had increased their bond issuance in 2019, particularly in
the US dollar high-yield sector. By contrast, issuance of leveraged loans had been more subdued, which
partly reflected an easing in investors’ appetites for floating rate securities in response to
the lowering of policy rate expectations. Equity markets in the advanced economies had been little
changed in March, having previously rebounded from their sharp fall in late 2018.
In China, equity markets had risen particularly sharply since the end of 2018, which was likely to have
reflected some easing in US–China trade tensions, as well as the authorities’ stimulus
measures. Growth in total social financing had increased a little in recent months, as the authorities
had taken measures to encourage bond issuance. They had also encouraged banks to provide finance to
smaller private firms. To support this, the authorities had signalled additional targeted monetary
easing for the period ahead. These changes had followed a slowing in the growth of total social
financing over the preceding year or more as the authorities had taken measures to reduce non-bank
lending, which had been an important source of funding for private firms, in order to reduce overall
risks in the financial system.
In other emerging markets, conditions had been relatively stable in 2019, although Argentina and Turkey
had experienced renewed depreciation of their exchange rates in response to continued macro-financial
and political risks in those economies.
Members noted that there had been little change in major economies’ foreign exchange markets
over the preceding month. The Australian dollar had also been little changed, remaining at the lower end
of its range of recent years. The strength in commodity prices and the terms of trade had been
supporting the exchange rate, while the continued decline in Australian government bond yields relative
to those in other major markets had been working in the opposite direction.
Growth in housing lending to owner-occupiers had slowed to 4¾ per cent in
six-month-ended annualised terms, although the monthly growth rate had increased slightly in February.
Growth in housing lending to investors remained at a very low level. Housing loan approvals were
materially below the levels of a year earlier, but had also increased slightly in February, with the
small uptick in approvals broadly based across types of borrowers. Members observed that the slowing in
housing lending over the preceding year had been driven largely by weakness in demand, particularly from
investors. There had also been some tightening in lending practices. Lenders continued to compete for
borrowers of high credit quality by offering lower interest rates on new loans than typically paid on
existing loans.
Members noted that the major banks’ funding costs had declined over the preceding couple of
months. The cost of debt funding had declined as pressures had eased in short-term money markets and
bank bond spreads had narrowed. Deposit rates had also continued to edge downwards.
Funding conditions for Australian businesses more broadly were accommodative. Three-year bond yields
for corporations across all major sectors had declined to record lows, reflecting the decline in both
government bond yields and spreads. Bond issuance by non-financial corporations in the first quarter of
2019 had been in line with that of recent years. Growth in bank lending to businesses had remained
robust, in part reflecting increased lending by the major banks, although other institutions had
accounted for most of the growth. Members observed that the growth in business lending had been entirely
to large businesses. Meanwhile, credit conditions for some small businesses were reported to have
tightened further recently.
Financial market participants’ expectations of a rate cut had been brought forward following
weaker than expected data, most notably the December quarter national accounts. Financial market pricing
implied that the cash rate was expected to be lowered in the second half of 2019 and then again in
2020.
Financial Stability
Members were briefed on the Bank’s regular half-yearly assessment of the financial system.
Overall, members noted that financial stability risks were slightly higher than six months earlier but
were not especially elevated.
Globally, investors were receiving little compensation for taking on risk. Notably, risk-free rates
were very low and the term premium in the United States had briefly turned negative. Furthermore,
corporate bond spreads remained low. These conditions had contributed to the significant increase in
borrowing by businesses since the global financial crisis. However, members noted that debt servicing
costs had not increased to the same extent, given the decline in interest rates over this period. The
high prices of a range of assets in this environment meant that there was heightened risk of an abrupt
repricing in response to news.
Members observed that the profitability of banks globally had generally increased. In part, this
reflected above-trend economic growth in the first half of 2018. However, some European banks remained
fragile, given large stocks of non-performing loans, high cost structures and overcapacity. The large
stock of sovereign debt held by some European banks, along with concerns about sovereign debt
sustainability, raised potential issues about the resilience of some banking systems.
In China, the authorities had taken measures to contain risks in the financial system. As a result, the
pace of growth in debt had slowed to below the pace of growth in the economy. However, given the earlier
rapid growth in debt, China’s ratio of non-financial debt to GDP remained higher than in other
economies with comparable income and even higher than in many high-income economies. Members noted that
the earlier rapid growth in debt had also raised concerns about the lending standards under which those
loans had been made.
In Australia, conditions in the housing market had remained weak. Housing prices had fallen further in
the capital cities and regional areas. Over the preceding six months, the falls had been largest in
Sydney and Melbourne, but prices in these cities had remained more than 40 per cent higher
than in 2012. Falls in housing prices had resulted in some borrowers having negative equity, where the
value of their loans exceeded that of their properties. Nationally, just over 2 per cent of
borrowers, accounting for less than 3 per cent of housing debt, were estimated to have
negative equity. Around 90 per cent of these borrowers were in Queensland, Western Australia
and the Northern Territory. Members observed that negative equity by itself was not a concern for
financial stability. However, if unemployment were to rise and borrowers were not able to continue to
make repayments, then financial institutions would incur increased losses. Members noted that the
decline in high loan-to-valuation ratio (LVR) lending in recent years was expected to lessen any losses
for lenders. In recent quarters, almost all loans to investors had LVRs less than 90 per cent.
By contrast, a decade earlier only 85 per cent of loans to investors had LVRs less than
90 per cent. The share of owner-occupiers with high LVR loans had also declined.
Members noted that total household payments on housing debt as a share of income had been broadly
stable in recent years. Within the total, however, an increase in scheduled principal repayments had
roughly offset a fall in unscheduled principal repayments. Members noted that households’ excess
payments amounted to about two-and-a-half years’ worth of scheduled repayments on average.
Housing loan interest payments had increased slightly as housing debt had increased.
Banks’ assets had continued to perform well overall. Although banks’ non-performing
housing loans had increased, they remained low at less than 1 per cent of their total housing
lending. Members noted that the increase in housing loan arrears had been driven by loans remaining in
arrears for longer, on average. Banks’ business loans had been performing well, with
non-performing loan rates around their lowest levels in a decade. Banks had continued to accumulate
capital, with the capital ratios of the four major banks all exceeding or close to the
‘unquestionably strong’ benchmarks set out by the Australian Prudential Regulation
Authority (APRA).
The tightening in banks’ housing lending practices over recent years had been accompanied by an
increase in lending by non-banks, although this was still estimated to account for less than
5 per cent of total housing credit. Members noted that, while not subject to prudential
regulation by APRA, non-banks’ housing lending is subject to responsible lending obligations. The
available evidence suggested that the riskiness of non-bank housing lending had not increased.
Members noted that the International Monetary Fund’s Financial Sector Assessment Program report
on the Australian financial system was generally positive about the resilience of domestic financial
institutions and the quality of regulatory and supervisory oversight, but made several high-level
recommendations for improving current arrangements.
Considerations for Monetary Policy
In considering the stance of monetary policy, members observed that growth in the global economy had
slowed over the second half of 2018 and into 2019. Trade tensions and political developments in Europe
remained sources of uncertainty. At the same time, though, global financial conditions had eased in
preceding months and, in China, the authorities had provided targeted stimulus to support domestic
growth. In a number of economies, continued strength in labour market data and moderating GDP growth
were sending different signals about the momentum in economic activity. Members noted that this was also
the case in Australia. While the labour market had continued to improve in early 2019, GDP growth had
slowed over 2018. Continued low growth in household disposable income and the adjustment in housing
markets had weighed on household spending.
Members noted that the sustained low level of interest rates over recent years had been supporting
economic activity and had contributed to progress in reducing the unemployment rate and returning
inflation towards the midpoint of the target, albeit only gradually. The central scenario was for
further gradual progress to be made on both unemployment and inflation. Members observed that a pick-up
in growth in household disposable income was an important element of these forecasts. Given this outlook
for further progress towards the Bank’s goals, members agreed that there was not a strong case
for a near-term adjustment in monetary policy. Members recognised that it was not possible to fine-tune
outcomes and that holding monetary policy steady would enable the Bank to be a source of stability and
confidence.
Members agreed that inflation was likely to remain low for some time. Wages growth had remained low,
there continued to be strong competition in the retail sector and governments had been working to ease
cost of living pressures, including through their influence on administered prices. In these
circumstances, members agreed that the likelihood of a scenario where the cash rate would need to be
increased in the near term was low.
Members also discussed the scenario where inflation did not move any higher and unemployment trended
up, noting that a decrease in the cash rate would likely be appropriate in these circumstances. They
recognised that the effect on the economy of lower interest rates could be expected to be smaller than
in the past, given the high level of household debt and the adjustment that was occurring in housing
markets. Nevertheless, a lower level of interest rates could still be expected to support the economy
through a depreciation of the exchange rate and by reducing required interest payments on borrowing,
freeing up cash for other expenditure.
Taking account of the further progress expected towards the Bank’s goals, members assessed that
it was appropriate to hold the cash rate steady. Looking forward, the Board will continue to monitor
developments, including how the current tensions between the domestic GDP and labour market data evolve,
and set monetary policy to support sustainable growth in the economy and achieve the inflation target
over time.
The Decision
The Board decided to leave the cash rate unchanged at 1.5 per cent.
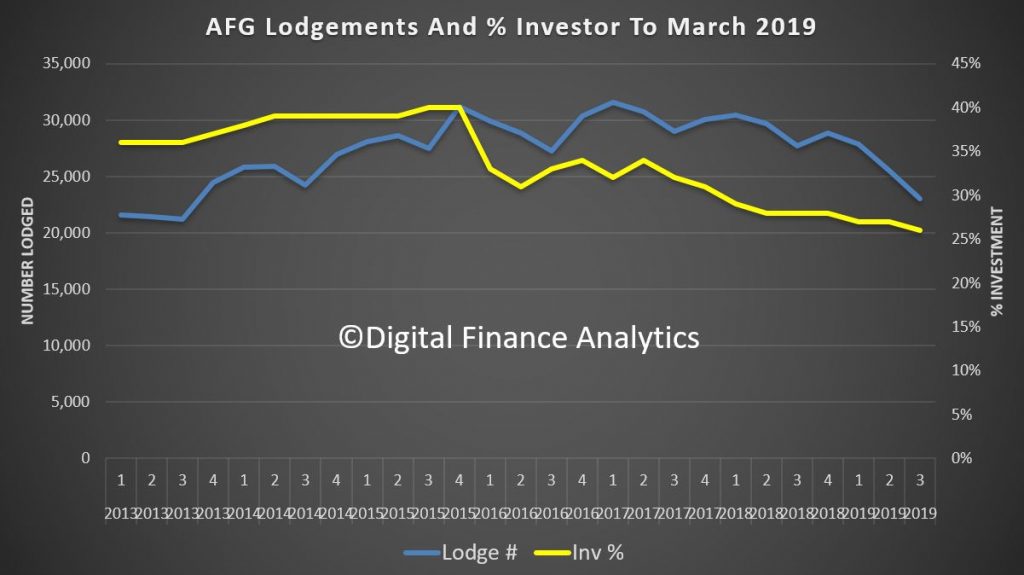
AFG provides fresh evidence of the fragile state of Australia’s home loan market emerged today, with new figures revealing national lending activity has slumped to the lowest levels in five years.
Whilst its myopic in one sense as it tracks business via AFG, it does provide further evidence of the slowing pace.
The AFG Mortgage Index and Competition Index released today showed
lending volumes across Australia in the first three months of 2019
dropped 10 per cent on the previous quarter. Volumes in the March
quarter were 15 per cent lower than the same period last year.
The 23,049 loans lodged during the quarter represented the lowest
number in six years, while the $11.6 billion volume was the lowest
quarterly figure since 2014.
AFG Chief Executive Officer David Bailey said “Today’s numbers
provide stark evidence that the lending environment has significantly
deteriorated. It’s a wake-up call for policymakers. The softening of the
residential market across the country is a real concern, with Sydney
and Melbourne driving the downturn and some states enduring a prolonged
period of falling activity.
“Despite moves by regulators to encourage activity, investment
lending remains at an all-time low of 26 per cent amid the well-
documented concerns around property values, particularly on the eastern
seaboard.
“Today’s data confirms we have reached a critical time in the housing
market cycle and we would urge policy makers to tread carefully in any
regulatory responses flowing from the Royal Commission. This is a time
for considered policy formulation that considers the full potential
impact on the lending market. It is clear, the broader implications for
the Australian economy are huge if we get it wrong.
“The volume of loans written in WA for the quarter of just over $1.3
billion represents the lowest volume seen in WA since the inception of
the AFG Mortgage Index. Whilst there has been some talk of WA moving
into a brighter resources-led period of sunshine, it is clear the local
economy needs broader stimulus.”
The tight lending market and falling house prices have contributed to
a decline in NSW volumes of almost 20 per cent on the same quarter in
2018. Victoria is down 16 per cent over the same period.
All other states are also much lower than the same time last year.
The only lift in volume over the quarter was seen in the Northern
Territory, with an increase in the average loan size and a decrease in
Loan to Value Ratios.
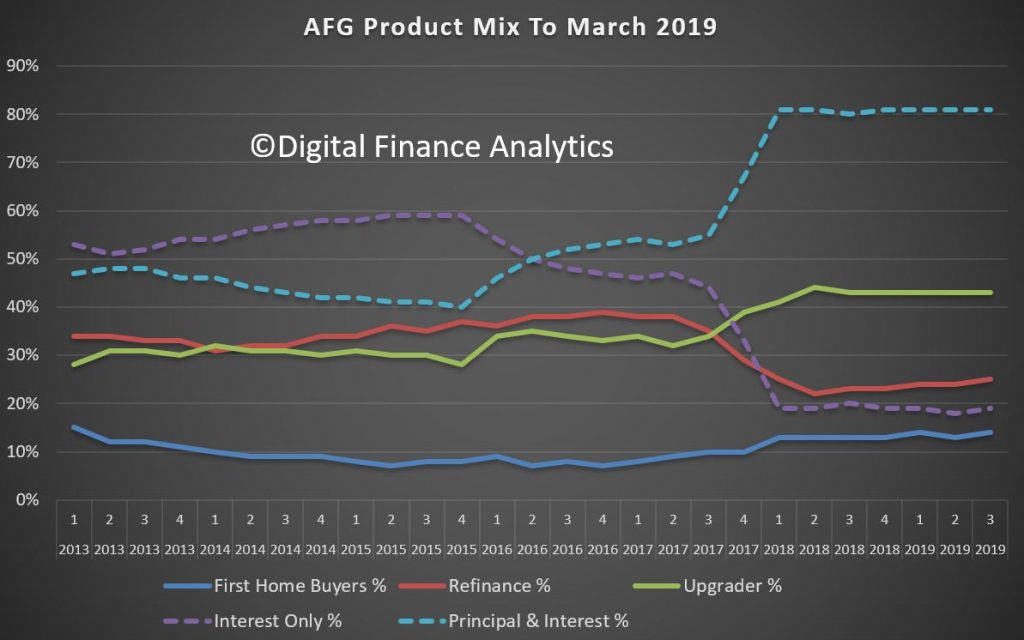
Following the relaxation of APRA-imposed caps on Interest Only (IO)
lending, AFG noted a small lift in IO lending driven by the major
lenders.
Four years ago, fuelled largely by strong investor demand, Interest
Only loans accounted for around 60 per cent of all loans written. Now,
with investor loans accounting for a quarter of new business, Interest
Only loans account for just 19 per cent of lodgements.
The breakdown of mortgages between major lenders – the ‘big four’
banks and their affiliated brands – and non-majors highlights the
crucial role mortgage brokers play in delivering competition to the home
loan sector.
The AFG Index showed the market share of non-majors has now been
locked in above 40 per cent for more than a year despite a marginal
increase for the majors to 58.6 per cent of total lodgements.
Mr Bailey said “The value mortgage brokers deliver by facilitating a
competitive lending environment is most starkly shown by the ongoing
decline in the market share of the major banks, which peaked in Q3 of
2013 at 78.2 per cent. Outside of the mortgage broking channel, the
majors have control and dominate the market. The distribution capability
provided by mortgage brokers enables the country’s non-major lenders to
compete.
“With the sole exception of First Home Buyers, who remain the last
bastion of major bank lending, the growth in non-major lending has been
broadly uniform across all other customer types.”
Major lenders are ahead on fixed-rate loans, with a steady increase
across the quarter, leaving four out of five homebuyers that chose the
certainty of fixing their interest rates doing so with a major lender.
Examination of the overall volumes going to the major bank reveals
the big losers over the past six months have been ANZ and NAB. NAB’s
share has halved over the past six months to now be as low as five per
cent.
The Westpac stable of brands emerged as big winners, as has Bankwest –
whose renewed focus on broker and customer service has paid strong
dividends in Western Australia. Bankwest accounts for more than one in
every five WA originations. Together with CBA, Bankwest has a
stranglehold on more than 35 per cent of all loans written in the State.
The Australian Prudential Regulation Authority (APRA) has released details on the future role and use of enforcement activities in achieving its prudential objectives.
Guiding principals include “risk-based”, “forward-looking”, “outcomes-based” and deterrence impact. Of course the question is, will it really make any difference? Here is the release.
APRA’s new Enforcement Approach, published today, sets out how APRA will approach the use of its enforcement powers to prevent and address serious prudential risks, and to hold entities and individuals to account.
The new Enforcement Approach is founded on the results of its Enforcement Review, which has also been published today. The Review, conducted by APRA Deputy Chair John Lonsdale, made seven recommendations designed to help APRA better leverage its enforcement powers to achieve sound prudential outcomes.
The APRA Members formally commissioned the Enforcement Review last November in response to a range of developments, including the creation of the Banking Executive Accountability Regime, the Prudential Inquiry into Commonwealth Bank of Australia, evidence presented to the Royal Commission into Misconduct in the Banking, Superannuation and Financial Services Industry, and proposals to give APRA expanded enforcement powers, particularly in superannuation. Mr Lonsdale led the Review, supported by a secretariat within APRA. Mr Lonsdale also utilised an Independent Advisory Panel comprising Dr Robert Austin, ACCC Commissioner Sarah Court and Professor Dimity Kingsford Smith to provide external perspectives and advice.
While APRA’s appetite for taking enforcement action is closely linked to a number of other components of its supervisory approach, the Review was focused on enforcement activity and not APRA’s wider operations
APRA Chair Wayne Byres
said APRA would implement all the recommendations, including:
adopting a “constructively tough” appetite to enforcement and setting it out in a board-endorsed enforcement strategy document;
ensuring APRA supervisors are supported and empowered to hold institutions and individuals to account, and strengthening governance of enforcement-related decisions;
combining APRA’s enforcement, investigation and legal experts in one strengthened support team, and ensuring resources are available to support the pursuit of enforcement action where appropriate; and
strengthening cooperation on enforcement matters with the Australian Securities and Investments Commission (ASIC).
Mr Lonsdale said the Review found APRA had, on the whole, performed well in its primary role of protecting the soundness and stability of institutions. But he said APRA could achieve better outcomes in the future by taking stronger action earlier where entities were not cooperative or open, and by being more willing to set public examples.
“APRA’s strong focus on financial risk has ensured the ongoing stability of Australia’s financial system, even during periods of financial and market stress, and protected the interests of bank depositors, insurance policyholders and superannuation members. But to remain effective, we must continue to evolve and improve, especially in response to the ways in which non-financial risks, such as culture, can impact on prudential outcomes.
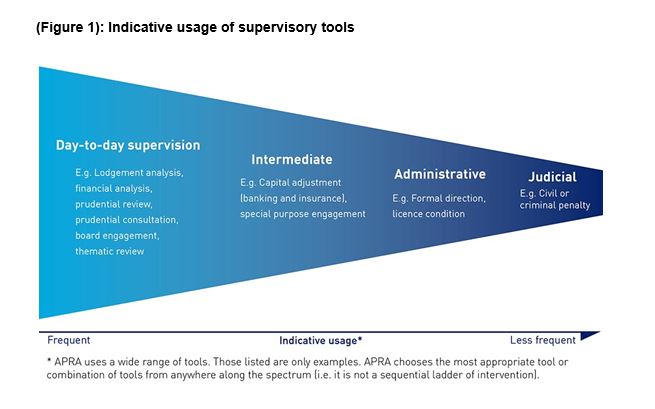
“The recommendations of the Review will still mean that APRA as a safety regulator remains focused on preventing harm with the use of non-formal supervisory tools. However, APRA will be more willing to use the full range of its formal powers – such as direction powers and licence conditions – to achieve prudential outcomes and deter unacceptable practices,” Mr Lonsdale said.
Mr Byres thanked Mr Lonsdale and the APRA Review team for delivering a valuable piece of work that would sharpen APRA’s ability to hold entities and their leaders to account. He said enforcement activity is not intended to be a separate or stand-alone function, but rather a set of tools that APRA supervisors would use more actively, particularly in the case of uncooperative institutions. (See Figure 1)
“Having joined APRA only last October, John brought a fresh set of eyes to the task of examining APRA’s historical approach to enforcement. The Review acknowledges that as a supervision-led prudential regulator, APRA’s primary focus will always be on resolving issues before they cause problems for depositors, insurance policyholders and superannuation members, rather than relying on backward-looking actions after harm has occurred. In most cases, we will continue to achieve this through non-formal tools.
“However, formal enforcement is an important weapon in our armoury when non-formal approaches are not delivering prudential outcomes. Particularly as our powers have recently been strengthened in a number of areas, the new Enforcement Approach will ensure we make use of those powers as the Parliament intended. That means that in future, APRA will be less patient with the time taken by uncooperative entities to remediate issues, more forceful in expressing specific expectations, and prepared to set examples using public enforcement to achieve general deterrence.
“With the release of APRA’s revised Enforcement Approach today, the new enforcement appetite comes into effect immediately,” Mr Byres said.
Mr Byres indicated support for the recommendations on legislative change, and that these would be referred to the Government for its consideration. He also welcomed the recent passage of the Treasury Laws Amendment (Improving Accountability and Member Outcomes in Superannuation Measures No 1) Bill 2019 as a useful complement to APRA’s renewed enforcement appetite.
The Panel, led by Graeme Samuel, currently undertaking a Capability Review of APRA will take into account APRA’s new Enforcement Approach in its work.
Following an ASIC investigation, Citigroup will refund over $3 million to 114 retail customers for losses arising out of structured product investments offered by Citigroup between 2013 and 2017. Citigroup will also write to over 1000 customers remaining in the products to provide them an opportunity to exit early without cost.
ASIC investigated Citigroup’s sale and provision of general advice to
customers for fixed coupon structured products, which are complex,
capital at risk products tied to the performance of reference shares.
ASIC was concerned that while Citigroup considered its financial
advisers to be providing general advice, elements of its practice may
have led some customers to believe that Citigroup was providing personal
advice.
Citigroup’s practices included its advisers asking customers about
their personal circumstances, such as their tolerance for risk, and
providing financial education about benefits and risks to customers who
had no previous experience of investing in structured products.
Financial advisers have higher obligations and disclosure requirements
when providing personal advice.
From 1 January 2018, as a result of ASIC’s investigation, Citigroup
ceased selling structured products to retails clients under a general
advice model.
Citigroup will shortly start contacting affected customers. The
remediation will be completed by 10 September 2019, will be
independently assured and Citigroup will report to ASIC once the process
is complete.