
The newly released Australian Institute of Health and Welfare report “Australia’s Welfare 2017“, is a distillation of data from various public sources, rather than offering new research.
However, the section on housing, reinforces the trends we have been highlighting in our recent posts.
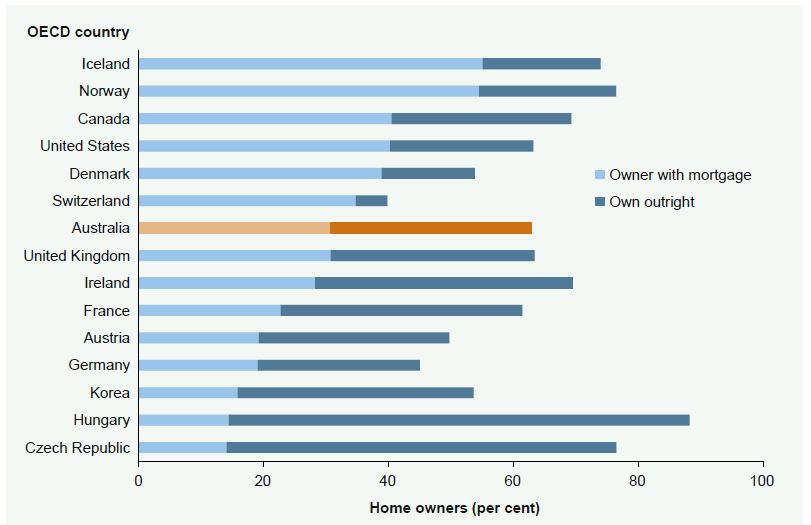
Home ownership is still the most common tenure type in Australia, as it is in many other OECD countries. However, home ownership rates have tended to increase in many OECD countries over recent decades, unlike the Australian experience. Contributing to this trend overseas, at least in part, are changes in the characteristics of households (including population ageing, household structure, and income and education) and policy influences, such as mortgage market innovations (including the relaxation of deposit constraints, increasing home ownership rates among lower income households, and tax reliefs on mortgage debt financing).
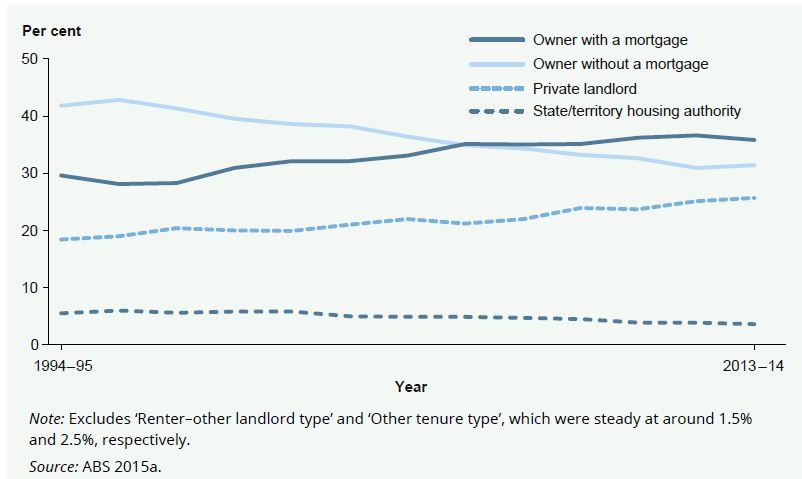
Over the past 20 years, there has also been a major shift in home ownership trends across Australia. Nationally, the proportion of home owners without a mortgage has continued to fall, while the proportion of renters has increased.
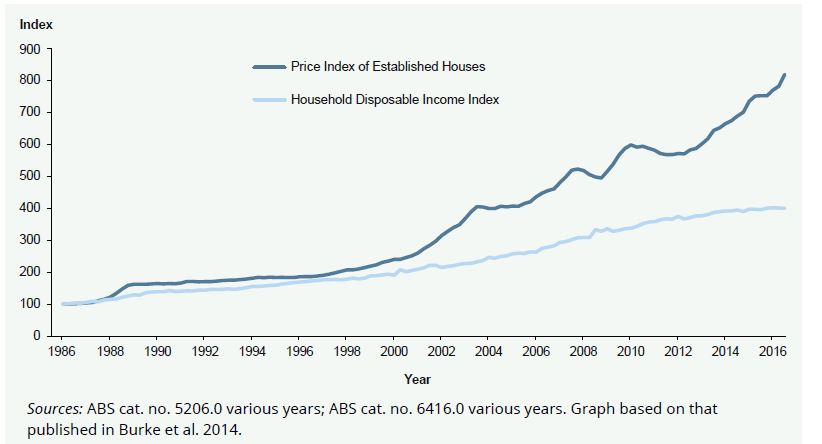
The gap between household income and dwelling prices in Australia has widened over the past 3 decades, creating a barrier to home ownership for many. This gap has been fuelled by rapid house price growth, after the financial system was deregulated, with the total value of Australian housing estimated to be $6.5 trillion.
House prices in Australia have increased substantially in recent decades. The OECD noted in its biennial survey that they have reached unprecedented highs in Australia, increasing by 250% in real terms since the 1990s. The impact of higher house prices has been partially offset by lower mortgage interest rates, increased credit availability and changes in financial agency practices. These favourable lending conditions and low interest rates have encouraged buyers into the market, despite the growth in house prices themselves.
Research shows that Australia is experiencing generational change when it comes to home ownership, with younger households being principally affected by factors such as economic constraints, lifestyle choices and work–home preferences.
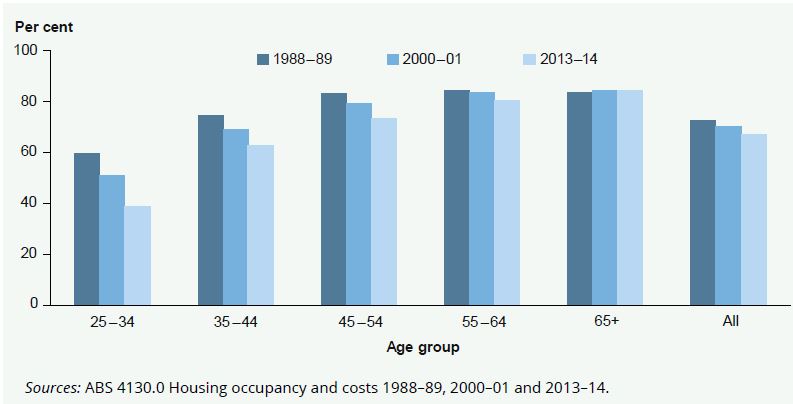
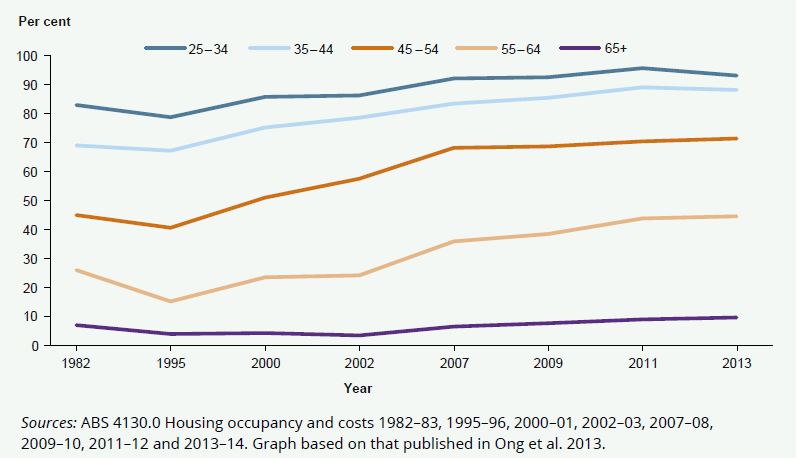
The steepest decline in home ownership rates across the 25 years to 2013–14 has been for people aged 25–34. This is typically the age at which first transitions into home ownership are made. But, fewer and fewer people in this age group are entering home ownership, with a 21 percentage point decline to just 39% in 2013–14 (compared with 60% in 1988–89). Home ownership rates for people aged 35–44 also fell, but not so much (12 percentage points). People aged over 65 (the age of retirement) were the only age group to increase their rate of home ownership and, even then, the increase was marginal.
Census data from 2016 became available just prior to the release of this publication and confirm this trend of diminishing home ownership rates among younger Australians. From 2006 to 2016 Census data reveal the greatest declines in home ownership have been in the 25–34 and 35–44 year age groups (from 51% down to 45% and from 68% to 62%, respectively).
In 2013, 71% of people born between 1957 and 1966 (mainly baby boomers), were financing a mortgage when aged 45–54. This trend is of particular concern as these households approach retirement without their home and asset base being paid off. For people looking to retire in the next 10 years, 45% of 55–64-year-olds in 2013 were still servicing a mortgage, compared with just 26% in 1982.
One thought on “More On The Reduction In Home Ownership In Five Charts”