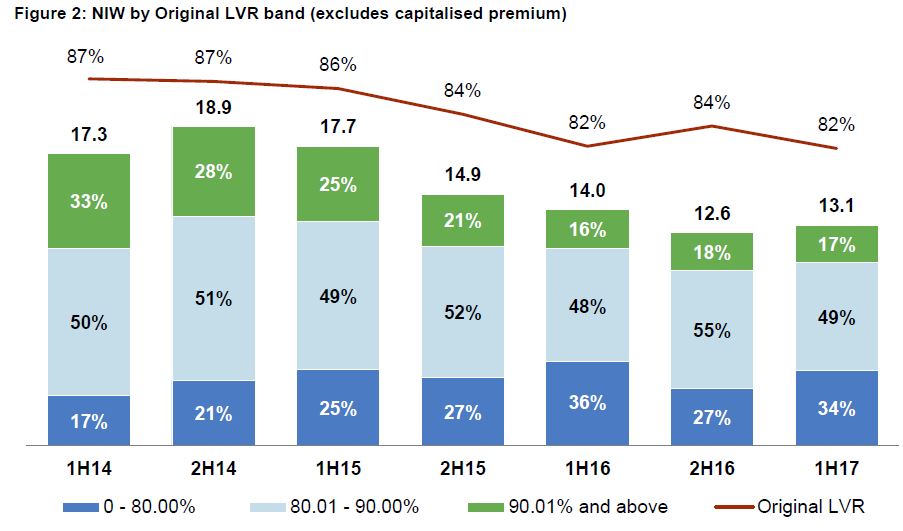
Genworth, the listed Lenders Mortgage Insurer (LMI) released their 1H17 results today, and as a bellwether for the mortgage industry, they make interesting reading. We see continued pressure on mortgage defaults in WA (0.86%) and QLD (0.72%), and a fall in higher LVR lending leading to lower volumes of new premiums being written, but at higher prices. The average original LVR of new flow business written in 1H17 was 82%.
 They reported a statutory net profit after tax (NPAT) of $88.7 million for 1H17. After adjusting for the after-tax mark-to-market move in the investment portfolio of $24.8 million, underlying NPAT was $113.5 million. Compared with IH16, net written premiums were down 7.5%, reported NPAT was down 34.7%, the loss ratio was up 1.8% and the delinquency rate was up 8 basis points. The ROE was down 3.4%. They also suffered a decline in investment returns, from 3.53% (IH16) to 2.88% this time.
Net claims incurred decreased 2.4% which included the $8.2 million favourable impact of a periodic review of its non-reinsurance recoveries on paid claims. This benefit was partially offset by an increase in delinquencies from Queensland and Western Australia, particularly in regions exposed to the slowdown in the resources sector.
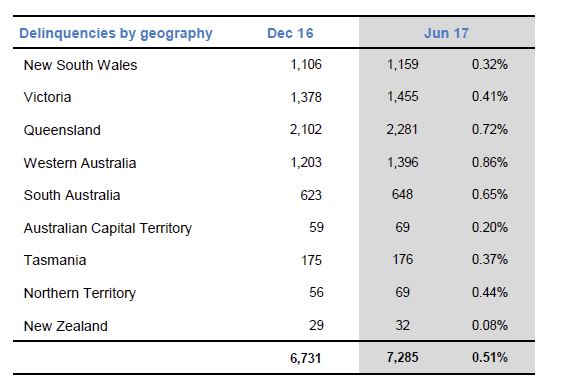 5,997 new delinquencies were added in 1H17 with a total of 7,285 on book, reflecting a delinquency rate of 0.51%, up from 0.46% in 2H16. Cures were higher, reflecting ongoing borrower sales activity.
Genworth has commercial relationships with over 100 lender customers across Australia and has Supply and Service Contracts with 8 of its key customers. The top three customers accounted for approximately 66 % of Genworth’s total New Insurance Written (NIW) and 71 % of GWP in 1H17. The largest customer accounted for 37 % of total NIW and 51 % of GWP in 1H17. The Group estimates that it had approximately 30 % of the Australian LMI market by NIW for the six months ended 30 June 2017.
On 10 March 2017, Genworth announced that the exclusivity agreement for the provision of LMI with its second largest customer was terminated in April 2017. The LMI business underwritten under this contract represented 14% of Gross Written Premium (GWP) in 2016. The Company has been successful in entering into new business with that customer that assists them in managing mortgage default risk through alternative insurance arrangements.
Genworth also previously advised that its customer, the National Australia Bank, has issued a Request For Proposal relating to its LMI requirements. The Company has submitted its proposal and will provide updates as to the outcome of its proposal.
Genworth continues to pursue other profitable opportunities in the market that meet its risk appetite and return on equity profile.
They showed their delinquency by year of acquisition.
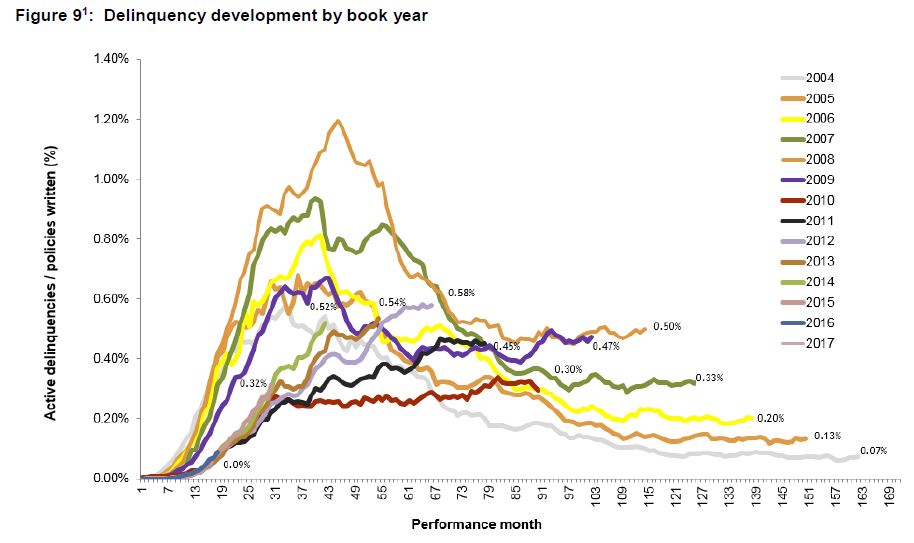 Each line illustrates the level of 3 month+ delinquencies relative to the number of months an LMI policy has been in-force for policies issued within a specific year.
2008 Book Year was affected by the economic downturn in Australia and heightened stress experienced among self-employed borrowers, particularly in Queensland, which was exacerbated by the floods in 2011.
Post-GFC book years seasoning at lower levels as a result of credit tightening, however ongoing deterioration for 2012-14 books have been predominantly driven by resource reliant states of QLD and WA that are continuing to face challenges following the mining sector downturn.
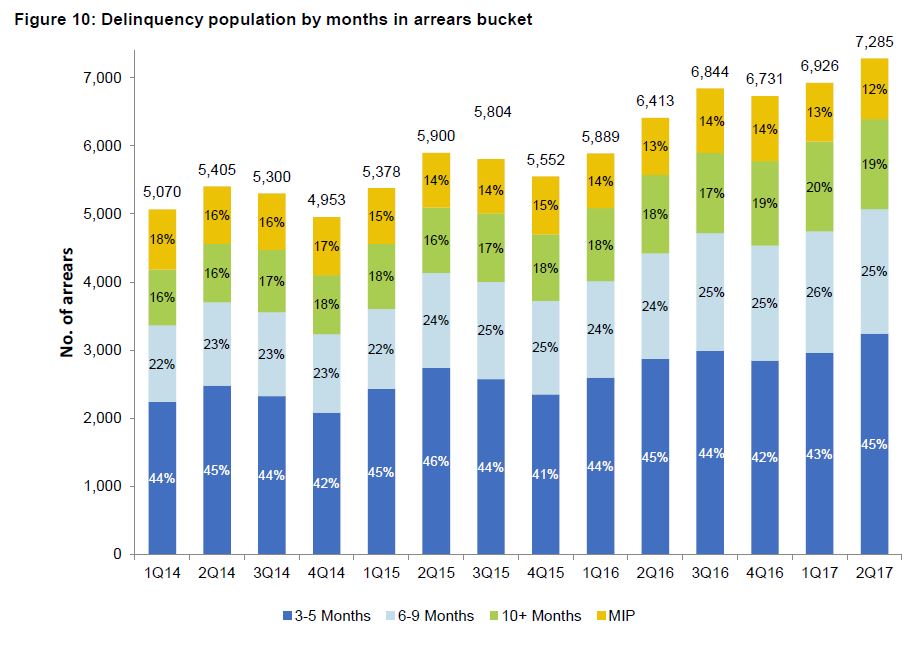 The above chart illustrates the delinquency population by months in arrears (MIA) aged bucket at the end of each reporting period. Over the past two years, the mortgagee in possession (MIP) percentage as a proportion of the total delinquency population has been trending down.
This reflects strong housing market conditions and the low interest rate environment in which a MIP generally progresses faster to a claim, or sold with no claim, which in turn leads to a relatively lower claims pipeline.
The 3-5 months MIA bucket shows a seasonal uptick in the second quarter of each year, consistent with historical observed experience.
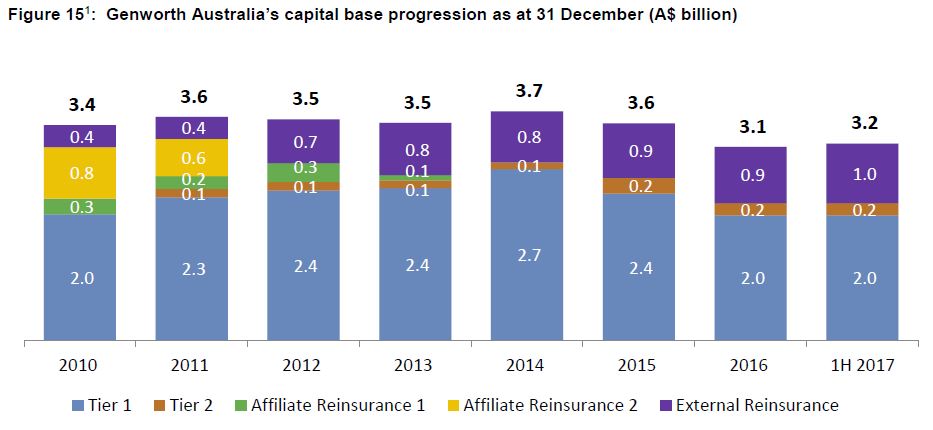
The CET1 capital did not materially change in 1H17 reflecting the $88.7 million Reported NPAT being offset by the $71.3m dividends paid and a $17.0 million decrease in the excess technical provisions. The PCA coverage ratio increased from 1.57x to 1.81x, mainly through a $135.8 million reduction in the PML and a $50 million increase in Allowable Reinsurance.
 The Board declared a fully franked interim ordinary dividend of 12.0 cents per share and a fully franked special dividend of 2.0 cents per share both payable on payable on 30 August 2017 to shareholders registered on 16 August 2017.
