
The ABS data today shows further substantial growth in managed funds. At 31 March 2015, the managed funds industry had $2,618.7b funds under management, an increase of $114.2b (5%) on the December quarter 2014 figure of $2,504.5b.
The main valuation effects that occurred during the March quarter 2015 were as follows: the S&P/ASX 200 increased 8.9%; the price of foreign shares, as represented by the MSCI World Index excluding Australia, increased 1.8%; and the A$ depreciated 6.9% against the US$.
At 31 March 2015, the consolidated assets of managed funds institutions were $2,073.0b, an increase of $100.3b (5%) on the December quarter 2014 figure of $1,972.7b.
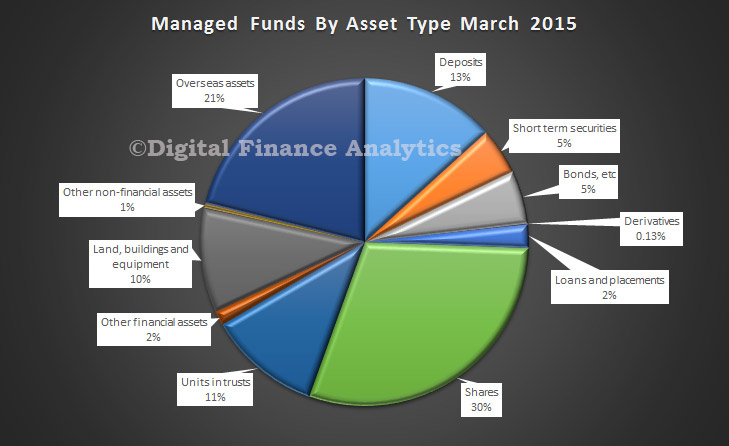
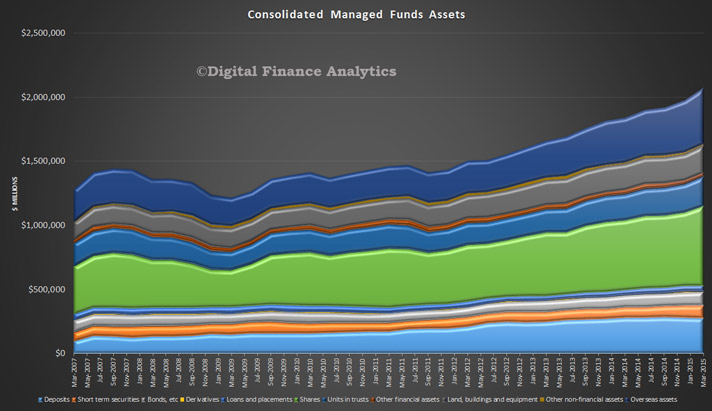 The asset types that increased were shares, $45.8b (8%); overseas assets, $34.2b (8%); units in trusts, $10.8b (5%); other financial assets, $3.4b (13%); short term securities, $3.3b (4%); bonds, etc., $2.9b (3%); land, buildings and equipment, $2.7b (1%); loans and placements, $0.9b (2%); and derivatives, $0.7b (34%). These were partially offset by decreases in deposits, $4.3b (2%); and other non-financial assets, $0.1b (1%). The chart below shows the unconsolidated mix at end March 2015.
 At 31 March 2015, there were $536.7b of assets cross invested between managed funds institutions. At 31 March 2015, the unconsolidated assets of superannuation (pension) funds increased $106.2b (6%), life insurance corporations increased $14.3b (5%), public offer (retail) unit trusts increased $8.9b (3%), cash management trusts increased $1.4b (6%), friendly societies increased $0.2b (2%), and common funds increased $0.1b (1%).