
The ABS published their data on living costs by household type today, to December 2015. It is worth reading the ABS information about these indices:
The Analytical Living Cost Indexes (ALCIs) have been compiled and published by the ABS since June 2000 and were developed in recognition of the widespread interest in the extent to which the impact of price change varies across different groups of households in the Australian population.
ALCIs are prepared for four types of Australian households:
- employee households (i.e. those households whose principal source of income is from wages and salaries);
- age pensioner households (i.e. those households whose principal source of income is the age pension or veterans affairs pension);
- other government transfer recipient households (i.e. those households whose principal source of income is a government pension or benefit other than the age pension or veterans affairs pension); and
- self-funded retiree households (i.e. those households whose principal source of income is superannuation or property income and where the Household Expenditure Survey (HES) defined reference person is ‘retired’ (not in the labour force and over 55 years of age)).
A living cost index reflects changes over time in the purchasing power of the after-tax incomes of households. It measures the impact of changes in prices on the out-of-pocket expenses incurred by households to gain access to a fixed basket of consumer goods and services. The Australian Consumer Price Index (CPI), on the other hand, is designed to measure price inflation for the household sector as a whole and is not the conceptually ideal measure for assessing the changes in the purchasing power of the disposable incomes of households.
Looking at the data, we see that whilst the living costs have fallen through 2015, they are now on the rise, and self-funded retirees have the higher cost growth rate.
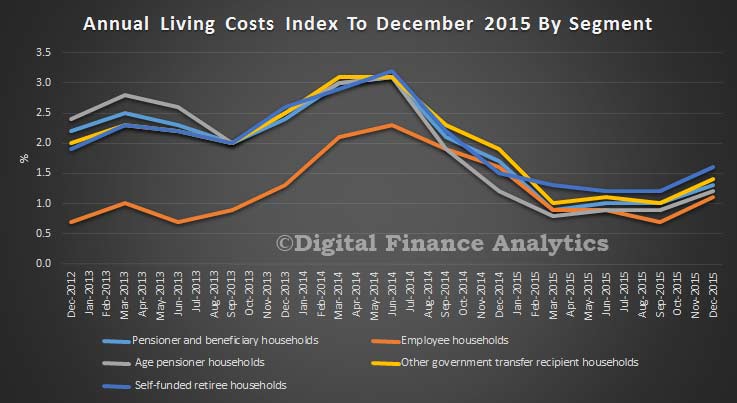
There are subtle differences in spending patterns and household mix which contribute to the differences. For example, self-funded retirees spend less on housing, but more on health care and recreation activities.
Table 1 from the ABS, illustrates significant differences in expenditures, both in total and at the individual commodity group level across the household types. Although differences in incomes are likely to be a major reason for this, other factors such as the demographic make-up of the households and dwelling tenure would also play a part. For example, age pensioner households have on average the lowest number of persons per household and self-funded retiree households have a higher than average rate of outright home ownership.
|
Table 1: Estimated average weekly expenditure during 2009-10, Household type by Commodity group(a)(b)
|
||||||
|
|
||||||
|
PBLCI
|
Employee
|
Age pensioner
|
Other government transfer recipient
|
Self-funded retiree
|
CPI
|
|
| Commodity group |
$
|
$
|
$
|
$
|
$
|
$
|
|
|
||||||
| Food and non-alcoholic beverages |
135.92
|
262.48
|
120.72
|
150.86
|
176.66
|
230.87
|
| Alcohol and tobacco |
56.19
|
114.63
|
36.12
|
75.92
|
68.16
|
96.87
|
| Clothing and footwear |
32.27
|
64.39
|
26.31
|
38.12
|
43.29
|
54.58
|
| Housing(c) |
135.91
|
205.32
|
92.43
|
178.64
|
113.89
|
305.75
|
| Furnishings, household equipment and services |
60.00
|
142.82
|
59.81
|
60.20
|
119.83
|
124.79
|
| Health |
35.91
|
80.73
|
47.69
|
24.32
|
87.22
|
72.56
|
| Transport |
63.26
|
182.25
|
50.65
|
75.65
|
118.13
|
158.39
|
| Communication |
26.26
|
46.45
|
19.80
|
32.62
|
31.84
|
41.81
|
| Recreation and culture |
67.90
|
194.82
|
61.91
|
73.79
|
215.24
|
172.30
|
| Education |
10.07
|
45.13
|
1.54
|
18.45
|
9.06
|
43.67
|
| Insurance and financial services(d) |
37.44
|
218.75
|
22.19
|
52.42
|
39.40
|
69.71
|
| All groups |
661.13
|
1 557.77
|
539.17
|
780.99
|
1 022.72
|
1 371.30
|
|
|
||||||
| (a) Based on 2009-10 Household Expenditure Survey (HES) at June quarter 2011 prices. | ||||||
| (b) Figures may not add up due to rounding. | ||||||
| (c) House purchases are included in the CPI but excluded from the population subgroup indexes. | ||||||
| (d) Includes interest charges and general insurance. Interest charges are excluded from the CPI and general insurance is calculated on a different basis. | ||||||