
The latest data from the ABS on housing finance for October 2015, continues to tell the story of the turning market, with investors slowing, and owner occupied loans still rising (and supported by growth in refinanced loans). It also contains a number of adjustments, so trends are hard to read. But, do not be deceived, the market still has significant momentum, and overall volumes and values are still high.
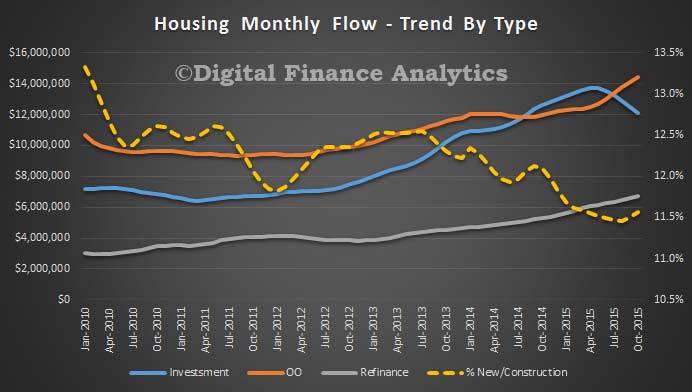
Looking at the national monthly trend flows first, we see that in October total housing loans of $33.2 bn were written, up 0.04% from the previous month, or $12.9m. Note that significant home lending is still happening, though overall growth has slowed.
Within these numbers, $14.4bn owner occupied loans were written, a rise of 2.1%, or $291m; whilst $12.1bn of investment loans were written, down 3.1% or $386m. Refinancing grew 1.7%, of $109m and equated to $6.7bn in the month. Loans for new houses or for construction of new dwellings (across investment and OO), rose 0.5% to $3.8bn.
 Taking a longer, and state based view of loans for new construction for owner occupation, there are significant variations. New home lending to owner occupiers increased by 7.8 per cent in New South Wales and was unchanged in the Norther Territory. In the other six states and territories, the number of loans to owner occupiers purchasing or constructing new homes decline in October 2015 when compared with October 2014: Tasmania (-28.6 per cent); Western Australia (-24.5 per cent); Australian Capital Territory (-20.9 per cent); Queensland (-9.2 per cent); Victoria (-6.0 per cent); and South Australia (-2.5 per cent). Construction momentum is waning.
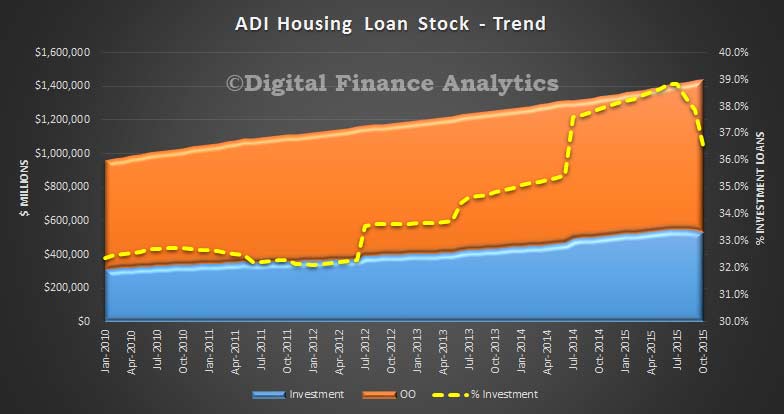
Of course, there is a whole load of noise in the data, with loan reclassifications so we need to treat the numbers with care, but the trend is clear now. These adjustments show clearly in the ADI stock trend data, which shows how the proportion of investment loans were adjusted up (thanks to the bank reclassifying loans to investment loans in the year from June 2014, and more recently households telling the banks their loans were NOT investment loans, see our earlier post on this, referring to the more reliable(?) RBA numbers. At a portfolio level, in original terms, ADI loans for all housing were up 0.53% to $1.44 trillion, of which OO contributed $911bn, up 2.6% and investment loans $526bn, down 2.9%.
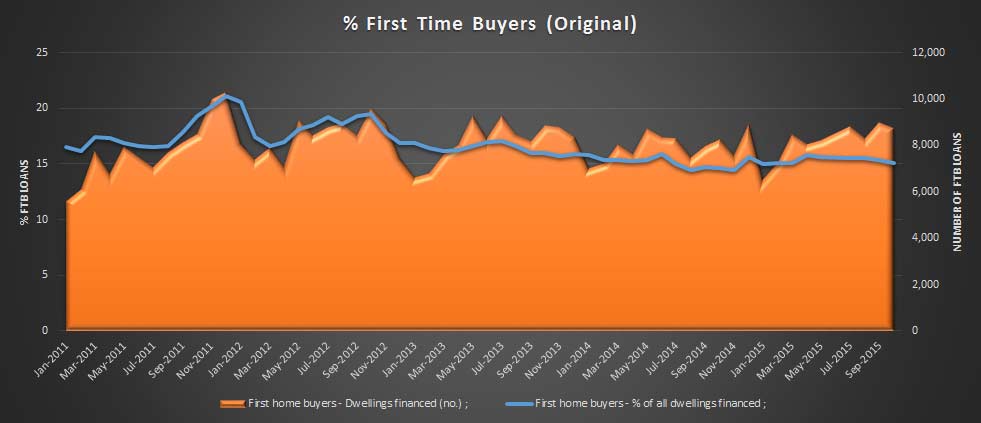
 Turning to first time buyers, owner occupied loans fell 2.85%, making 15.1% of all new loans taken by first time buyers. The average FTB loan rose again from $351,800 last month to $355,700 this month. An astonishing rise, given flat incomes.
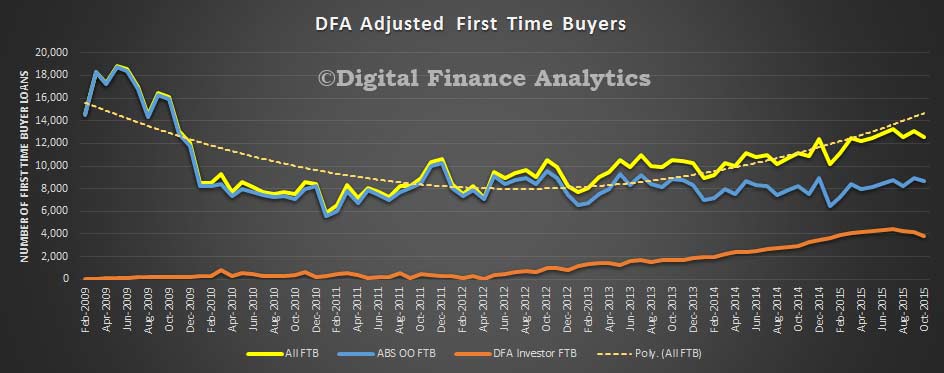
 Finally, if we add back in the hidden first time buyers who are going direct to the investment sector (using data from the DFA surveys), we see that momentum here continues to weaken, with a fall of more than 7% is loans written this month, a fall from 4,147 in September to 3,835 in October. Together first time buyer numbers fell 5.5%, from 13,100 to 12,534.
 To further muddy the waters, the ABS also made revisions:
In this issue revisions have been made to the original series as a result of improved reporting of survey and administrative data, and updated first home buyer modelled estimates. These revisions have impacted on:
- First home buyers owner occupied housing for August 2015.
- Investment housing for August 2015.
- Housing loan outstandings to households; owner-occupied and investment housing: for periods from March 2014 to September 2015.
Monthly First Home Buyer statistics will be subject to future revision, as the modelled component is adjusted to reflect improved reporting by lenders.