
Given the current Small Amount Credit Contract Laws review is in train, DFA has been looking at the data in our household surveys to try and quantify the potential size, and trends in the market – colloquially known as the payday lending sector. There is no consistent reporting of payday data, unlike other consumer finance statistics, and the industry comprises a number of commercial entities which do not fall within banking regulation or reporting. Whilst the market is small compared with the $40bn credit card industry or the $140bn total consumer credit market, there are signs of growth, especially facilitated by online origination. We won’t rehearse the definitions or pros and cons of these loans, but will present our work on estimating the size of the payday market. This may assist others interested in the sector.
By way of context, there are many and varied estimates as to the size of the market. ASIC in 2013-2014 suggested $400m, and since 2010, ASIC enforcement action has resulted in close to $2 million in refunds to more than 10,000 consumers who have been overcharged when taking out a payday loan. In 2007, an article in the BRW suggested it was $800m, a number offered recently in an article “Making hay from payday loans” by Steve Worthington Adjunct Professor at Swinburne University in 2015.
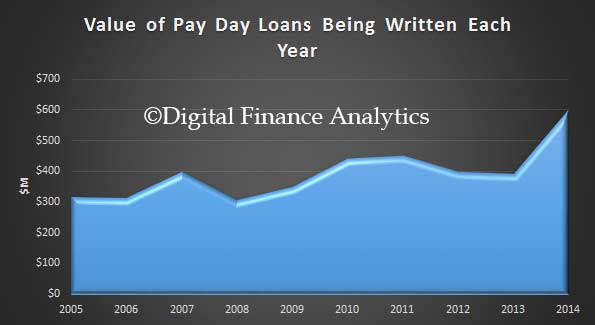
So to estimate the size, we begin with data from our ongoing household surveys. From this data we can estimate the number and duration of loans being written each year. This is our baseline data and we think about $600m of loans were written in the last full year, to December 2014, a rise from $300m in 2005.
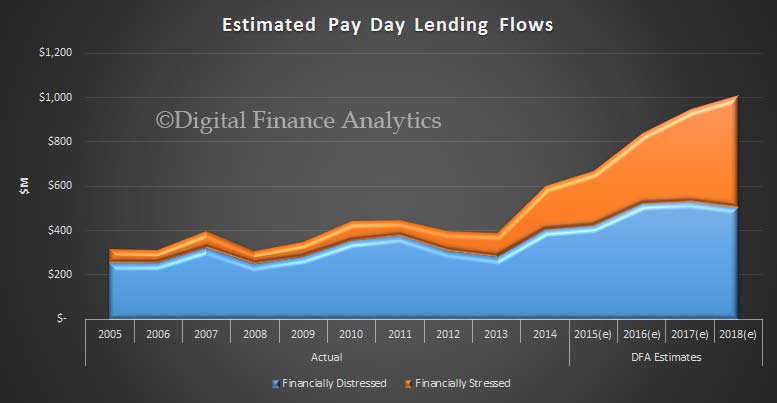
 Significantly, if we apply our segmentation analytics on this data, we discover that the type of household accessing payday loans is changing. Whilst we won’t go into detail here, we identify households which are financially stressed, and those who are distressed. The former are primarily being embarrassed by a short term cash crisis, and turn to payday on an occasional basis as a convenient fix often via an online service. Financially distressed households are those with chronic debt problems and were the core constituency of payday lenders a few year back. Of course some households who start out as stressed, slip into distress later.
We have also estimated the future value of new loans by these segments, based on a number of assumptions listed below.
 Note this is an indicative model only, and underlying assumptions and therefore outputs, may change. We model future volumetrics based on our baseline household survey data. We gross up the 26,000 per annum reference data to national level, on a statistical representative basis. We assume there will be similar utilisation and debt patterns, at a segment and state level, and overlay expected population and employment growth. We assume population and household growth will maintain current trend levels. In addition, we overlay current online segment profiles, which shapes the mix between both distressed and stressed households, and reflects the rise of online application and fulfillment for Pay Day loans. We project online take up forward, extrapolating from current trends and device usage. We assume the current mix and duration of loans, including multiple loans, continues at current rates. We assume no change in the current payday legislation, and we assume the current levels of availability of other forms of credit, and current lending rules.
We make the following specific assumptions (the DFA model can be flexed using different parameters).
- Unemployment at the national level will remain at 6.3% out to 2018 (and current state differentials continue, with rising rates in WA and SA.
- Cash interest rates will rise from 2.0% from mid 2016, to reach 3.5% by 2018
- GDP will remain at 2.5% to 2018
- Core inflation will remain at 2.5% to 2018
- Income growth, after inflation will be zero out to 2018
Estimates are rounded up. Based on past performance, we have a confidence level of +/- 1.5% out to December 2016, and +/- 3% beyond to 2018.
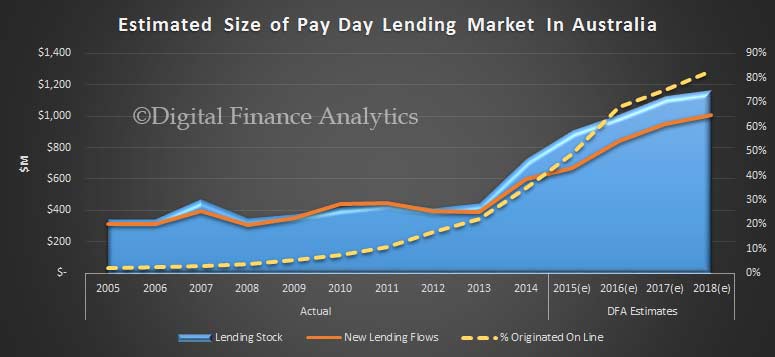
Finally though we want to estimate the total market size, so we need to take account of the total stock of loans outstanding, including those refinanced or extended, and those in default. This is significantly harder to estimate accurately. However, we have made an attempt, and we have assumed default rates will continue to run at close to 20% as indicated in our household surveys.
Thus, the baseline market estimate for the current year will be in the region of $670m, and when we include arrears, refinance and other stock adjustments it could be as high as $908m. We think the market will grow to more than $1bn with current regulatory and economic settings, thanks to the significant rise in online origination and the segment shifts. By 2018, we estimate that more than 80% of loans will be taken via online apps and web sites. The chart below summarises all these points.
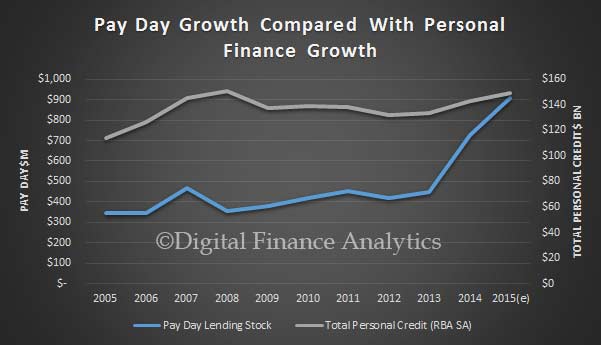
 One final perspective. If we chart the the DFA estimates for payday and the RBA Personal Finance Stock data (d02Hist) from 2005, we see that Pay Day lending growth is accelerating relative to the broader personal finance trends.
One thought on “How Big Is The Payday Lending Market In Australia?”