Excellent opinion piece (and charts) in the Guardian by Philip Soos, which nicely underscores the debt burden issue we have been highlighting.
Australia’s historically high and rising housing prices are widely debated and have prompted a number of government inquiries into housing affordability.
The question stands open: is housing affordable in Australia?
Affordability is often confused with related concepts such as ease of entry, serviceability and valuation. Ease of entry refers to the difficulty of purchase, whereas serviceability measures the burden of mortgage repayments relative to household income.
Valuation considers whether prices are efficient relative to economic fundamentals. Opinions are divided on this: housing prices could be 30% undervalued, a bubble which is 40% overvalued, or somewhere in between.
It is often claimed housing is affordable because nominal mortgage interest rates are low, having significantly declined since the peak of 17% in 1990. The standard mortgage payment formula shows nationwide debt repayments relative to household incomes are lower today than in 1990 and the smaller peak in 2008.
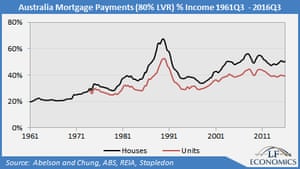
This metric is problematic because it is static, capturing the payments-to-income ratio at each particular point in time. The ratio at the peak in 1990, for instance, is very high if, and only if, prices, interest rates and incomes are constant over the life of the mortgage. This doesn’t reflect reality and a more dynamic approach is required.
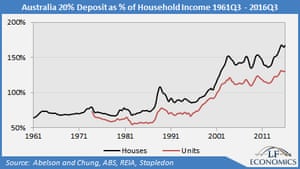
First, the deposit-to-income ratio is the highest on record. Lenders may accept smaller deposits today but this is not a genuine choice for first home buyers. Starting out with larger loan repayments and lower equity is unlikely to be compensated for in a low interest rate and anaemic wage growth environment, especially with the added cost of lenders mortgage insurance.
Second, due to larger mortgages, repayments are higher than suggested by interest rates alone. Unfortunately, principal repayments are not officially recorded in our national accounts. The Bank of International Settlements has developed internationally standardised debt service ratios (DSR) to derive estimates of aggregate principal and interest repayments to income.
Household debt and prices escalated, interest rates declined and principal payments rose over the years. The gap has widened between interest payments to income and the DSR from around 1% between the late 1970s and early 1990s to a record 6% today.
By disregarding rising principal payments, vested interests downplay the immense debt burden assumed with a typical mortgage.
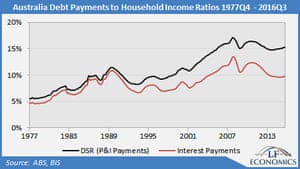
Worryingly, the bank states, “the DSR is a reliable early warning indicator for systemic banking crises. Furthermore, a high DSR has a strong negative impact on consumption and investment.” The DSR is currently 15% nationwide, far higher than the US, UK and Spain at the peaks of their housing bubbles. Estimates of the DSR for New South Wales and Victoria are 18%, which demonstrates extreme indebtedness.
Third, past research from the RBA recently surfaced in the media, examining the effects of wage inflation on mortgage payments. While high interest rates result in onerous payments relative to income, this only occurs in the early phase as high wage growth inflates away the burden. In contrast, borrowers facing high housing prices with low interest rates and poor wage growth face a greater burden across the life of the mortgage due to greater payments-to-income.
Everyone apart from the very wealthy has to purchase with a mortgage. Therefore, only by anchoring serviceability of payments-to-income can a genuine estimate of affordability be made. Generally, 30% of income is the accepted maximum.
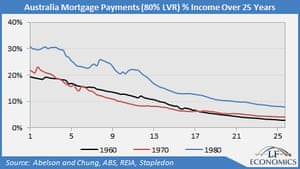
High wage growth relative to interest rates and prices during the 1960s and 1970s made housing quite affordable. Higher prices and interest rates in the 1980s increased the burden. When interest rates peaked in 1990, payments were arduous but quickly declined.
While interest rates and wage growth for the next 25 years cannot be known, they are assumed to hold still at the present rates: 5.7% for the average imputed mortgage interest rate and 1.4% for wages. While the present interest rate may seem high, lower rates will inevitably prompt further housing price growth.
Buyers from, say, 2010 face onerous payments over the life of their mortgage compared to those who purchased in 1980 and 1990 when interest rates were much higher. The average ratio across the lifetime of the mortgage for all purchases dates are 1960 (10%), 1970 (10%), 1980 (18%), 1990 (27%), 2000 (23%) and 2010 (37%).
Although not shown, affordability is even worse in 2016 due to rising prices, with an estimated average payment ratio of 42%. The payment burden for 2010 and 2016 is still extreme and higher than 1990, even when factoring in lower estimated interest rates (4%) and higher wage growth (2%).
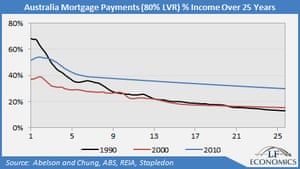
The measures presented above are absent from mainstream analysis today precisely because they demonstrate severe unaffordability, confirmed by the highest deposit-to-income ratios, the highest debt repayments relative to income over the lifetime of the mortgage and very high DSRs. Over 50% of first home buyers today are reliant on parental assistance.
There are three ways to assist affordability: declining interest rates, rising wage growth and falling housing prices. Aspiring first home buyers are severely disadvantaged; nominal wage growth is currently at the lowest level since the second world war and there is little room for interest rates to go lower. The only path to improved affordability is by reducing housing prices.
This is obviously opposed by political parties, the finance, insurance and real estate sector and economists employed by vested interests. Instead, we are bombarded with a disgraceful litany of pronouncements, fabricated to defend record high housing prices and unaffordability.
Young adults are condemned as lazy and inept, allegedly misspending their income on alcohol or stuffing themselves with smashed avocado toast in hipster cafes. To protect unjustified privilege – unearned rises in housing prices – vested interests have twisted a very real affordability crisis into moral failing by the young. They are told to get onto the housing ladder by purchasing an investment property or to “get a good job”.
The appalling government report recently published on home ownership (at which I testified) was a miserable 45 pages short and made no recommendations. The government made no pretense of objectivity; dissenting reports by the ALP and Greens were more informative.
The evidence shows housing prices and unaffordability are at record highs. This appalling state of affairs is maintained by an undemocratic politburo of vested interests accustomed to extracting a staggering proportion of unearned income and wealth. Manufacturing claims of youthful indolence is merely another day at the office.
Will anything be done to lower housing prices? On the contrary, the politburo endlessly champions higher prices by seeking further interest rate cuts, increasing our already third-world rates of population growth via immigration and could implement another inflationary first home owners boost on the pretext of assisting first home buyers – which enriches existing landholders and bankers.
The state of policymaking and economic management in Australia is extremely poor and entirely intentional. If the young are to learn an important lesson, it is this: no matter how hard things are, vested interests are committed to making their lives ever more difficult.
