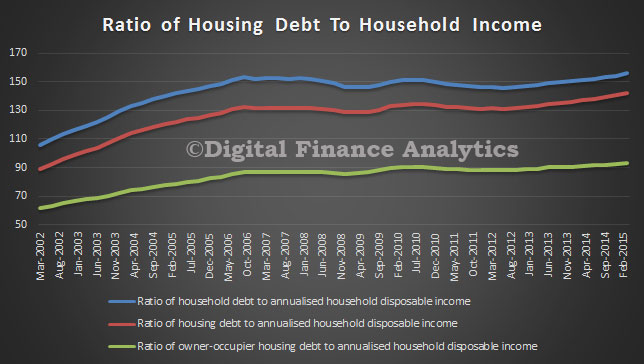
The ABS data released yesterday, highlights that overall household debt is sky high, much of it linked to mortgage borrowing. Whilst household net worth is over $8 trillion, its mainly thanks to house price inflation (and stock market holdings inflated by ultra low interest rates and QE). The RBA data tells the story. Using their data, (E2 HOUSEHOLD FINANCES – SELECTED RATIOS) we see that the ratio of housing debt to income is rising, in fact both the ratio covering owner occupied housing, and that covering both owner occupied housing and investment housing has risen significantly.
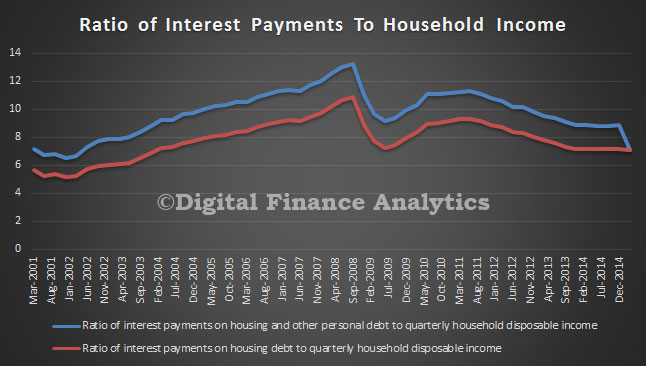
 Of course, interest rates are low, so the ratio of interest payments to income are lower than when interest rates were at their peak in 2008. So the common assumption is that whilst debt is high, households can service it, and those with higher incomes have the greatest debt exposure.
 In addition, banks are now “required” by APRA to use an interest rate of 7% when considering a loan application, higher than the common practice of a number of banks. APRA highlighted recently the range of rates banks were using for serviceability testing.

Some banks were underwriting loans with a very small serviceability buffer, so will have loans on book at greater risk, but at the moment serviceability is not required to be marked to market on an ongoing basis (though that may change under Basel IV).
This takes us to mortgage stress. Now, DFA has been tracking mortgage stress for year. Low interest rates have got many out of difficulty.
Mortgage stress is a poorly defined term. The RBA tends to equate stress with defaults (which remain at low levels on an international basis). A wider definition is 30% of income going on mortgage repayments (not consistently pre-or post tax). This stems from the guidelines of affordability some banks used in 1980’s and 1990’s, when economic conditions were different from today. This is a blunt instrument. DFA does not think there is a good indicator of mortgage stress, so we use a series of questions to diagnose mortgage stress focusing on owner occupied households. Through these questions we identify two levels of stress – Mild and Severe.
- Mild = households maintaining repayments, but by reprioritising expenditure, borrowing more on loans or cards, and refinancing
- Severe = households who are behind with their repayments, or are trying to sell, or are trying to refinance, or who are being foreclosed
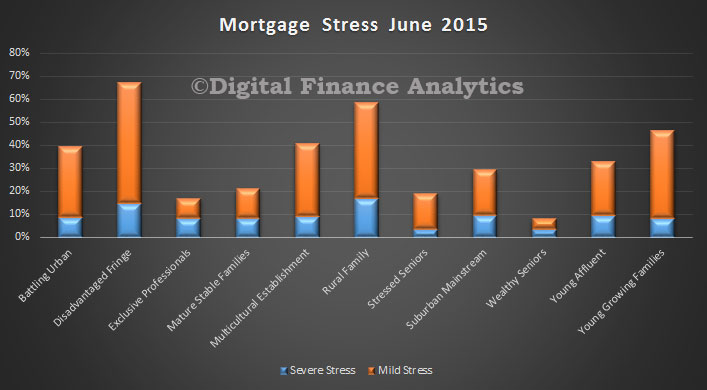
In our latest data on stress we have noted some concerning trends. Despite the ultra-low interest rates, the proportion of households in some degree of mortgage stress is rising. This is because incomes are static, household expenses are rising and the average mortgage is larger, especially in some centres like Sydney. So if we look at segmented data we see that for some borrowing households, as many as 10% are registering in the severe category, and many more in the mild category. Many are just, and only just keeping their heads above water. Larger loans means they are more leveraged.
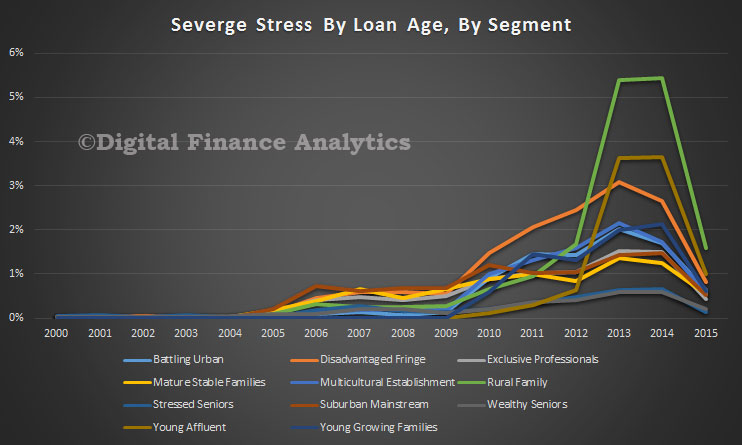
 If we look at the severe stress by segment, by when the loan was last drawn down, we see significant peaks in more recent years (when loans were larger) than older loans. Typically in in years 2 and 3 of a loans life that stress is highest.
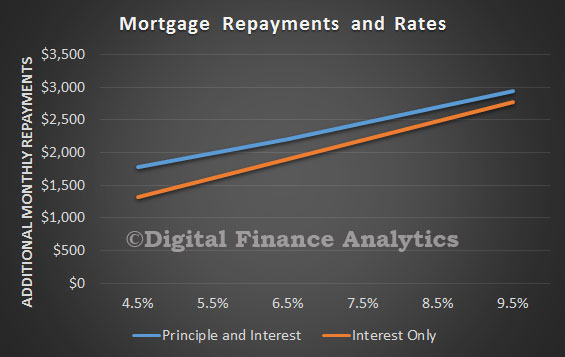
 Now consider this. Assuming an average $350,000 mortgage over 30 years, if rates were to rise 1%, the average monthly costs for a p&i loan would rise by $220 and for an interest only loan $291. Such a rise would likely lift the proportion of households with mortgage stress from 35% of all borrowing households to close to 50% in our modelling. Interest only loans are more sensitive to rises.
We conclude that many households are a hair’s breadth away from difficulty. Another way of asking a similar question is how much free cash is available at the end of the month. For many households with large mortgages and average incomes, the short answer is nothing. No flex. No safety net. Whilst in the early 2000’s incomes were rising fast there is not easy exit this time. Many households are in the debt noose. Let’s hope no-one pulls the rope.