
The ABS released the latest national accounts, to March 2015. The Household Finance and Wealth data confirms again what we know, overall household net worth is up (thanks to asset appreciation) but savings are down.
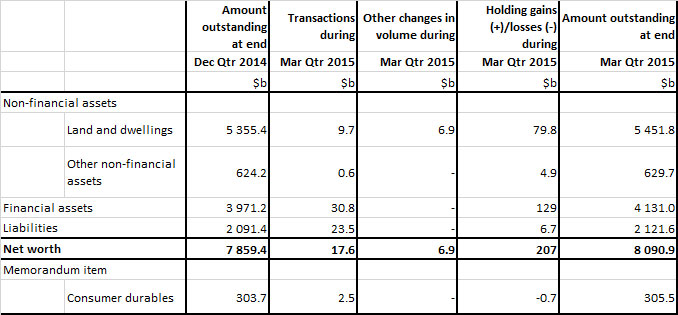
At the end of March quarter 2015, household net worth was $8,090.9b, made up predominantly of $5,451.8b of land and dwelling assets and $4,131.0b of financial assets, less $2,121.6b of household liabilities. During the quarter, household net worth increased by $231.5b, driven mainly by holding gains of $207.0b. Financial assets ($129.0b) and land and dwellings ($79.8b) were the drivers of holding gains this quarter, with financial assets seeing the largest quarterly holding gains on record. The large increase in holding gains from financial assets was driven by net equity in reserves ($90.6b) and equities ($36.2b).
The increase of $17.6b in transactions in net worth was driven by $9.7b increase in net capital formation of land and dwellings; and net financial transactions of $7.3b, of which transactions in financial assets were $30.8b and liabilities were $23.5b. The March quarter 2015 transactions in financial assets were driven by $13.8b of transactions in net equity in reserves of pension funds and $11.2b of transactions in deposits. Transactions in liabilities in March quarter 2015 were driven by transactions of $24.3b in long term loan borrowing.
 Both household assets and liabilities continued to grow over March quarter 2015, resulting in 2.9% growth in household net worth. Net worth has continued to grow over the last eight quarters, passing the $8 trillion mark in March quarter 2015.
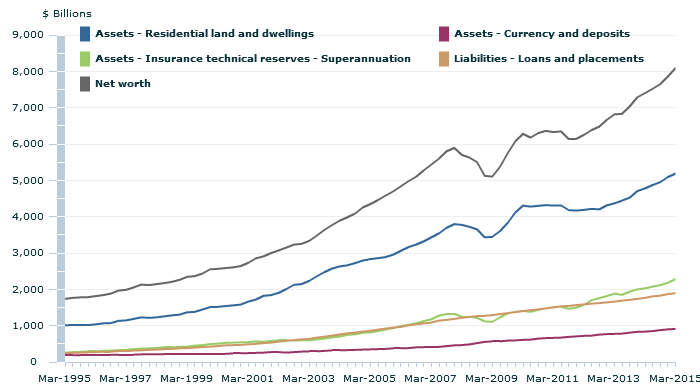
Household financial assets grew faster than both residential land and dwelling assets and liabilities, growing by 4.0% ($159.8b), 1.9% ($96.1b) and 1.4% ($30.2b) respectively. Insurance technical reserves – superannuation, and shares and other equities were the key drivers of growth in financial assets this quarter. Insurance technical reserves – superannuation grew by 4.8% ($104.9b), recording its highest quarterly percentage growth since the June quarter 2012 growth of 8.4% ($131.4b). Shares and other equity grew 5.7% ($37.1b), recording its highest quarterly percentage growth since the March quarter 2013 growth of 6.1% ($32.4b).
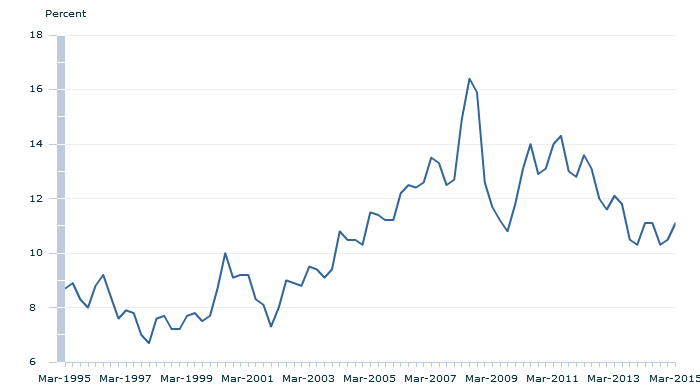
The financial ratios graphs presented here are derived from the household balance sheet, financial account and income account. The interest payable to income ratio represents the proportion of household gross disposable income that is required to meet interest payments. Interest payable in the graph is the “adjusted interest payable”. It includes the financial intermediation services indirectly measured (FISIM) on the dwelling loan plus the dwelling interest payable from the household income account. It therefore represents the total nominal amounts paid as interest by the household sector. The interest payable to income ratio is relatively volatile in the short term, however some long term trends may be observed. After a period of volatility during the Global Financial Crisis, the ratio stabilised from March 2010 onwards, settling into a gradual downward trend. The ratio at March quarter 2015 was 11.1%, an increase of 0.6p.p from the December quarter ratio of 10.5%.
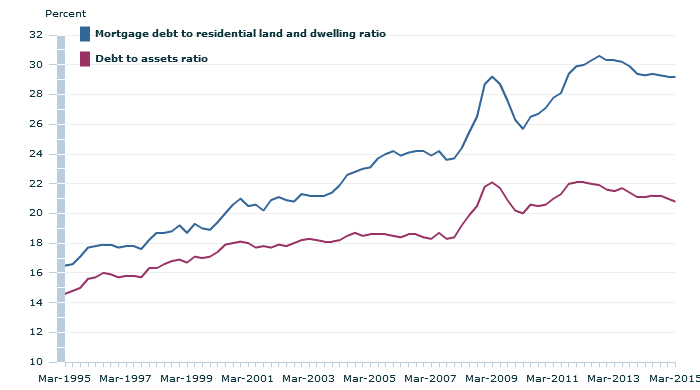
 The mortgage debt to residential land and dwellings ratio shows the extent that household residential real estate assets are geared. The ratio has declined since peaking at 30.6% in September quarter 2012, but has remained unchanged since December 2014 at 29.2%, indicating that household mortgage debt grew at the same rate as residential real estate owned by the household sector for the past two quarters.
The debt to assets ratio gives an indication of the extent that the overall household balance sheet is geared. That is the degree to which assets are dependent on debt. At 31 March 2015, household debt was equal to 20.8% of assets, dropping below 21% for the first time since December quarter 2010.
The debt to liquid assets ratio reflects the ability of the household sector to extinguish debts in a short period of time using their readily available, or liquid, assets. The following are classified as liquid assets: currency and deposits, short and long term debt securities, and equities. The ratio of household debt to liquid assets fell from 134.1% at 31 December 2014 to 131.8% per cent at 31 March 2015, the third consecutive quarter of decline and the lowest ratio since September quarter 2008.
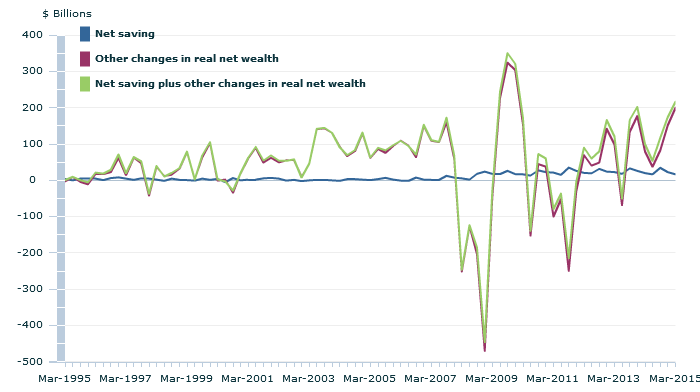
 Household net saving was $16.4b for the quarter, decreasing from $22.8b in the December quarter. Despite the decrease in net saving, household net worth increased by $231.5b to $8,090.9b in March quarter 2015. With the inclusion of real net wealth effects, net saving increased to $215.9b for the quarter. The largest driver of the increase in other changes in real net wealth was real holding gains, which made up $192.2b of the $199.6b increase. Real holding gains for financial assets was $121.4b, which overtook land and dwellings as the biggest driver of real holding gains this quarter, and is the highest recorded holding gain for financial assets in the series.
One thought on “Household Net Worth now over $8 Trillion, but Savings down”