
The ABS today released their Distribution of Household Income, Consumption and Wealth data for the years from 2003 to 2012. According to the ABS, the average gross disposable income of Australian households grew 58 per cent in the period 2003-04 to 2011-12. However, the highest income quintile grew at a rate above average, at 62 per cent. All other income quintiles grew above 50 per cent , but below the average rate of 58 per cent. We see that older Australian’s income has been growing faster than younger ones.
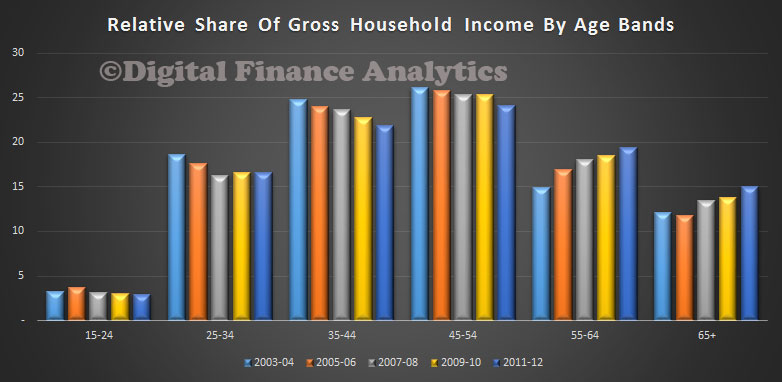
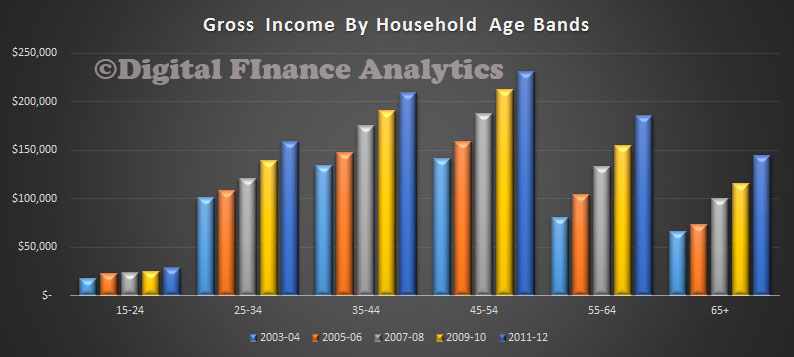 The relative share of gross income is gravitating towards older households. This is a function of the growing number of older households, thanks to the demographic shifts, and the fact they hold the lions share of investments yielding income.
 We can also look across the income quintiles (20% bands). We see stronger income growth in the higher income groups. This is stated in perecentage terms, but in doller terms the relative amounts are significant.
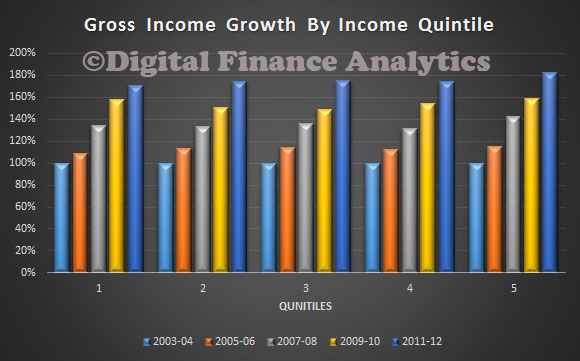 We can see that growth in incomes for the richest quintile is stronger than the lower ones.
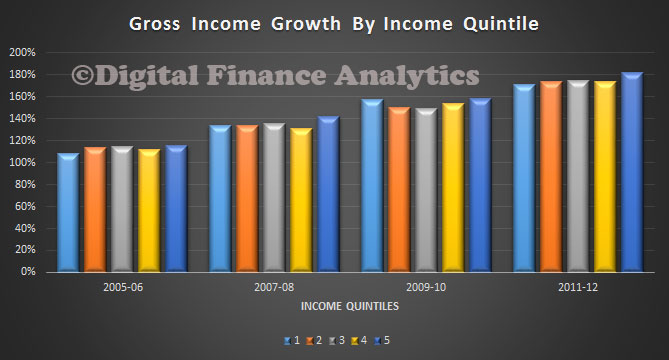 The ABS says growth in wages and salaries was by far the largest contributor to this increase, except for the lowest income quintile, where social assistance benefits were the largest contributor to their income growth.
This is an important data-set and is the first time data for household groups has been released under the framework of the national accounts. We can look at which household groups are driving the growth in income, consumption, savings and wealth in the national accounts.
For example, households with two adults and dependent children were responsible for about one-third of the growth in household gross disposable income.
Households where the reference person was aged 35 to 44 years had an increase in income tax of $9,000 – with their payments going from $17, 000 in 2003-04 to $26,000 in 2011-12 – which was above the average increase of $4,500.
Of course this data stops in 2012, so we cannot yet see the impact of falling incomes in real terms, which we have discussed previously.