
CoreLogic RP Data April Home Value Index results confirmed that values across Australia’s combined capital cities increased by 0.8 per cent in April 2015, down from a 1.4 per cent month on month increase in March. Overall dwelling values shifted higher over the past month across every capital city except Canberra where values showed a 1.5 per cent drop over the month.
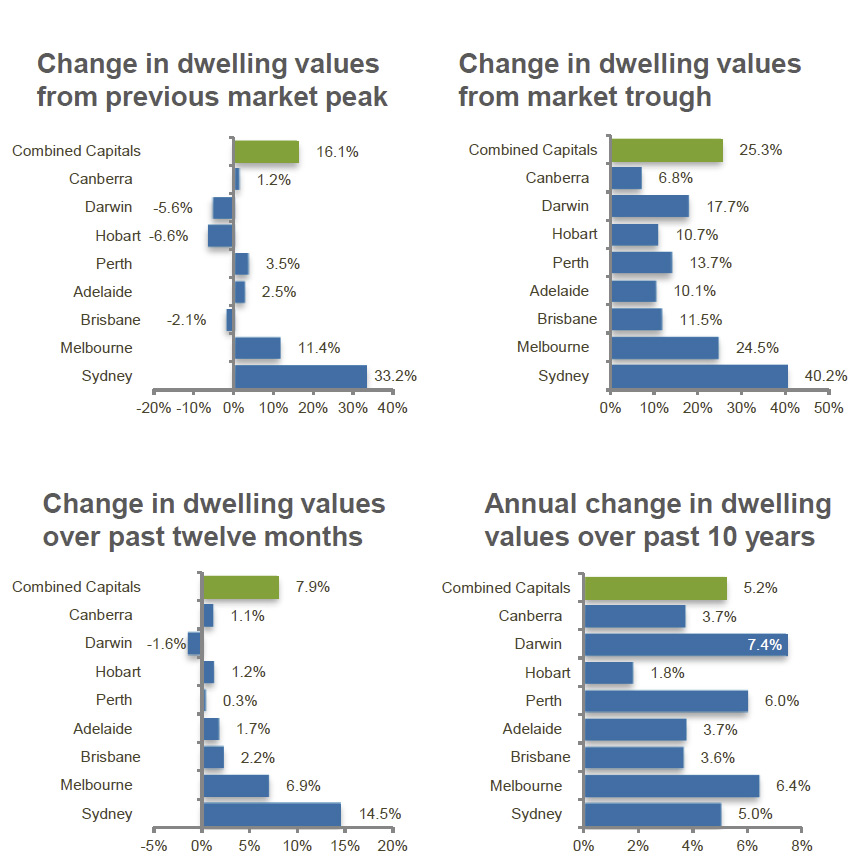
According to the April Home Value results, capital city dwelling values have been trending higher over the past 35 months, recording a cumulative increase of 25.3 per cent between the end of May 2012 and April 2015. While the combined capitals trend of dwelling value growth has been substantial, the rate of growth across the Sydney housing market stands head and shoulders above the other capital cities over the cycle to date. Sydney dwelling values are now 40.2 per cent higher relative to the May 2012 trough. If you factor in the previous 2009/10 phase of growth, Sydney values are now up 65.4 per cent post GFC. Melbourne is the only other capital city that comes close to this measure where dwelling values are 52.3 per cent higher post GFC. The next highest rate of growth is Darwin where values have moved 26.5 per cent higher, followed by Canberra (19.8%), Perth (15.2%), Adelaide (12.2%), Brisbane (8.0%) and Hobart (1.2%). The rate of growth in Perth and Darwin has slowed substantially in line with the wind down of major infrastructure projects associated with the resources sector and the housing market in Canberra has also softened post federal election.
 The performance of houses versus apartments has shown some interesting trends of late. Detached homes are continuing to outperform the multi-unit sector, with capital city house values up 8.3 per cent over the past year while unit values have risen by a lower 5.6 per cent. This trend is more noticeable in the key growth markets of Sydney and Melbourne. Sydney house values are up 15.5 per cent over the past year while unit values have risen by 9.7 per cent. The over-performance of houses compared with units is more apparent in Melbourne where house values are 7.6 per cent higher over the year compared with a growth rate of just 1.9 per cent across the unit market. A similar trend is evident across most of the capital cities and can likely be attributed to the higher supply levels in the apartment markets which are keeping a lid on the rate of capital gain.
Most other housing market indicators remain strong. Auction clearance rates have surged to new record highs after the February rate cut and have trended slightly higher over the final two weeks of April. Additionally, the number of homes being advertised for sale has been trending lower, particularly in Sydney where listing numbers are now lower than the number of properties being advertised for sale in Melbourne, Brisbane and Perth. The short supply of advertised homes in Sydney is likely to be one of the key factors driving local dwelling values higher, with buyers pressured to make a purchase decision quickly with minimal negotiation on asking prices due to few alternative housing options available for sale.
The performance of the housing market is increasingly varied across the capital cities. Sydney is continuing to dominate the headlines with such a high rate of capital gain, while Melbourne is also showing a solid performance. At the other end of the spectrum, Perth, Darwin, Hobart and Canberra are showing weaker results while Brisbane and Adelaide and are roughly keeping pace with inflation. In fact, outside of Sydney and Melbourne, the next highest rate of annual capital gain can be found in Brisbane where dwelling values are up a comparatively paltry 2.2 per cent.