
Whilst Lenders Mortgage Insurer Genworth renewed their important CBA contract, today’s 3Q results show the impact of the fall in high LVR lending and change in business mix. Of course some lenders are holding more LMI business within their own captive insurers. It also confirms rising defaults, especially in Queensland and Western Australia and in particular in mining related regions.
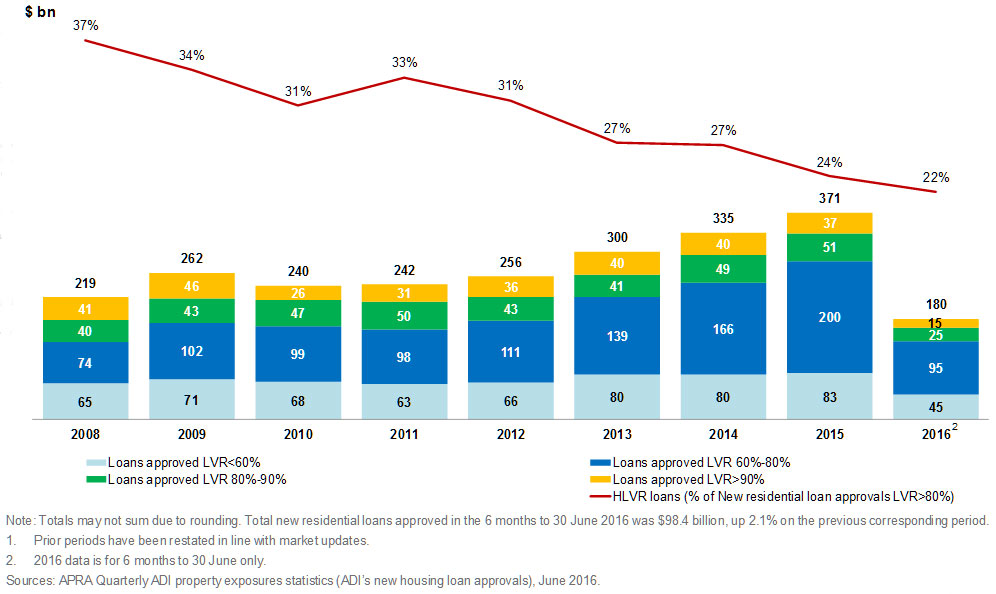
If high LVR lending continues to fall thanks to regulatory intervention, the LMI’s will remain under pressure. The stability of LMI’s is important for the overall financial stability of the banking sector thanks to their high mortgage exposures. Data from APRA shows the shift in loan mix.
 New business volume, as measured by New Insurance Written (NIW), of $6.1 billion in 3Q16, decreased 28.2 per cent compared with the previous corresponding period (pcp). Year-to-date NIW of $20.1 billion is down 23.3 per cent on the pcp.
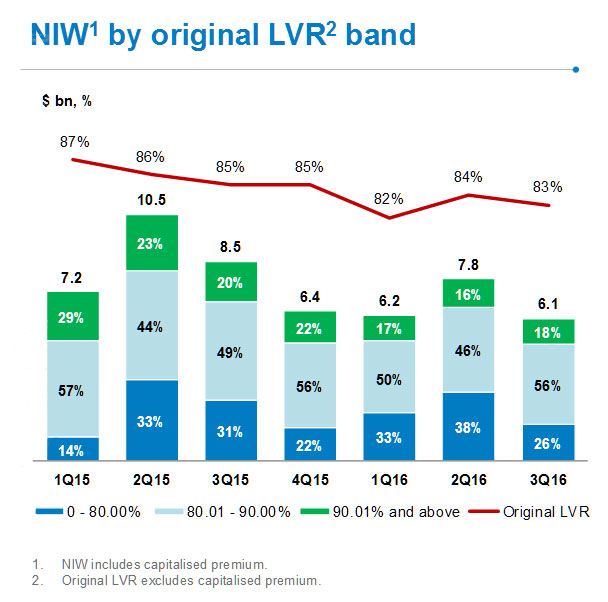 Gross Written Premium (GWP) decreased 25.8 per cent to $92.5 million in 3Q16. Year-to-date GWP is 31.2 per cent lower than the pcp.This reflects a number of factors including reduced high-LVR penetration in the market, a lower LVR mix of business, as well as the full impact of the changes in customers in 2015.
 Net Earned Premium (NEP) decreased 6.5 per cent to $115.9 million in 3Q16 compared with the pcp reflecting an adjustment to the NEP earnings curve implemented in 3Q15. Year-to-date NEP is down 1.4 per cent on the pcp.
The normalised loss ratio rose to 45.3 per cent in 3Q16 from 26.0. The number of claims paid rose from 286 (2Q16) to 321 3Q16. The average claim paid was $73k.
The overall portfolio continues to be supported by strong performance in New South Wales and Victoria. However, the performance in Queensland and Western Australia is still challenging, reflecting increased delinquencies, particularly in regions exposed to the slowdown in the resources sector as the economy in those areas navigates through a period of transition.
The expense ratio in 3Q16 was 25.8 per cent compared with 25.7 per cent in the pcp. The steady expense ratio reflects a continued focus on expense management. Genworth continues to manage the business with a target expense ratio of 26-28 per cent in 2016. Investment income of $36.3 million in 3Q16 included a pre-tax mark-to-market loss of $0.9million.
As at 30 September 2016, the value of Genworth’s investment portfolio was $3.5 billion, more than 95 per cent of which continues to be held in cash and highly rated fixed interest securities. As at 30 September 2016, the Company had invested $171 million in Australian equities in line with the previously stated strategy to improve investment returns on the portfolio within acceptable risk tolerances.
After adjusting for the mark-to-market movements, the 2016 year-to-date investment return was 3.51 per cent per annum, down from 3.70 per cent per annum in the pcp. As at 30 September 2016, the Company’s regulatory solvency ratio was 1.55 times the Prescribed Capital Amount (PCA).
The Board continues to target a capital range of 1.32 to 1.44 times the PCA ona Level 2 basis. The Company continues to focus on optimising its capital structure and is evaluating capital management initiatives that could be implemented in the future.
Genworth expects 2016 NEP to decline by approximately 5 per cent and for the full year loss ratio to be approximately 35 per cent. The Board continues to target an ordinary dividend payout ratio range of 50 to 80 per cent.