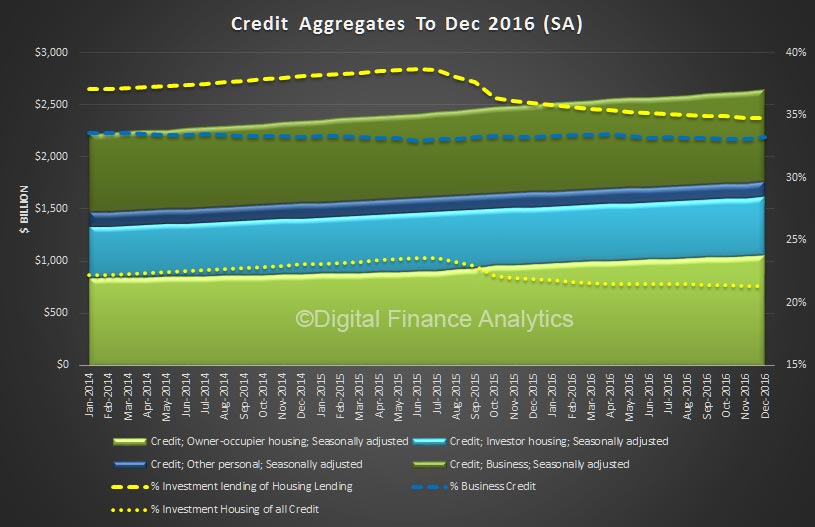
The RBA released their Credit Aggregates to December 2016 today. Total housing was a new record at $1.62 trillion.
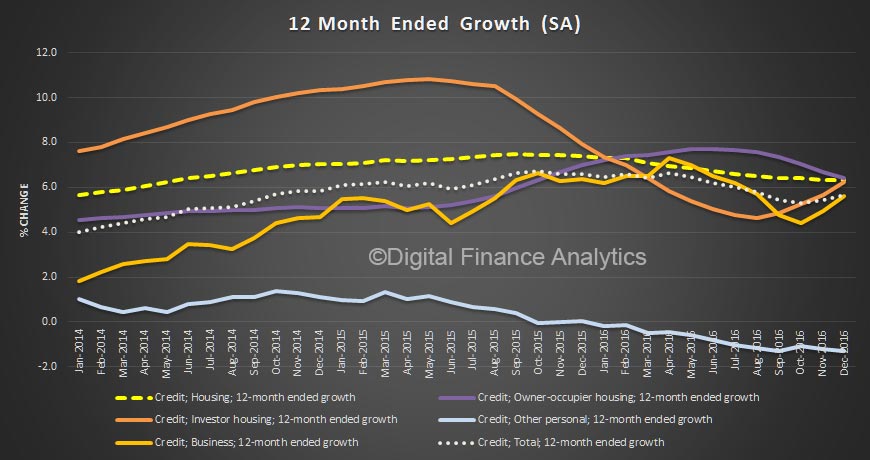
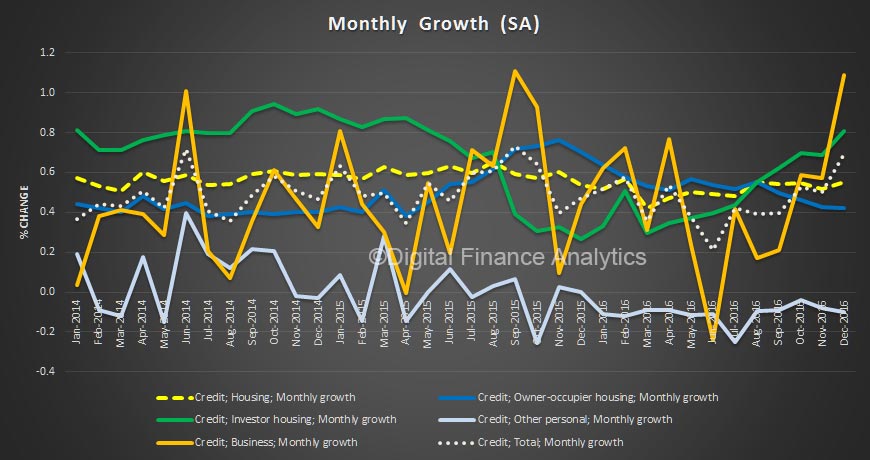
The headline statement from the RBA says housing grew 0.5% in the month and 6.3% annually, personal credit fell 0.1%, down 1.3% annually, and business credit role 1.1% in December, making 5.6% annually. All these are well above inflation, and wage growth.
Within housing, investment lending continued to grow up 0.8%, compared with 0.4% for owner occupied lending, making annual changes of 6.2% and 6.4% respectively. So, once again we see growth in the investment sector moving up, which is in line with our surveys.
 The monthly data shows the spike in both investment lending for housing and other business lending. This dataset, says the RBA has been adjusted for series breaks, to reflect as accurate picture as possible.
 Now, things get interesting if we look at the more detailed data, which does not include series adjustments, although they are seasonally adjusted. Clearly there was further switching between loan categories.
Total lending for housing rose to $1.62 trillion, up $14 billion in the month. This is a new record and is up 0.88% from last month. On these figures, owner occupied loans grew 0.9% ($9.4 billion) and investment loans grew 0.84% ($4.68 billion). We see variations in the personal credit series too, with borrowing up 0.1% in the month, by $0.15 billion to $144 billion; business credit rose by 1.29% or $11.2 billion to $879.8 billion. But there is no way we can reconcile the two data series, so actually, we just have to take the RBA’s word on the figures – hardly open and transparent. Perhaps they prefer to paint the lower “adjusted figure” to support their view all is well in the housing lending sector, but it is mighty strange to have such varied outcomes.
 We also see the proportion of housing lending for investment purposes remained at 34.8% of all lending, still too high in our view and the proportion of lending to business rose a little to 33.2% of all lending. We are still over leveraged into housing generally, and to investment housing in particular.
The RBA noted:
All growth rates for the financial aggregates are seasonally adjusted, and adjusted for the effects of breaks in the series as recorded in the notes to the tables listed below. Data for the levels of financial aggregates are not adjusted for series breaks. Historical levels and growth rates for the financial aggregates have been revised owing to the resubmission of data by some financial intermediaries, the re-estimation of seasonal factors and the incorporation of securitisation data. The RBA credit aggregates measure credit provided by financial institutions operating domestically. They do not capture cross-border or non-intermediated lending.
Following the introduction of an interest rate differential between housing loans to investors and owner-occupiers in mid-2015, a number of borrowers have changed the purpose of their existing loan; the net value of switching of loan purpose from investor to owner-occupier is estimated to have been $48 billion over the period of July 2015 to December 2016, of which $0.9 billion occurred in December 2016. These changes are reflected in the level of owner-occupier and investor credit outstanding. However, growth rates for these series have been adjusted to remove the effect of loan purpose changes”.
We will discuss the APRA monthly banking stats later.

One thought on “Credit Growth Strong In December; But By How Much?”