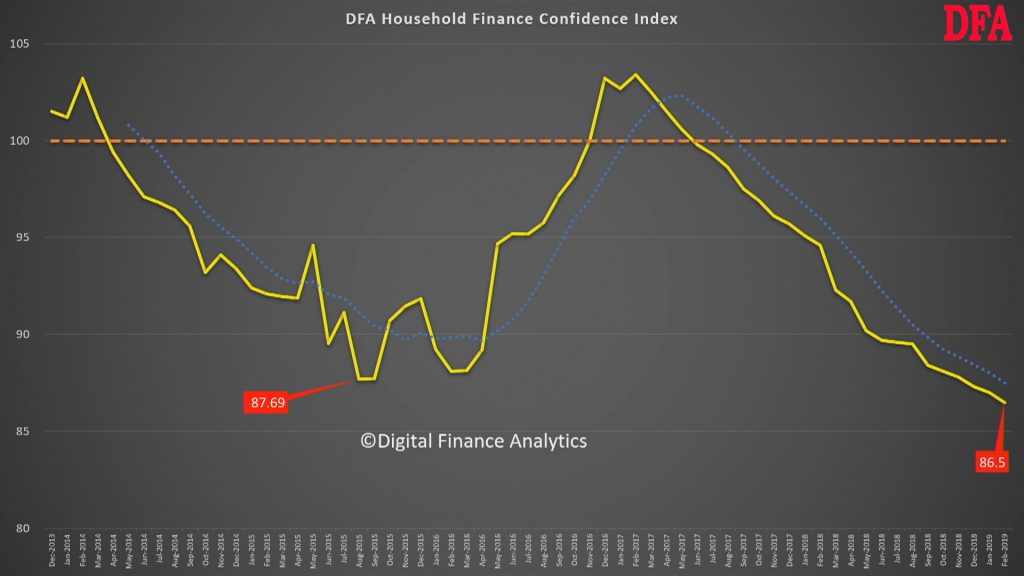
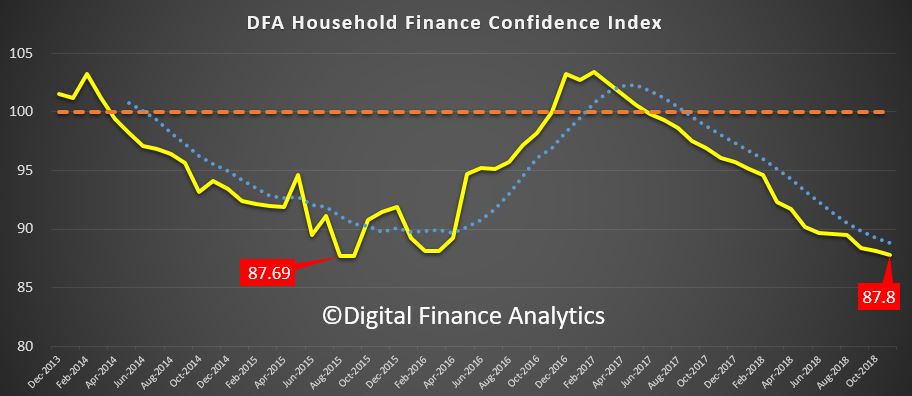
DFA has released the March 2019 Household Financial Confidence Index, which is based on our rolling 52,000 household surveys.
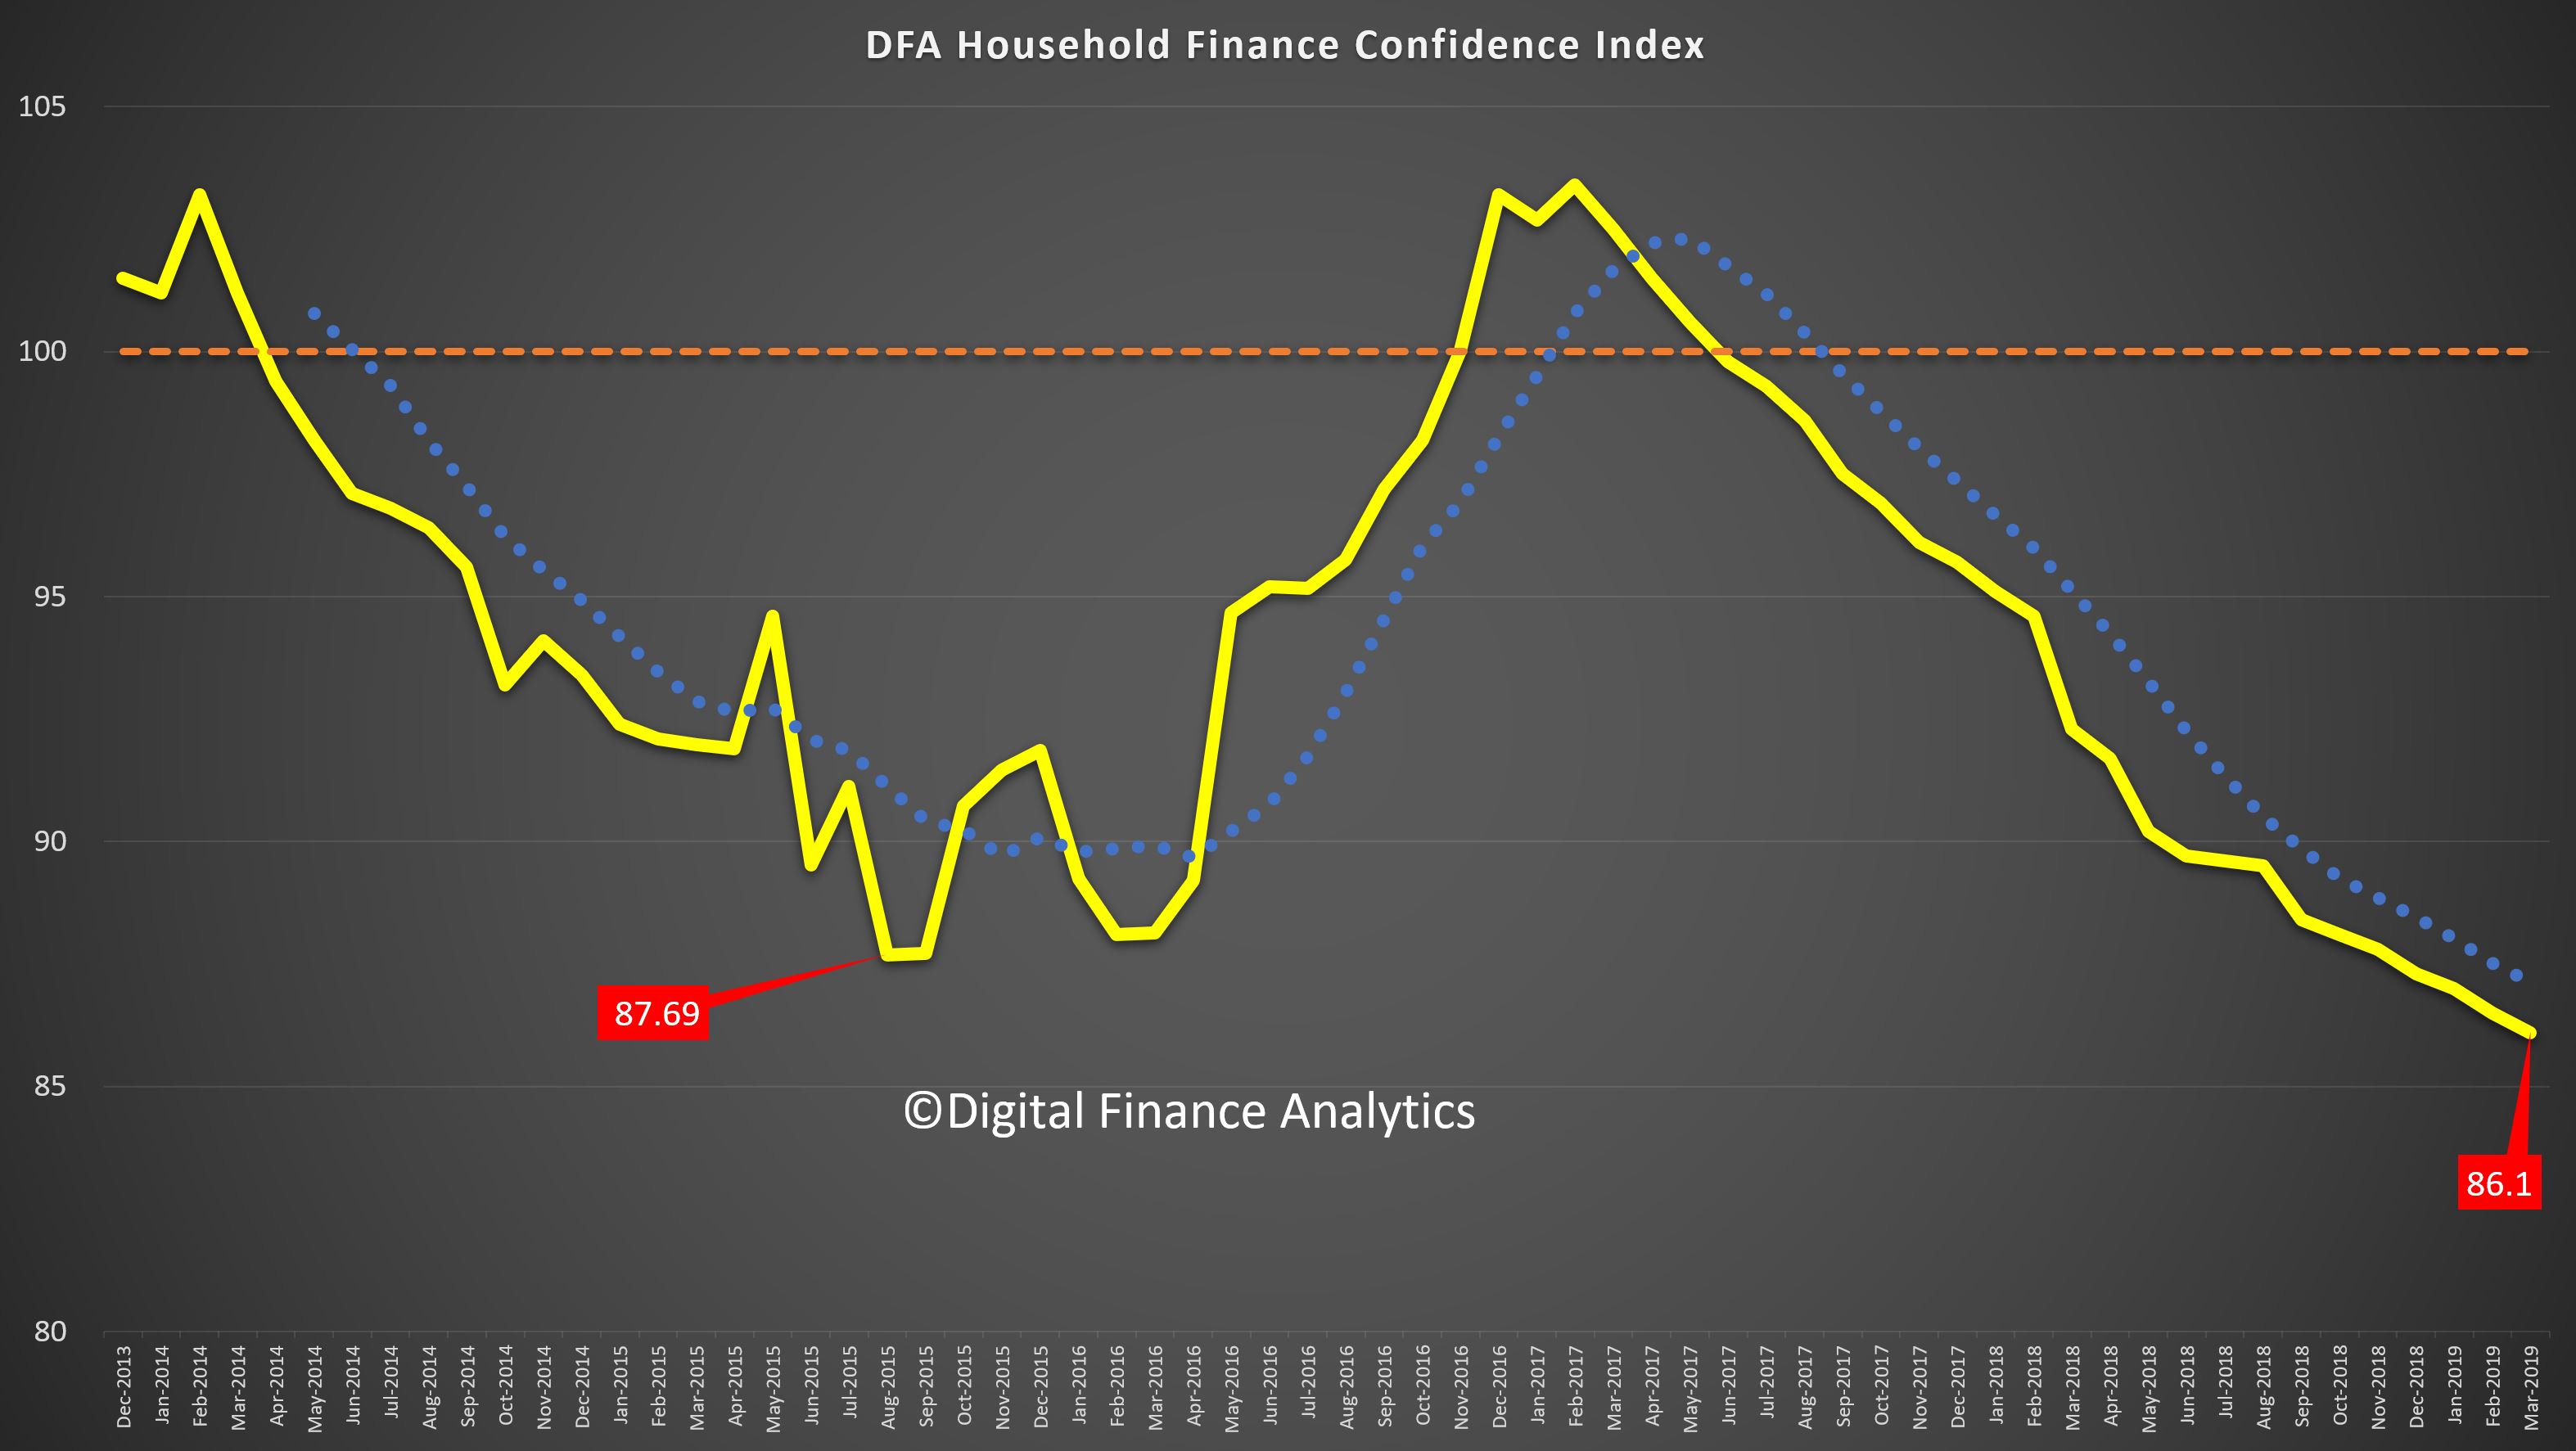
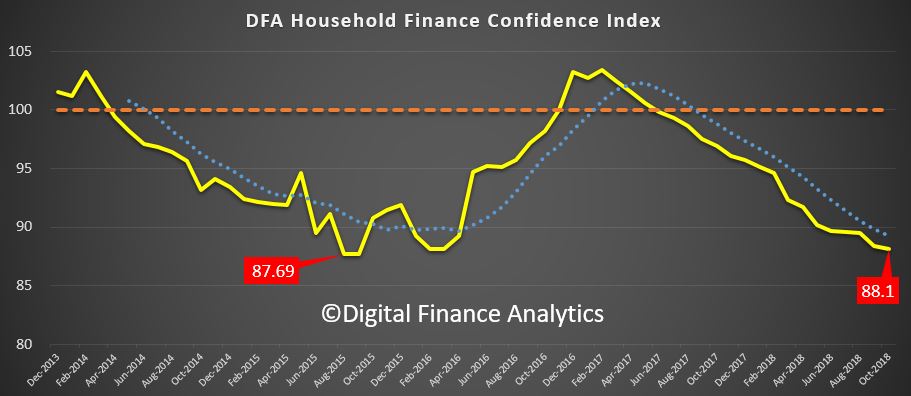
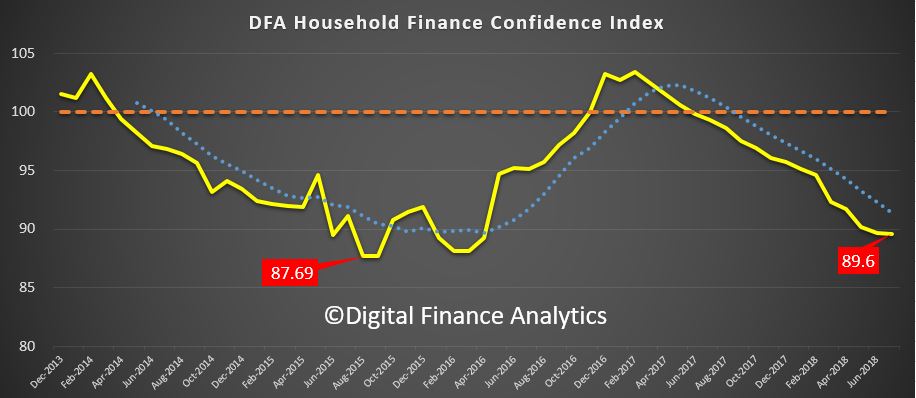
The index reached a new low this past month as the weight of issues on many household’s shoulders pile up. The index fell to 86.1, well below the 100 neutral setting.
This video discusses our findings.
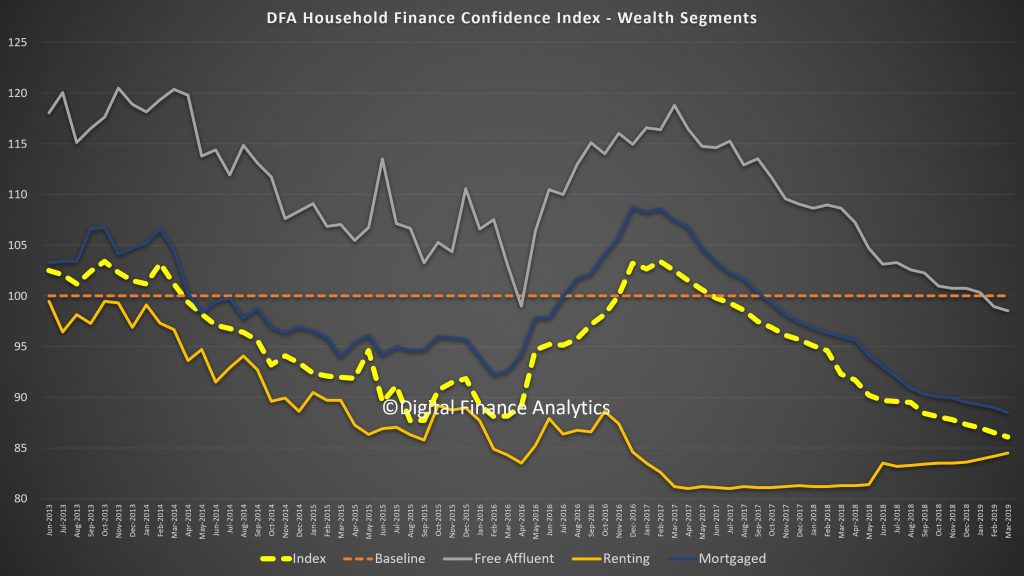
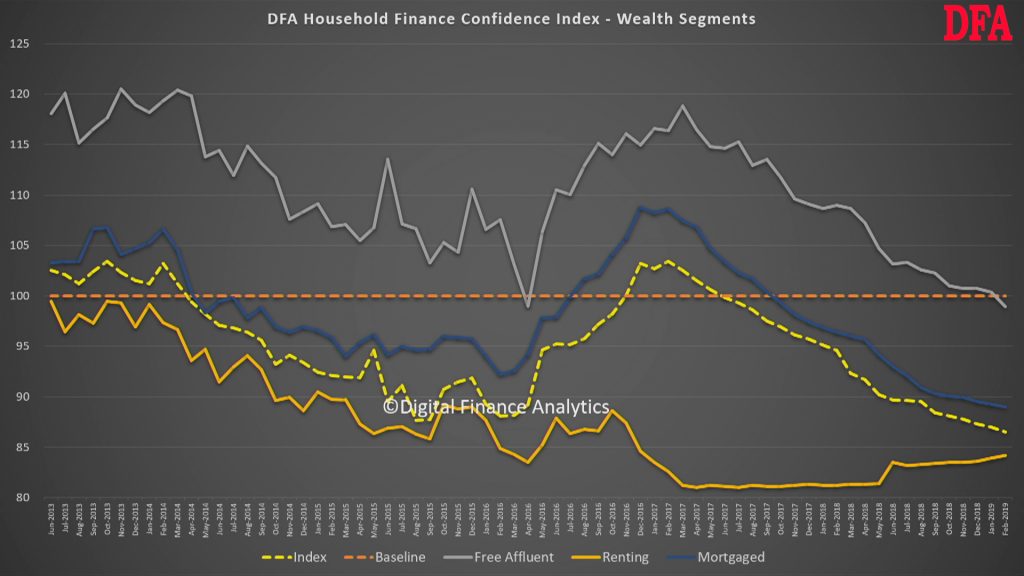
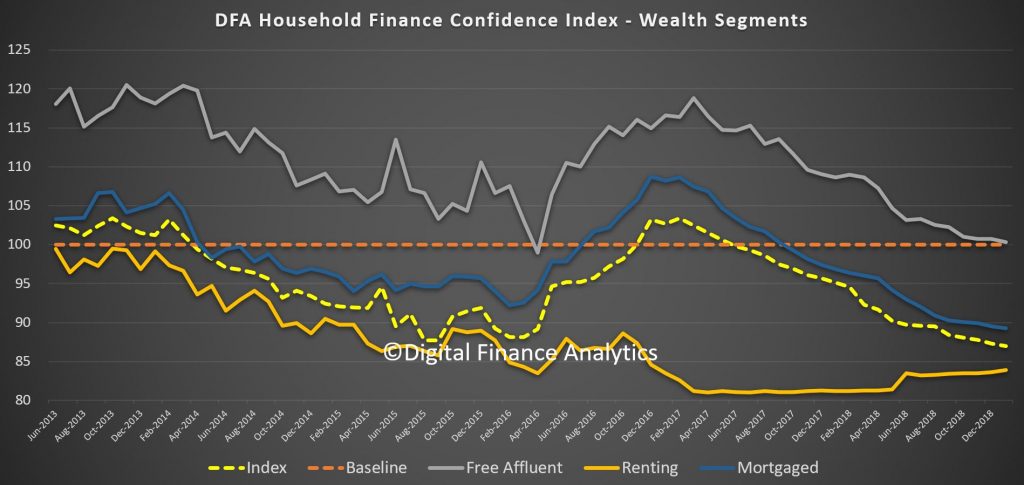
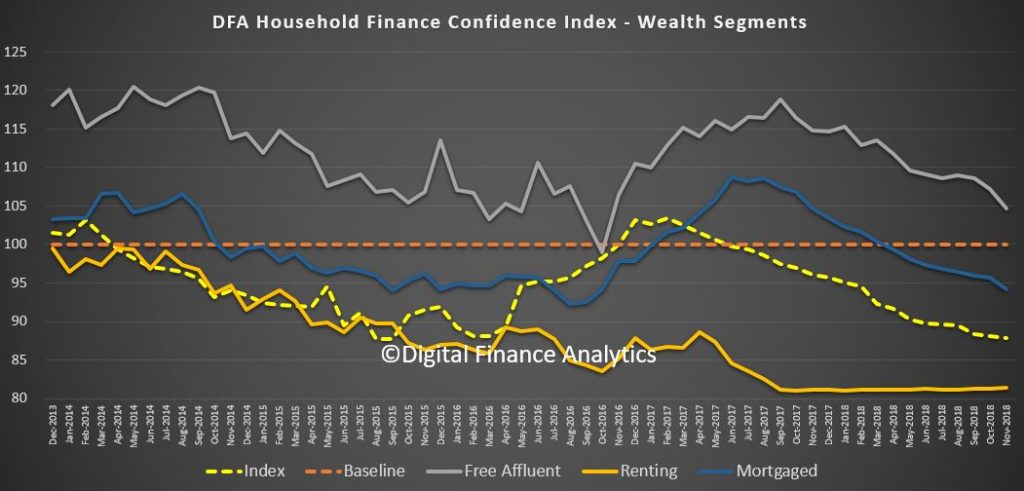
But in essence, all household segments, using our wealth lens, now sit below neutral, with those households with mortgages continuing to track lower, together with those who own property but are mortgage free. In fact the only segment showing a rise is the renting cohort, who see their rents in some centres (especially Sydney) on the decline. We find more among the Free Affluent segment, which is more aligned to the incumbent government, questioning their economic management.
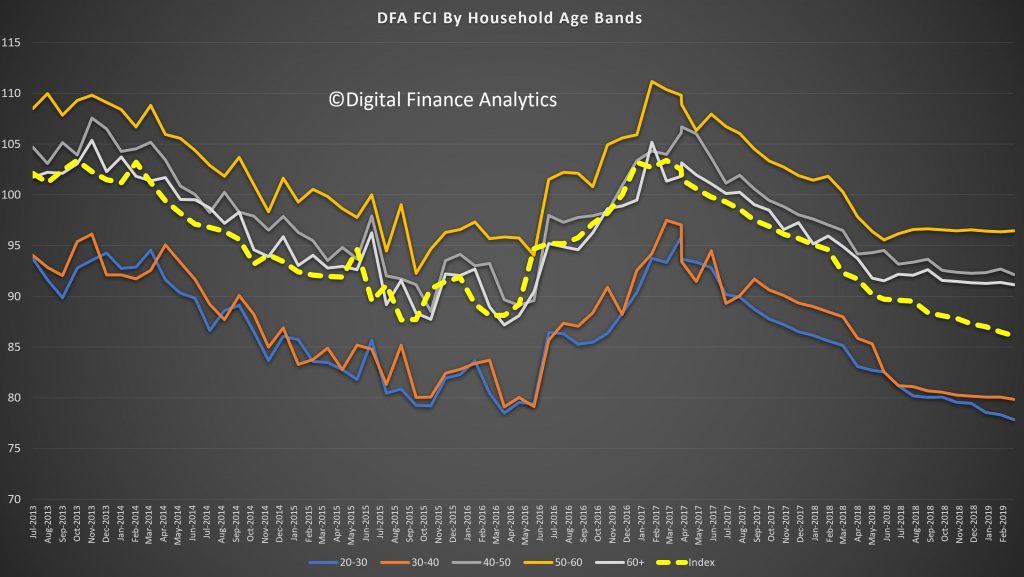
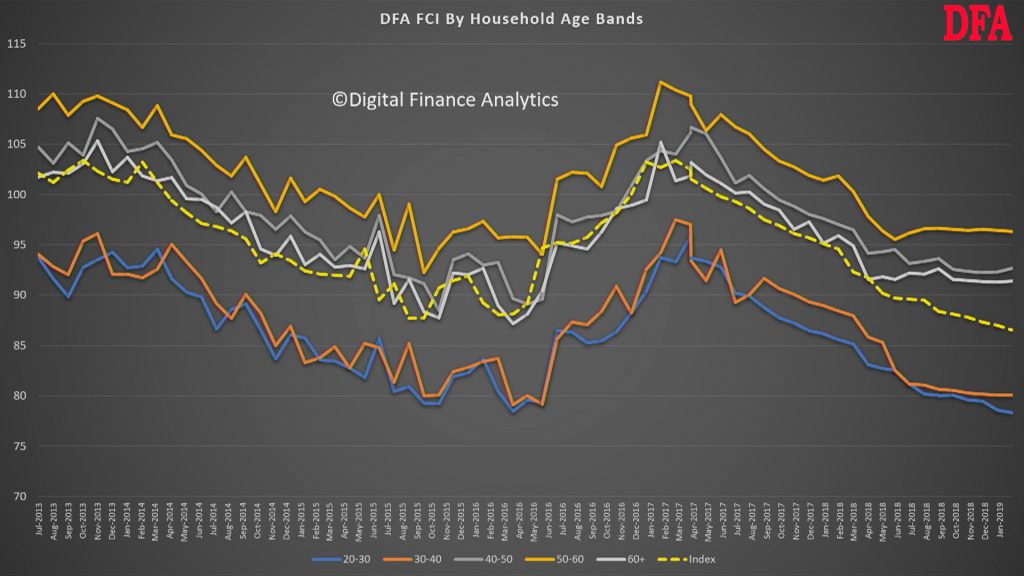
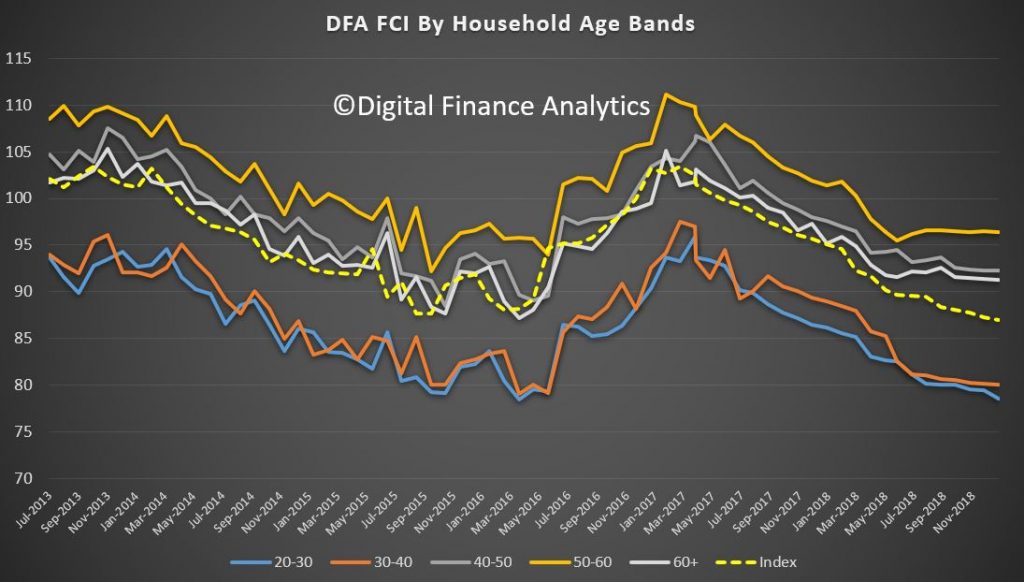
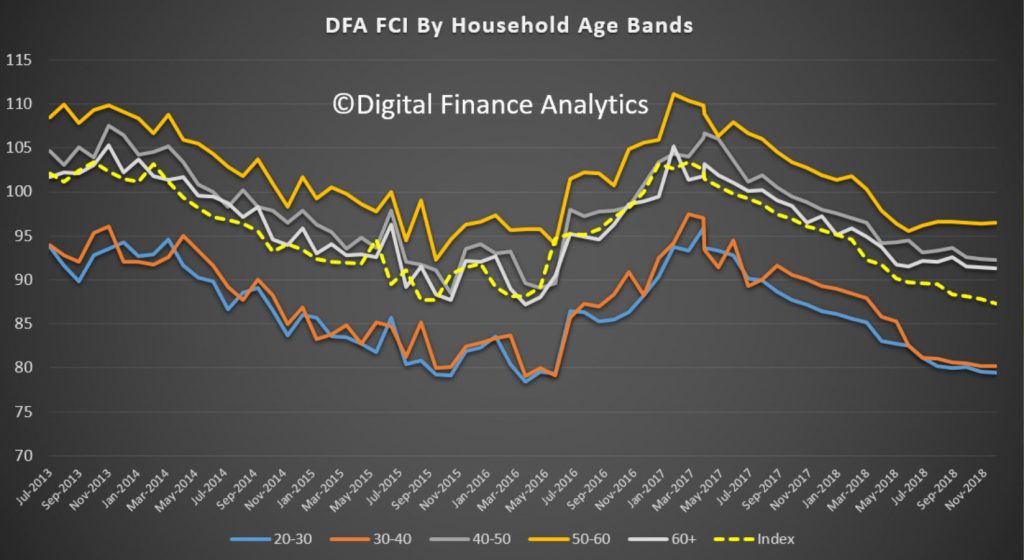
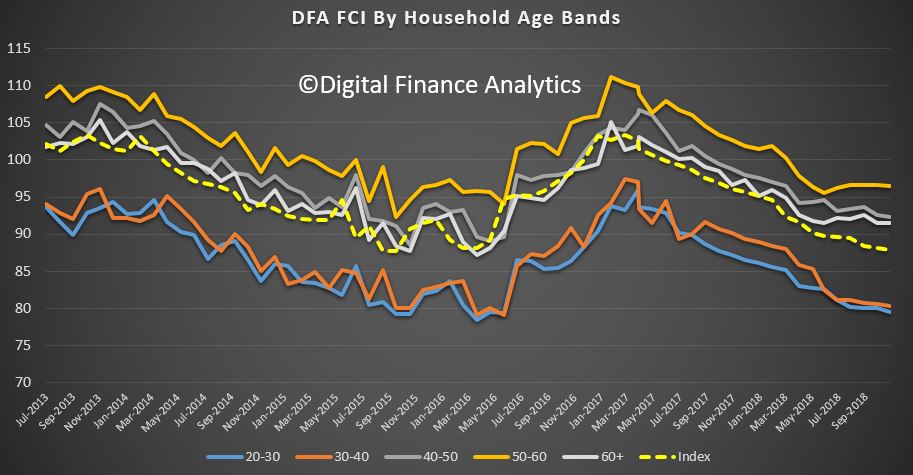
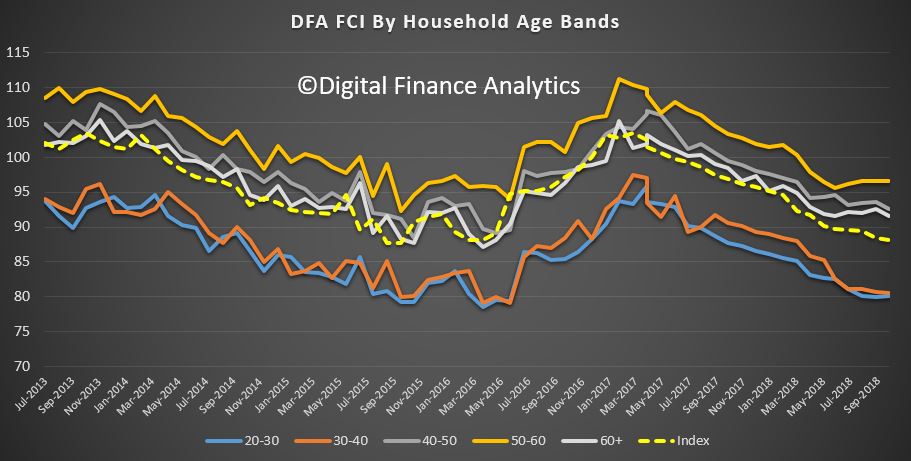
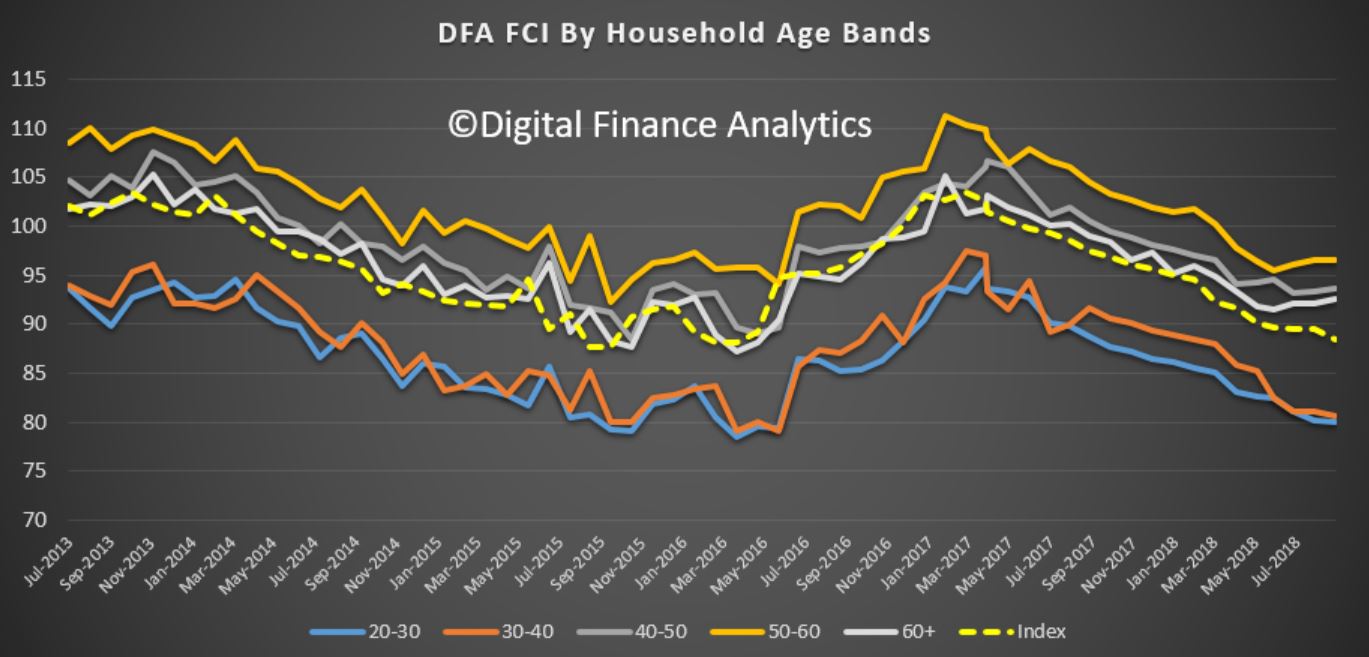
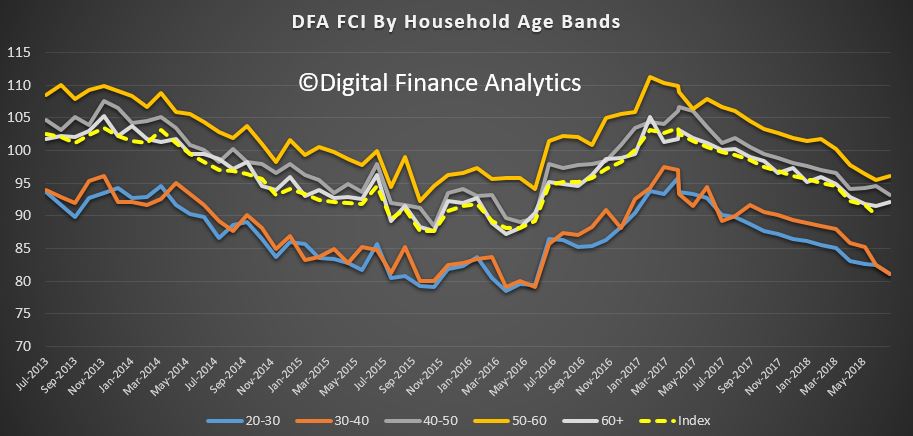
Across the age bands, younger households are more negative, and this highlights some of the inter-generational tensions which we suspect will be played up in the yet to be announced election campaign. In fact, households in the 50-60 year band are most confident (thanks to lower mortgages, bigger savings and controlled costs).
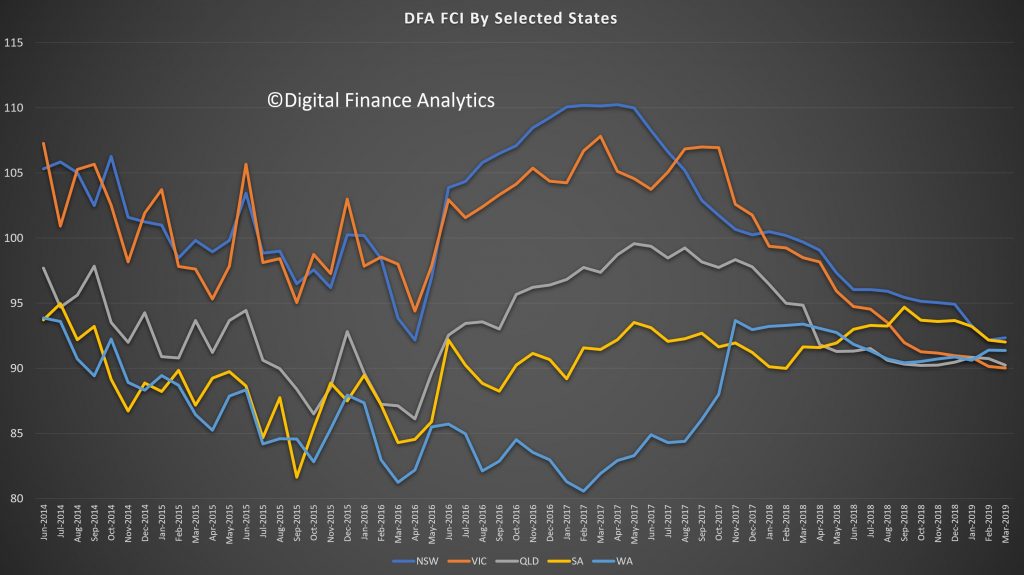
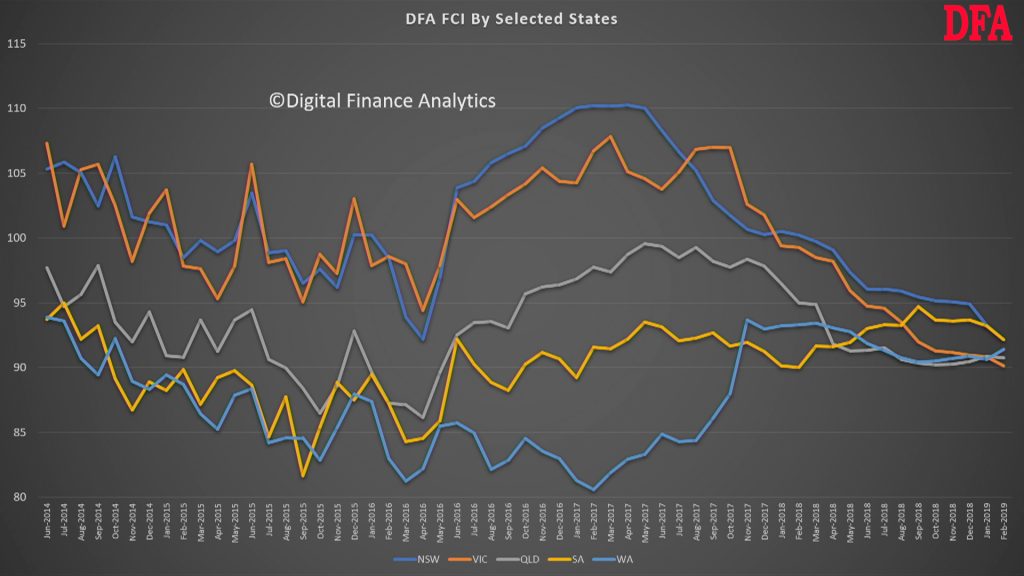
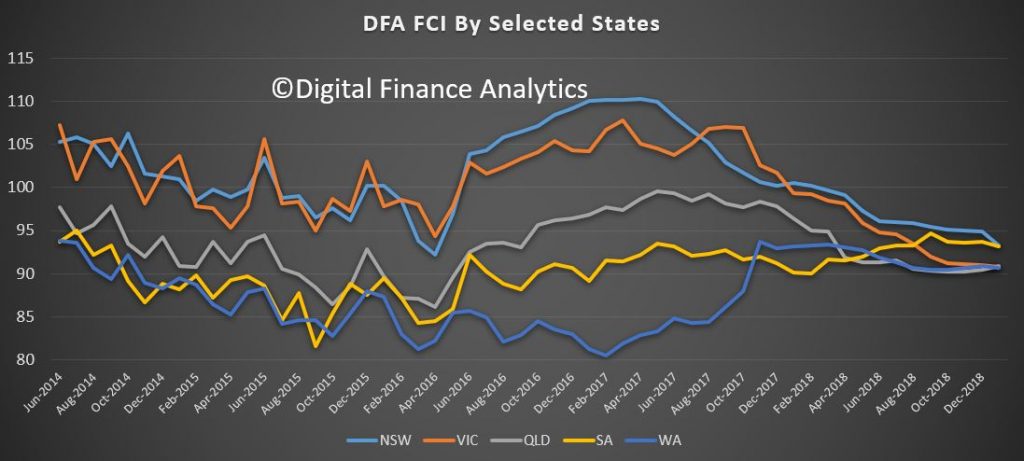
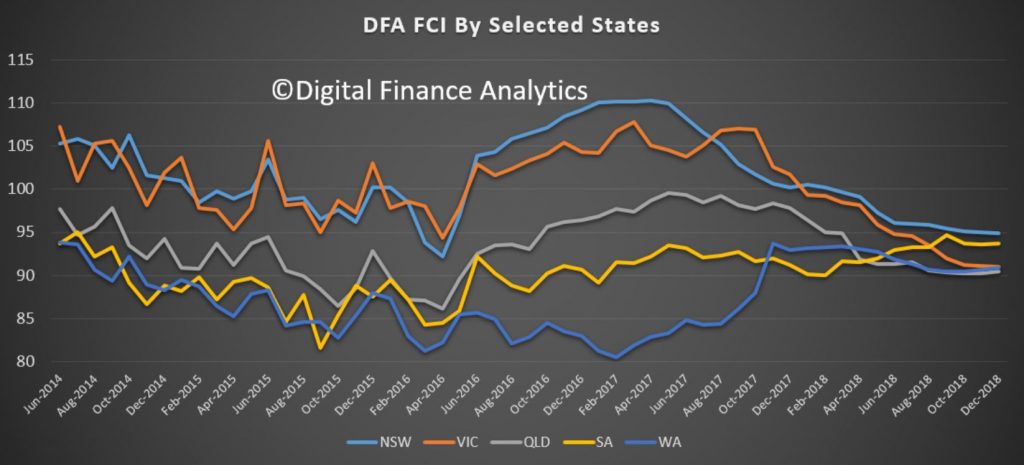
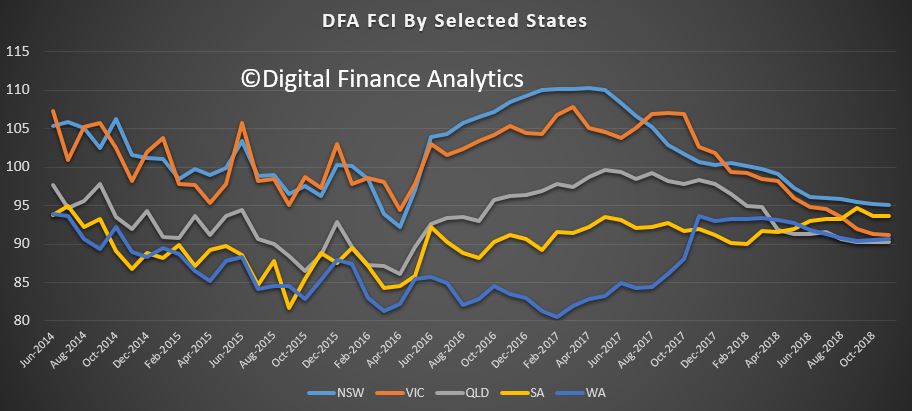
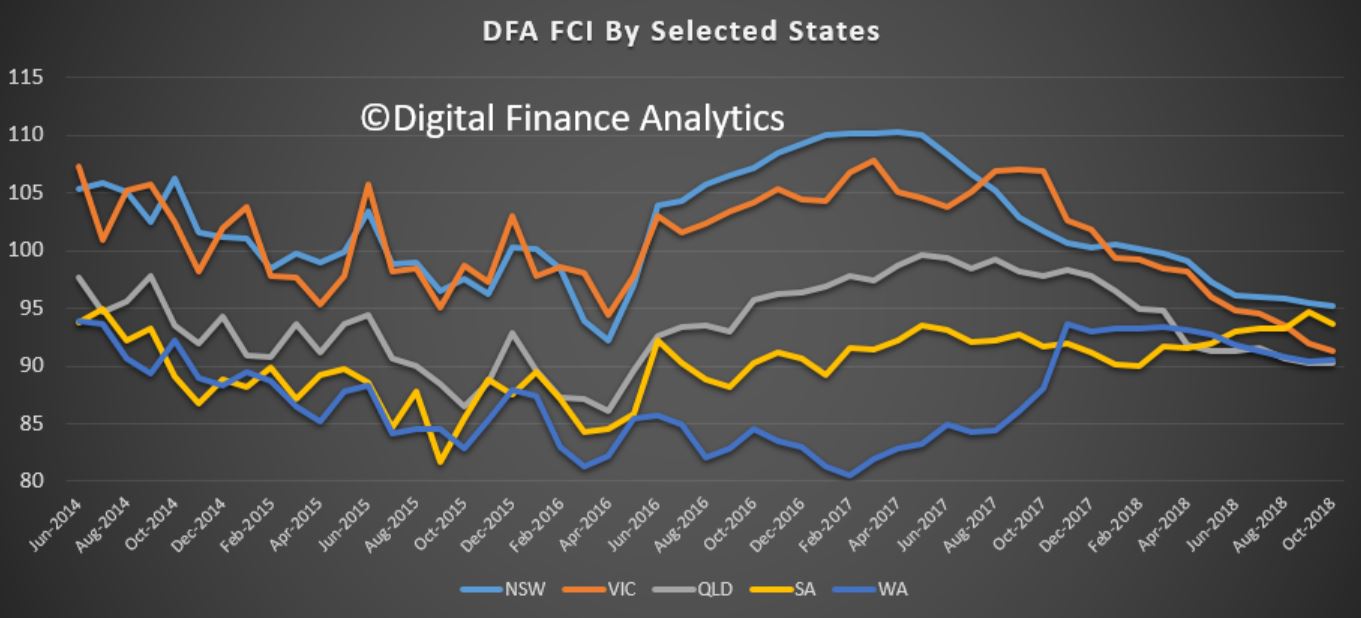
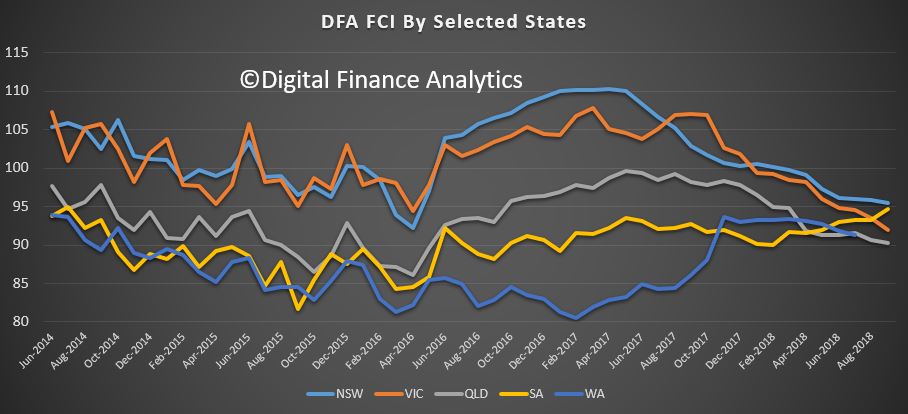
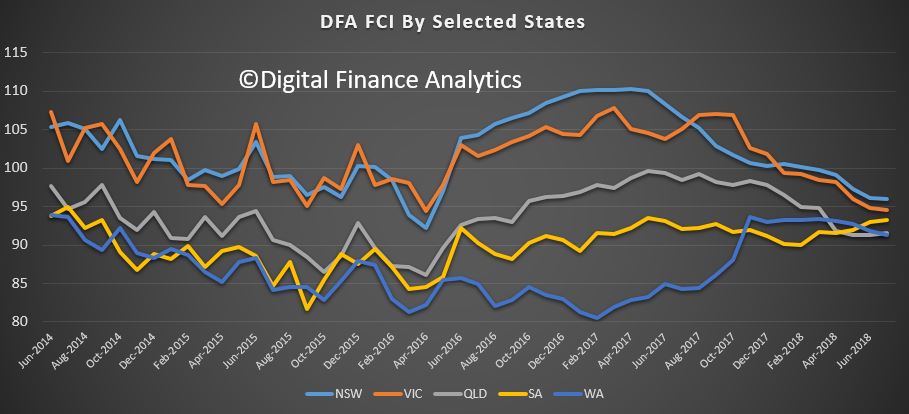
We also see the state indices have consolidated below the neutral setting, as the confidence from households in NSW and VIC are eroded. Much of this is connected with falling home prices.
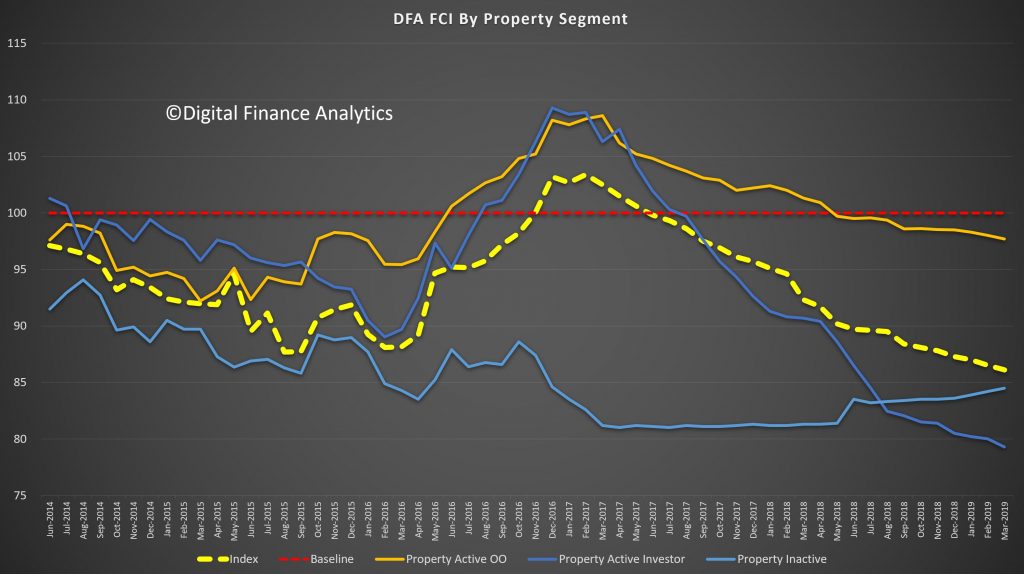
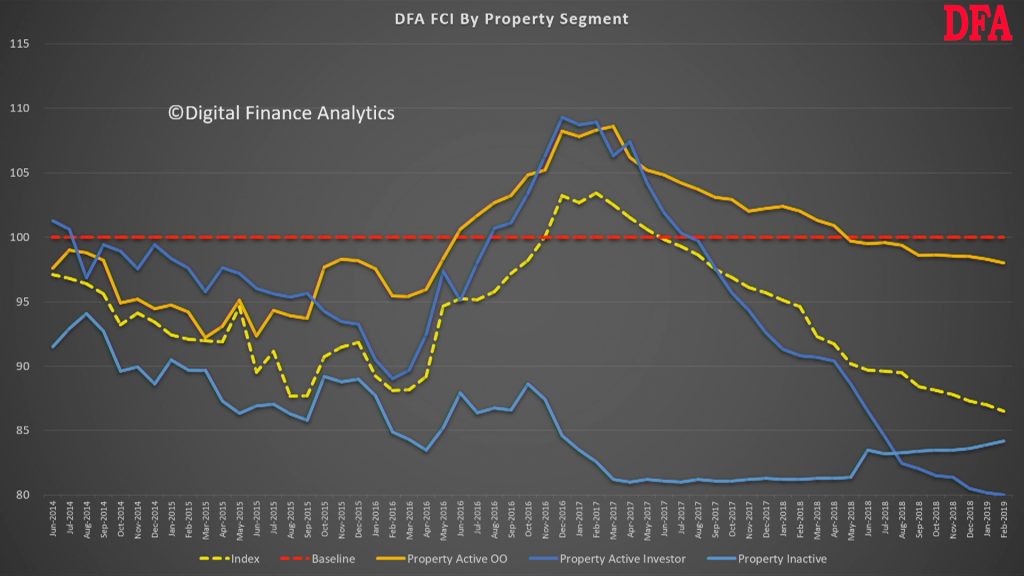
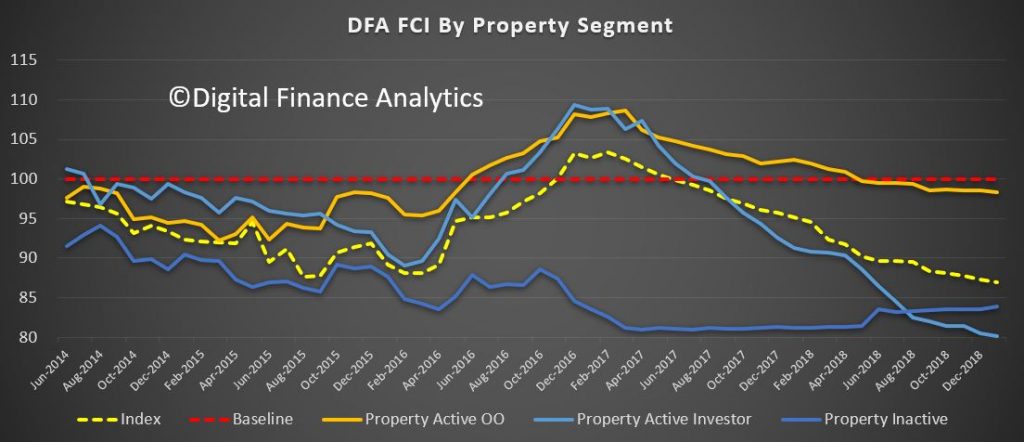
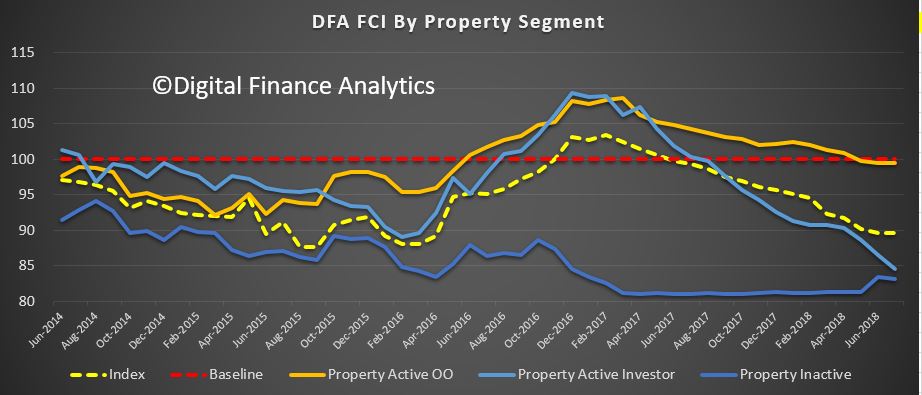
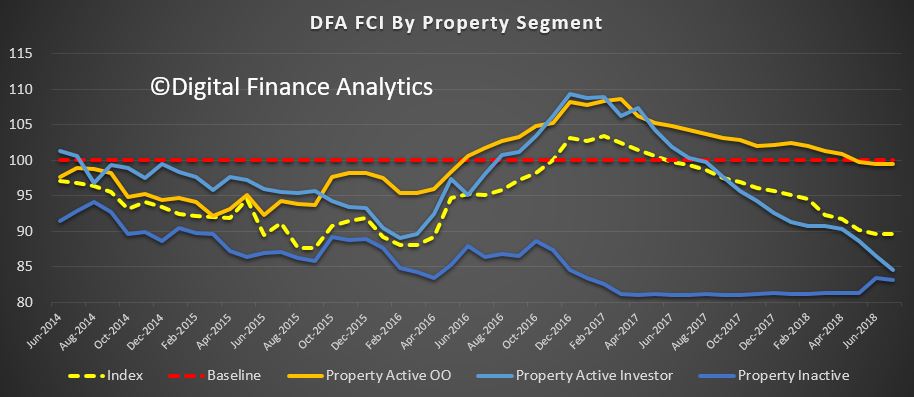
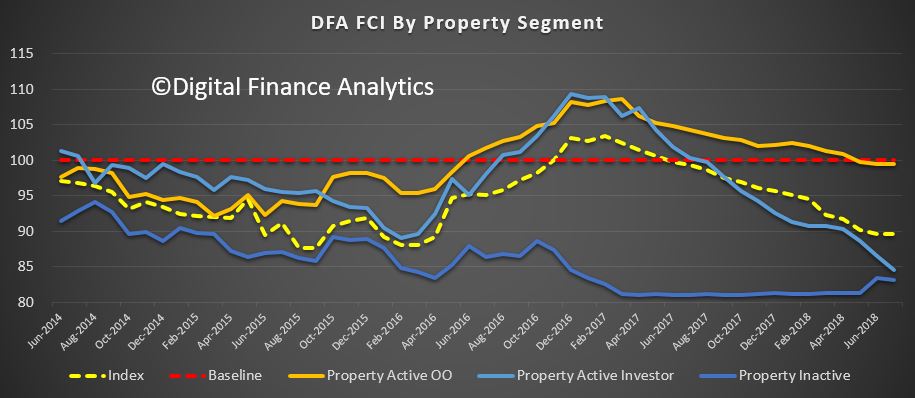
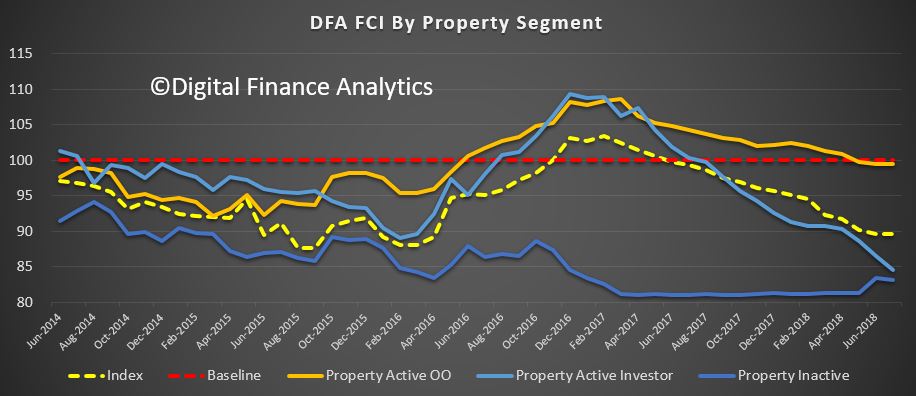
Across our property segmentation, property investors remain the most concerned, with falling home prices, the switch from interest only lending, lower net rental yields and the risks from changes to negative gearing and capital gains all playing in. On the other hand renters are finding some less expensive rentals now, and greater supply. Owner Occupied households are more positive, but still below neutral. This may mark the end of the great property-owning bonanza, at least for now.
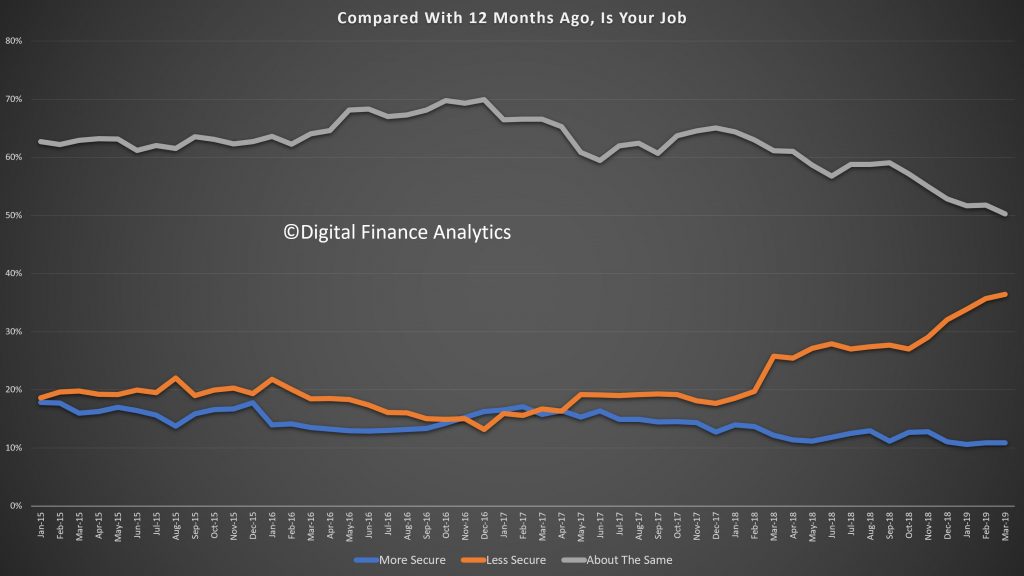
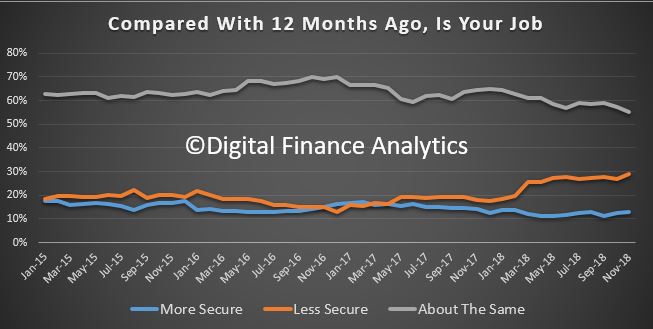
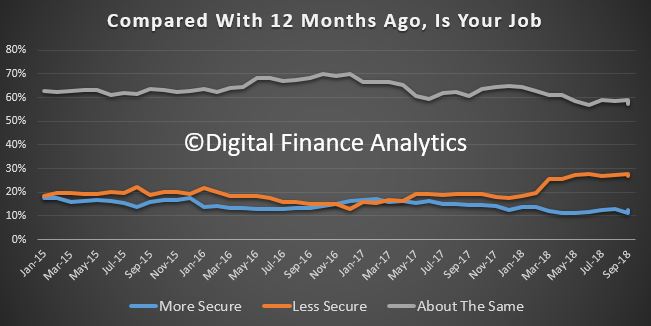
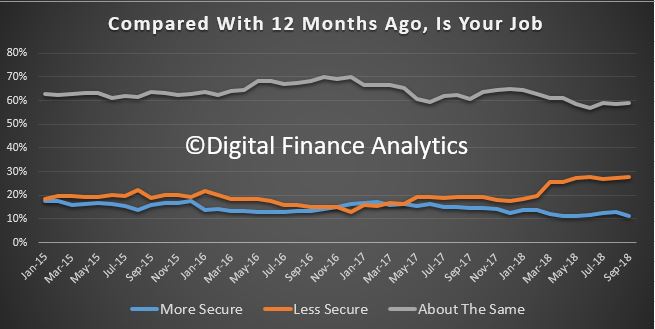
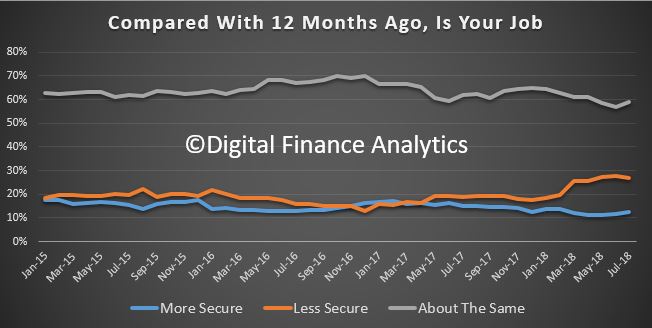
Looking across the moving parts of the index, more households are feeling insecure about their job prospects, thanks to pressure in the construction, retail and real estate sectors.
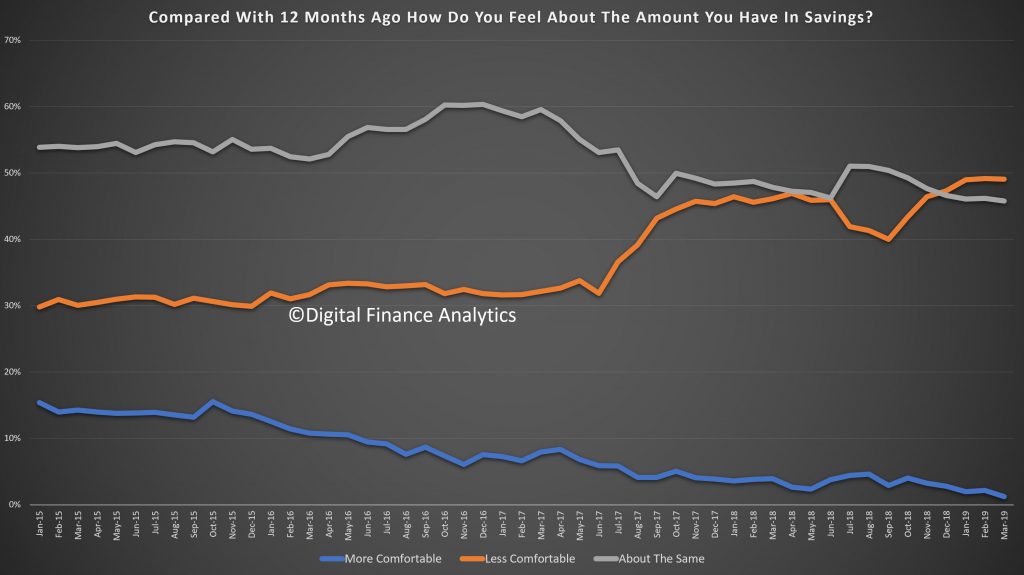
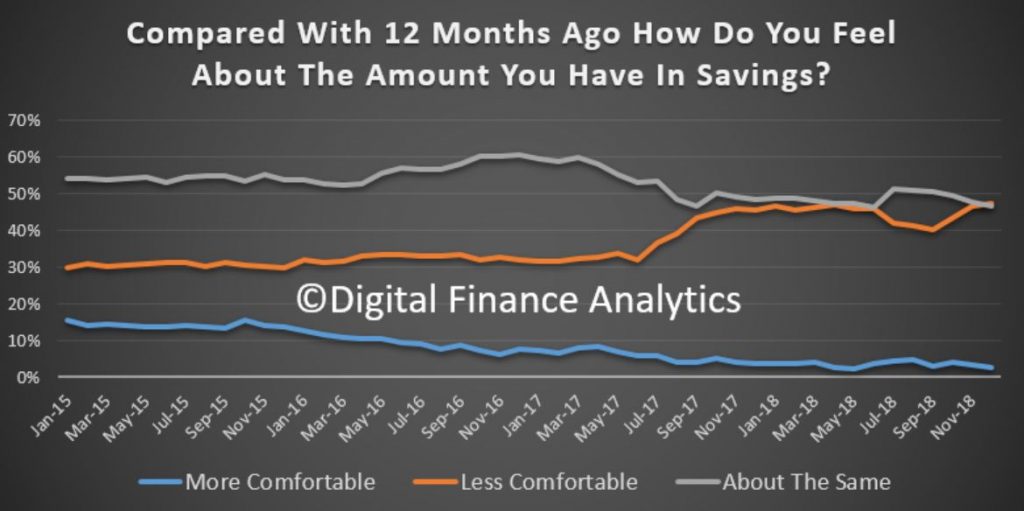
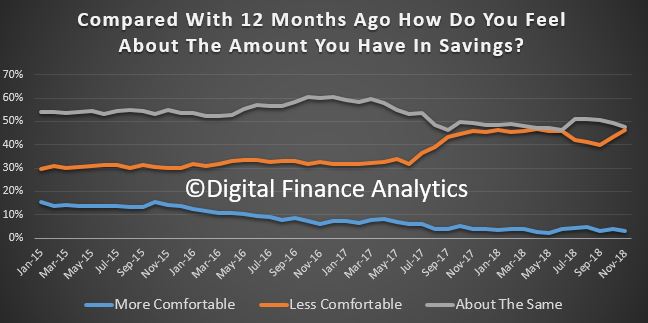
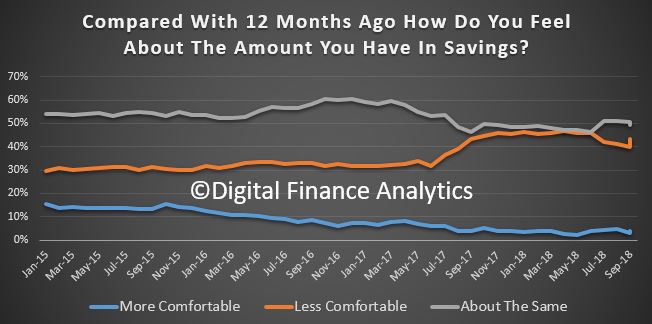
Savings are under pressure from first continued low bank deposit rates, and second, the need to raid savings to keep the household budget in balance. Share values did improve in the month, which offset some of the gloom.
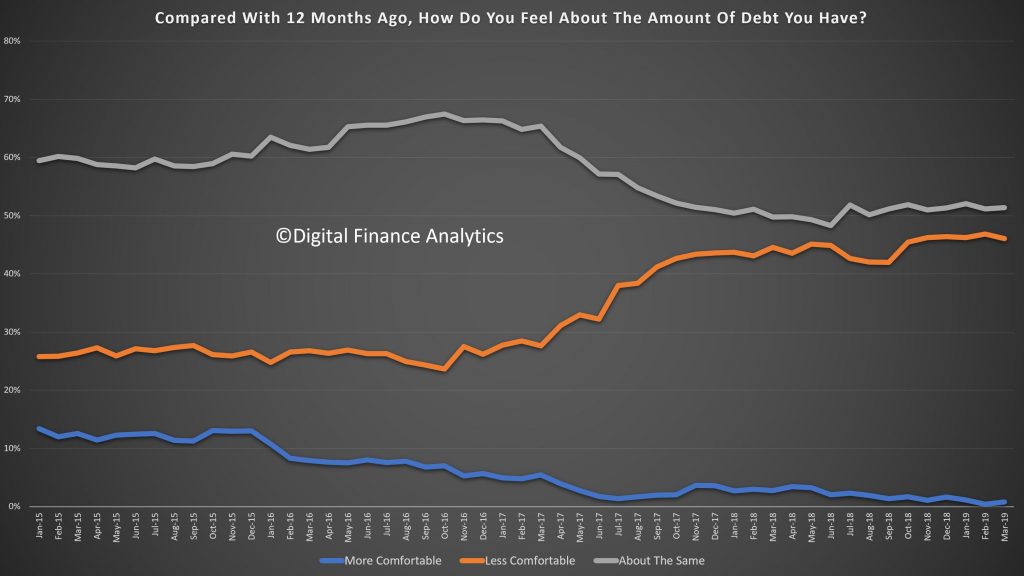
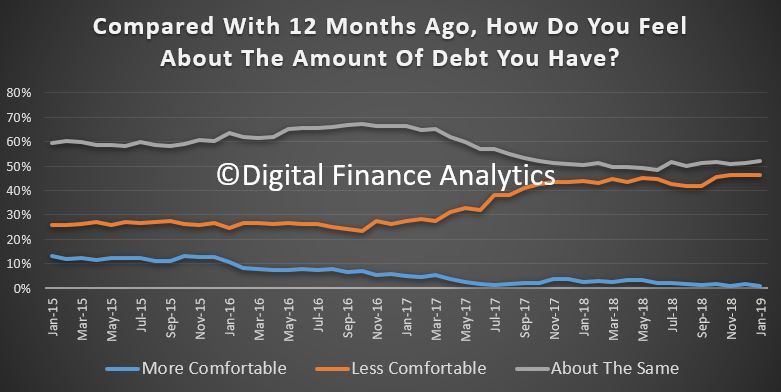
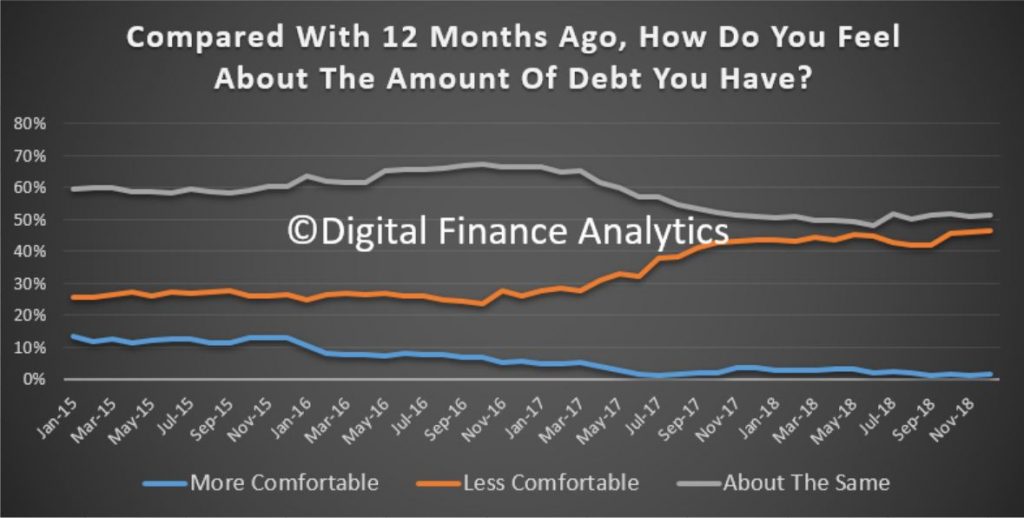
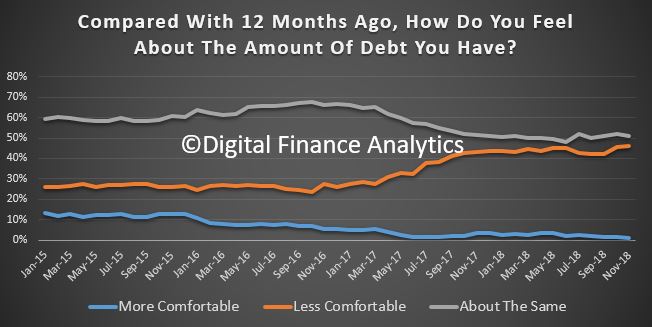
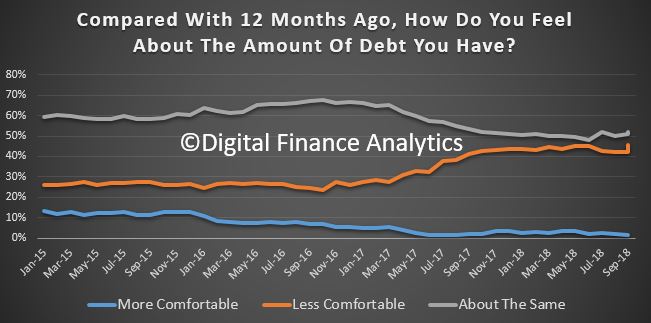
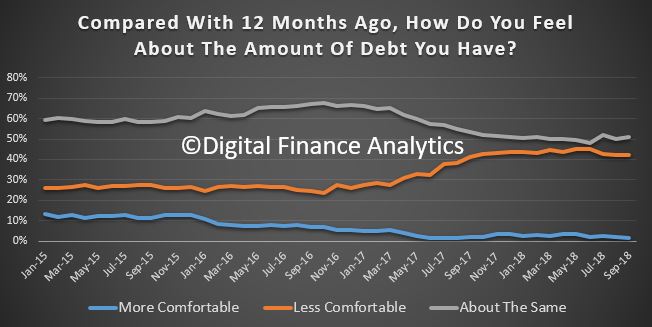
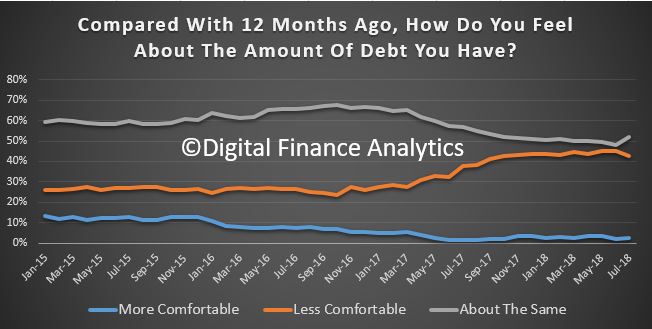
Households are felling the pressure of the high debt (and as the IMF recently showed not just among affluent households). Just under half are now less comfortable with their debt than a year ago, a trend which started to rise in early 2017.
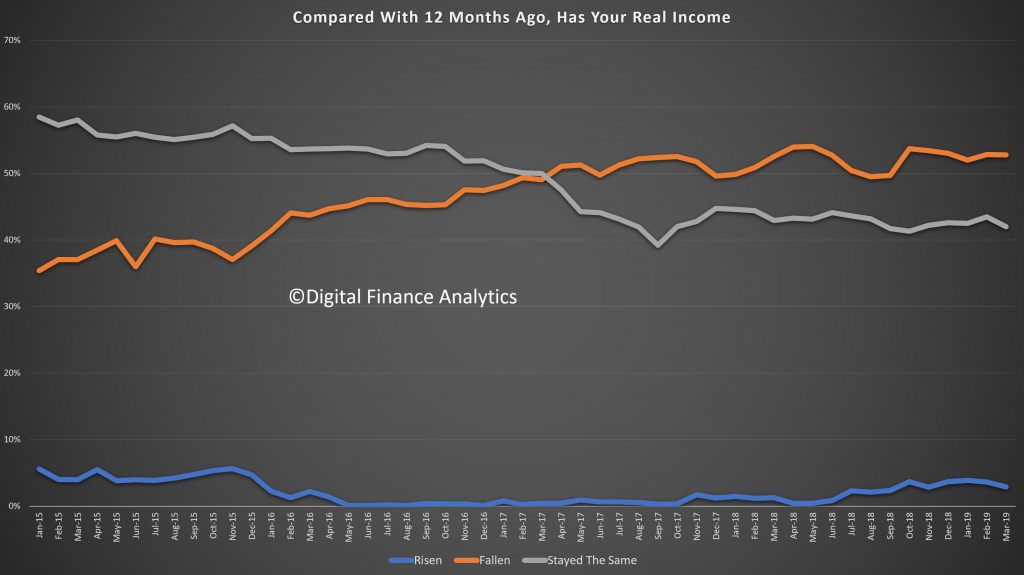
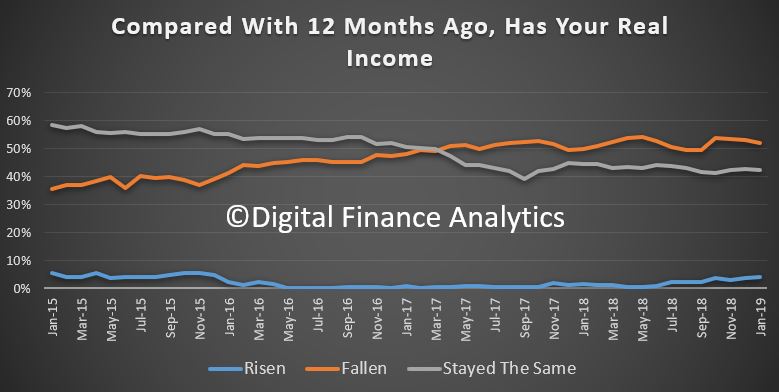
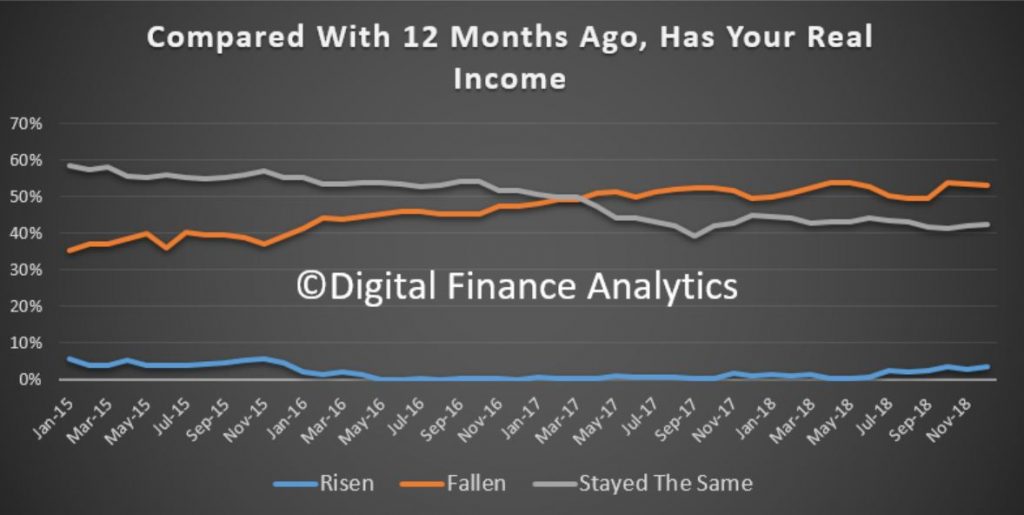
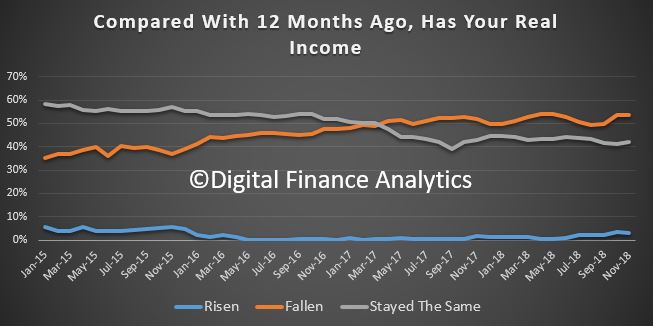
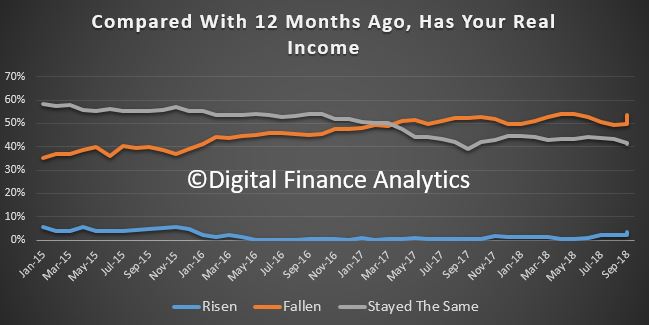
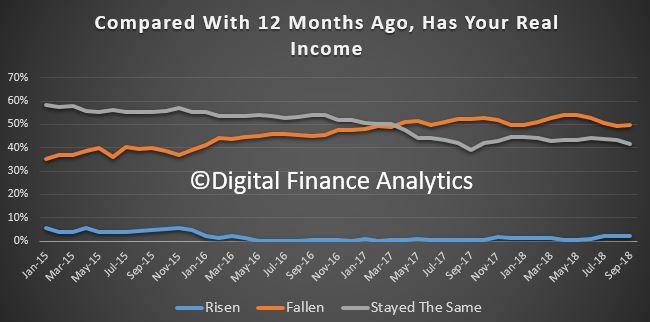
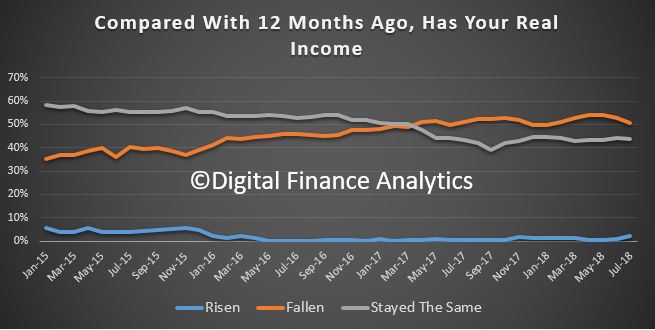
Incomes, in real terms, remain under pressure, with those in the public sector experiencing small rises, but many in the private still in negative territory. More than half say, in real terms, incomes have fallen over the past year.
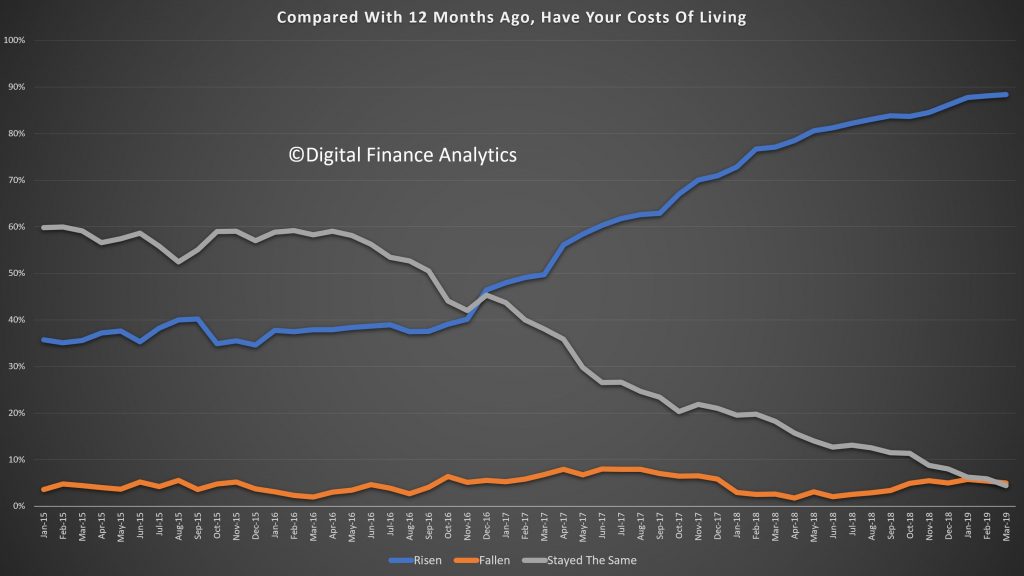
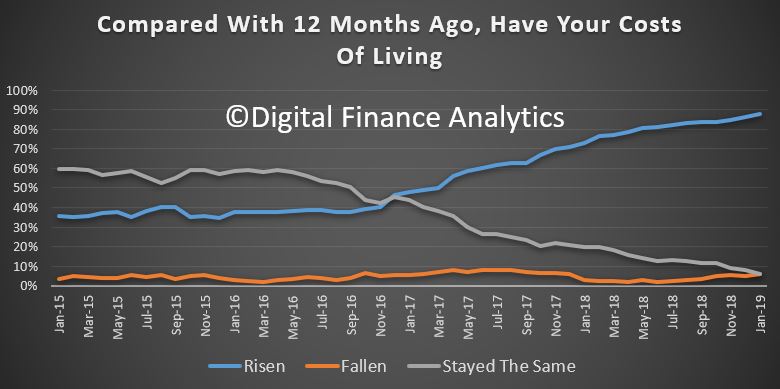
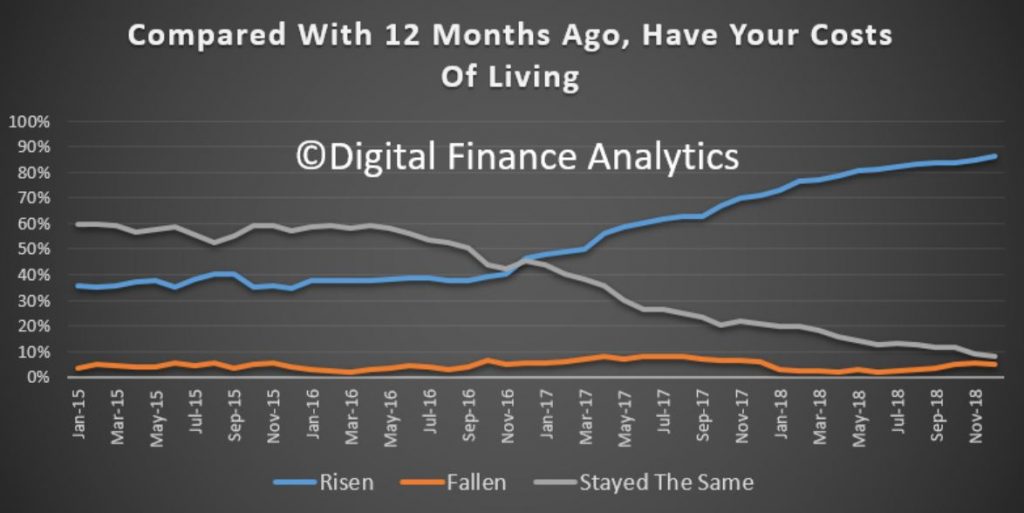
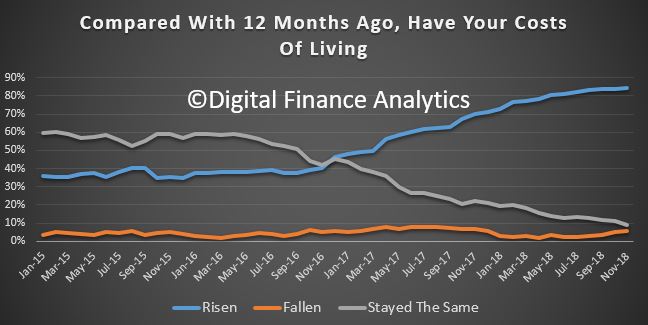
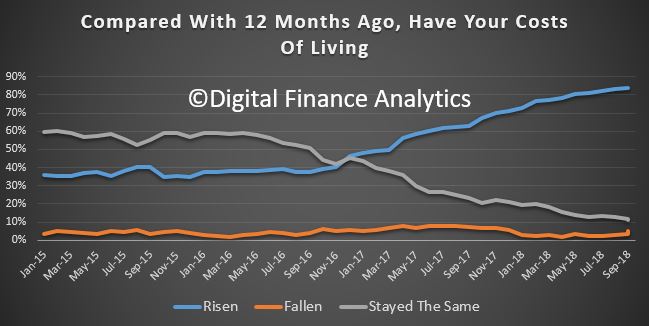
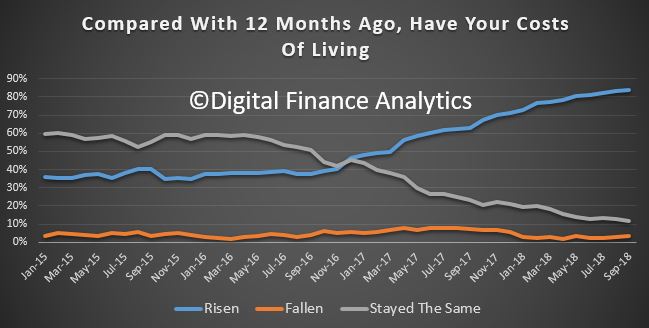
Costs continue to rise, with power prices, healthcare, health insurance, and child care all registering. Plus we are seeing more fallout from the drought which is also impacting some food costs. Nearly 90% of households said their costs are higher than a year ago.
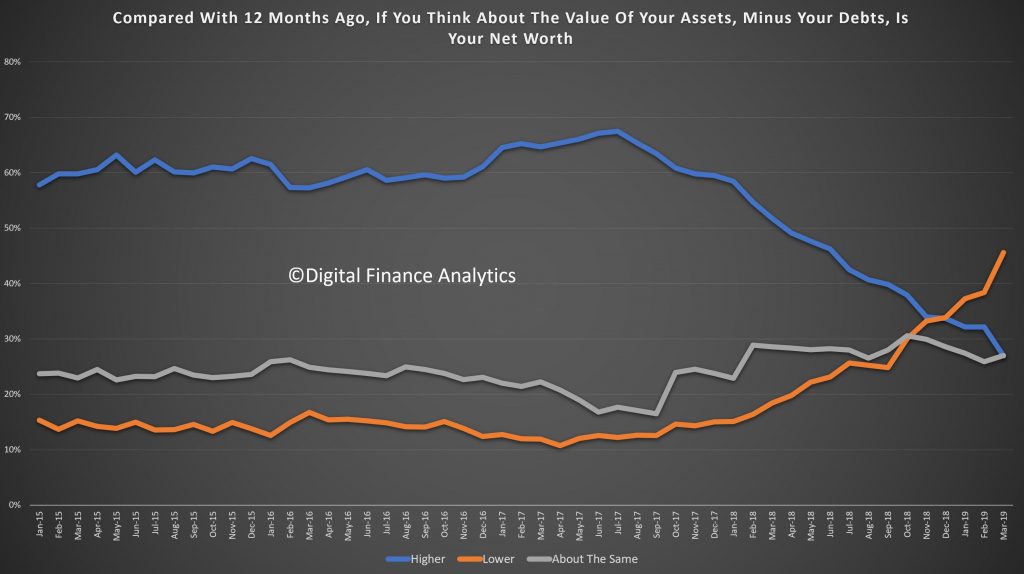
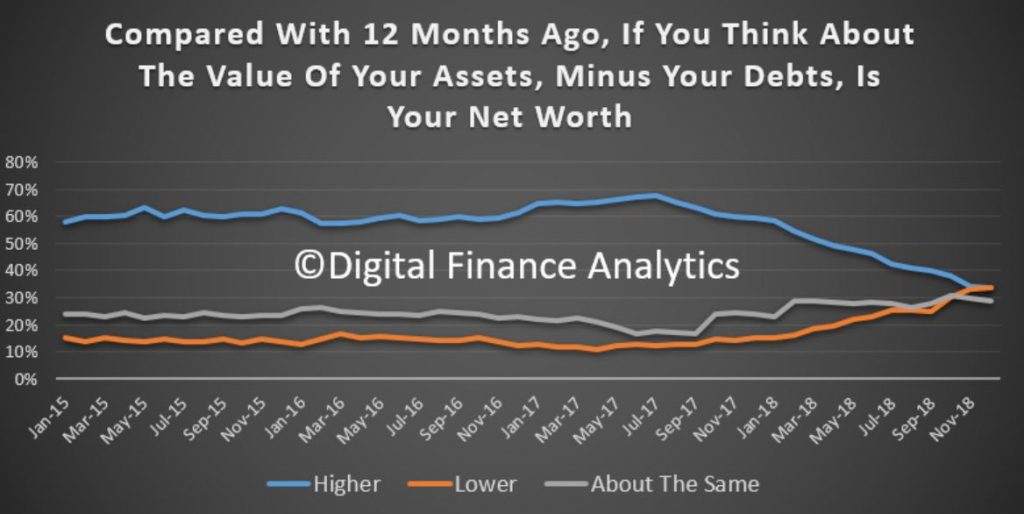
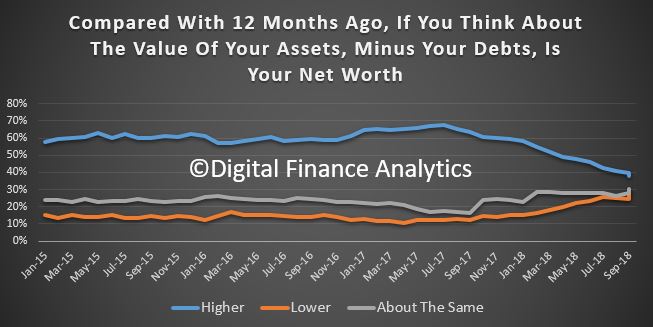
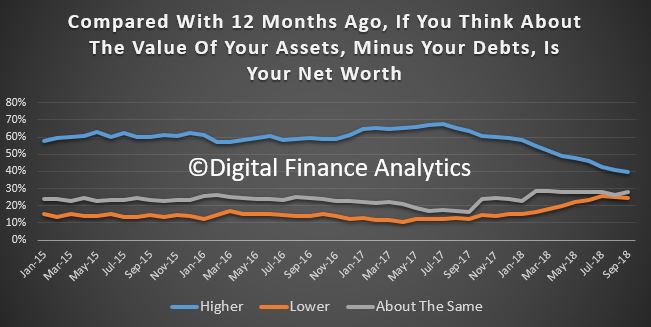
Finally, we put this all together in our assessment of net worth (assets minus loans etc). 45% of households say their net worth is lower, reflecting falls in the property sector, some lower share prices, and diminishing savings. Not a good look in the run up to an election!
There is little evidence of anything which will change the momentum. Rate cuts and handouts to households may provide some short-term relief, but the economic settings are not correct to reverse the trend. So expect more bad news ahead.
The latest from our household surveys reveals a further fall in household confidence, with the data to end February 2019.
The overall index fell to 86.5, the lowest since we have run the series.
The state indices have converged at a level below the neutral setting.
The age groups continue to show younger households are less confident, thanks to low wages growth, high costs and rents or mortgage repayments. Some older groups remain more confident.
Property investors continue to struggle, though owner occupied owners are relatively more confident, even if below the neutral setting.
And all wealth segments are now in negative territory.
We review the moving parts in the index in the video above.
This is starting to look serious as the latest DFA household financial confidence index results for January 2019 reveals a further decline in levels of confidence.
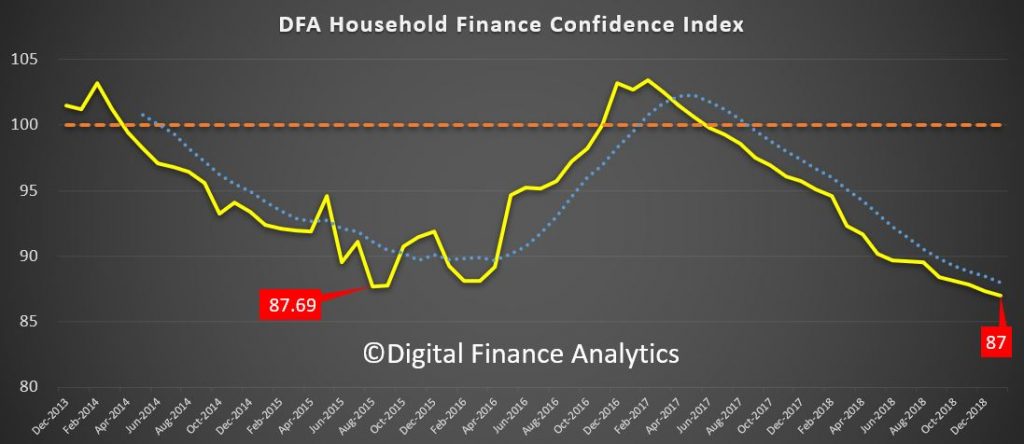
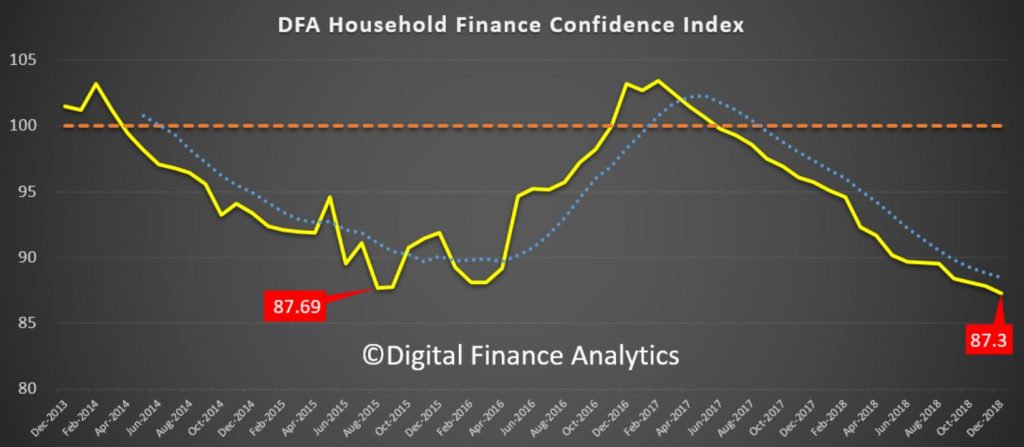
The index fell to 87 in January, down from 87.3 in December, the lowest its been since the survey commenced, well below the neutral setting of 100.
By way of background, these results are derived from our household
surveys, averaged across Australia. We have 52,000 households in our
sample at any one time. We include detailed questions covering various
aspects of a household’s financial footprint. The index measures how
households are feeling about their financial health. To calculate the
index we ask questions which cover a number of different dimensions. We
start by asking households how confident they are feeling about their
job security, whether their real income has risen or fallen in the past
year, their view on their costs of living over the same period, whether
they have increased their loans and other outstanding debts including
credit cards and whether they are saving more than last year. Finally we
ask about their overall change in net worth over the past 12 months –
by net worth we mean net assets less outstanding debts.
Looking at the results by property segments, we see a fall in confidence among property investors, as home prices and rental yields continue to fall, and reflecting concerns about potential changes to negative gearing and capital gains ahead. That said, purchase interest has risen a little. We will discuss this later.
Owner occupied borrowers are also feeling the heat, reflecting some mortgage price pain, as well as the basic affordability issues. Those renting however are a little more positive relatively speaking, thanks to rents being lower now and a greater choice of property for rent being available, especially in Sydney. Overall investors are the least confident now, a considerable switch from a year or so ago!
Cutting the data by states, we see that the bunching continues as property price falls in Sydney and Melbourne erode confidence there, relative to the other states. The most significant fall was in NSW, as home prices fall – and the fall out from Opal Tower had an impact more broadly on new purchases, and off the plan commitments.
Across the age ranges we continue to see weakness, with younger households more exposed, although those older households with share market investments saw a rebound in January, which boosted their confidence a little.
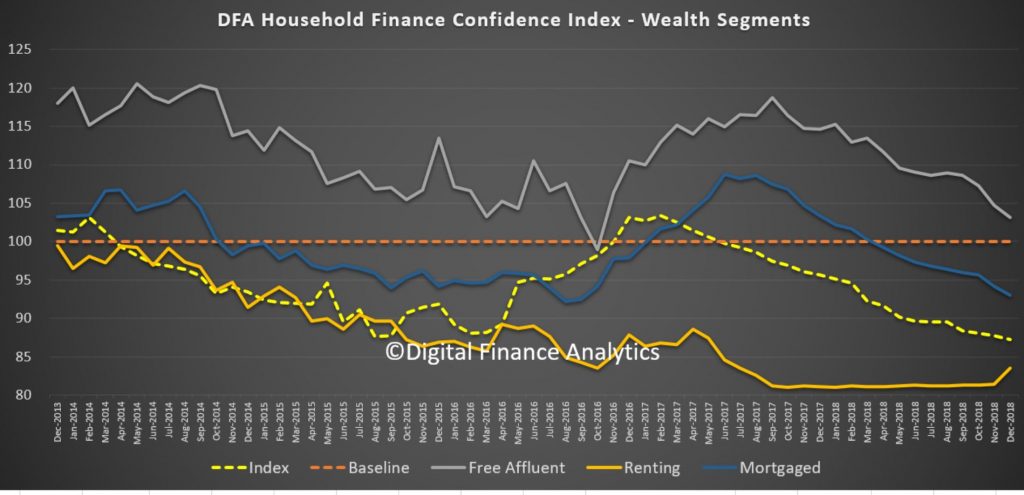
Turning to our wealth segments, we continue to see property owners without a mortgage the most confidence, though falling close to the long term neutral benchmark, while those with mortgages (either investor or owner occupied) continue to decline. Renters remain the least confident. This could become an important indicator in the run up to the next election, in that even those heartland voters supporting the incumbent Government are less positive than usual.
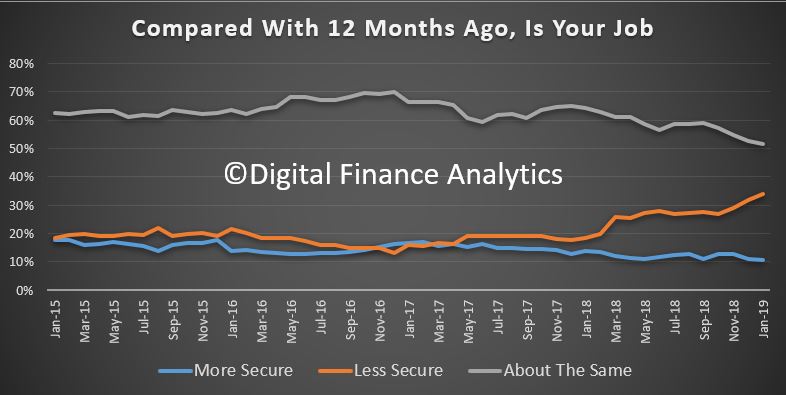
We can then examine the moving parts within the index. We start with job confidence. Those feeling more secure about their job prospects fell 2.19% to 10.57%, while those feeling less confident rose 4.84% to 33.85%. 51.68% saw no change, but that fell by 3.30%. There was a noticeable rise of concerns in the construction sector as building approval momentum falls.
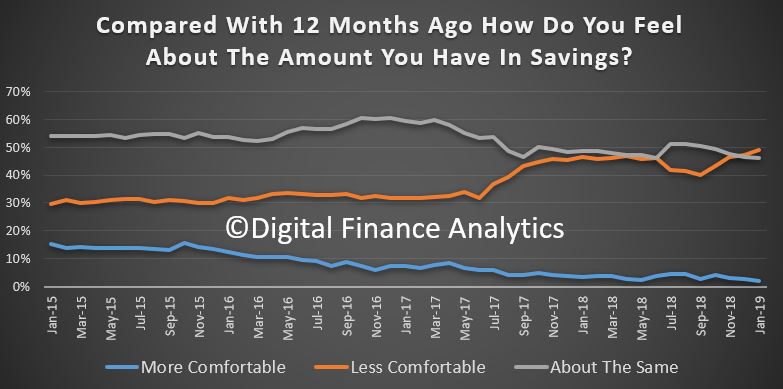
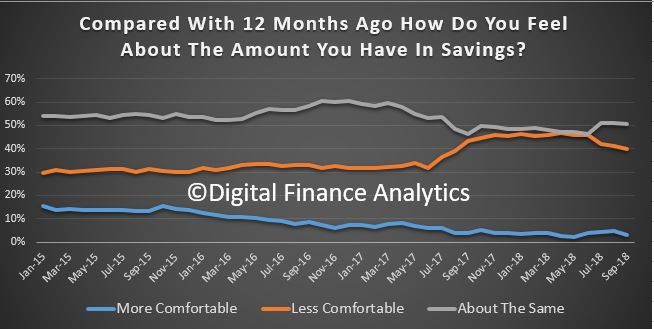
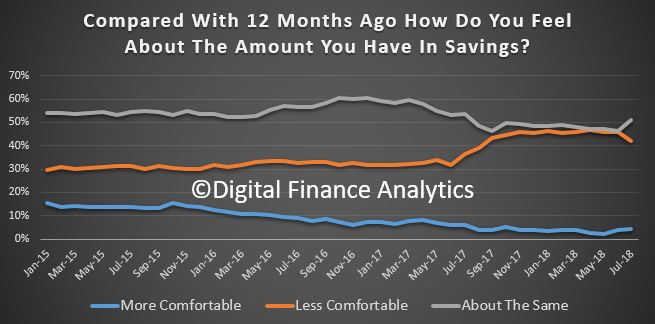
Savings rates continue to fall for many, and others are raiding what savings they have to maintain their lifestyles – something which of course cannot continue indefinably – one reason why the savings ratio continues to fall. June 1.98% of households were more comfortable than a year ago, down 1.28%, while 48.96% were less comfortable, a rise of 2.52%. 46.24% were about the same, down 1.56%.
Turning to debt, 1.11% of households are more comfortable than a year ago, and 52% are about the same. 46% are less comfortable than a year back, thanks to rising rates, switches to interest and principal from interest only loans and problems in servicing the repayments. We also continue to see growth in quasi credit such as Afterpay, as well as other forms of short term credit. Household debt of course continues to rise faster than incomes or inflation.
Income growth remains a real concern for many households (in real terms many have seen falls in recent years). 3.88% of households reported their real incomes had grown in the past year, 51.99% said incomes had fallen in real terms, and 42.5% said there had been no change. We continue to observe pressure on the income side of household balance sheets, despite the RBA’s expectation that wages will rise eventually. One bright spot was dividend payments which were higher, but this failed to offset the total picture.
One of the killer categories is the costs of living. Once again we think the CPI figures just do not reflect the lived experience of many households. 87.75% said their costs had risen over the past year, up 3.2%. This includes the old favorites, electricity, child care, health care, and household staples, despite a fall in costs of fuel at the bowser.
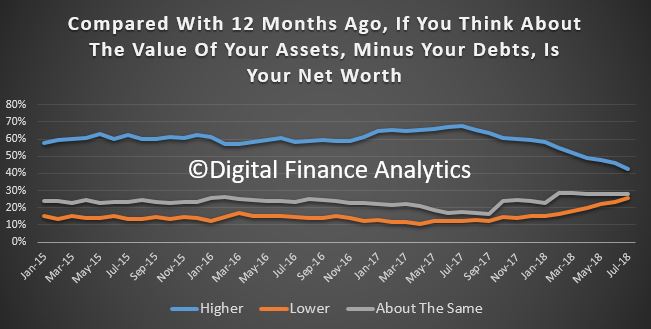
And finally, household net worth continues to take a dive thanks for falling home prices – this despite recent positive share price moves. Overall 32.18% of households sand their net worth had improved, down 1.82% from last month, 37.28% said their net worth had fallen, up 4.05% and 27.42% said there had been no change, down 2.52%.
One other interesting point which came out from the analysis is that potential property investors are more active now, thanks to the falls in asking prices, and importantly, the burning fuse with regards to ending negative gearing should Labor win the next election. Thus we have seen a rise in investors considering transacting. Some lenders are offering “special” fixed rate offers, in the light of APRA’s hands off approach, and of course Hayne did not do anything on responsible lending. The tighter underwriting standards are still in play of course – for now – but I would not bee surprise to see a kick up in new investor lending in the weeks ahead, despite the lower levels of financial confidence.
In summary then, interesting times as household finances are squeezed, yet the fixation on property for many Australians remains strong. There is still a belief that falls will be limited, and they will bounce back. We are not so sure!
Following on from our mortgage stress report for December 2018, which we released yesterday, we complete our monthly data series with the release of the December Household Financial Confidence Index, our gauge of how households are feeling about their financial situation.
The overall index fell again in December to an all-time low of 87.3 (which is strange given the Government’s assertion the economy is in fine fettle!
The DFA index can be segmented a number of different ways, to home in on which households are most concerned about the state of their finances. A significant factor is whether households are property owning, and whether they are mortgaged. Households who hold property, but no mortgage are the most confident and above the 100 neutral setting, although confidence in this group is falling. Those with a mortgage are well below the neutral measure, and confidence for this group continues to fall. Those in the rental sector, or living with friends or family are less confident, though recent wage rises and falling rents have had a slightly positive impact this month.
Within the property holding segment, we can also separate property investors from owner occupied households. Significantly property investors have gone very negative now, thanks to falling property prices, rising mortgage costs and issues with mortgage refinancing. The threats to negative gearing are also in play. Concerns about rising mortgage rates are building (Bank of Queensland moved yesterday!). Owner occupied property holders are more positive, those with mortgages and those mortgage free are both within this segment. Property inactive households – those with no exposure to property – are slightly more confident than property investors.
We can also examine the data across the main states. When we do that we find a “bunching” of scores, as NSW and VIC come off their highs (the main centres in which property prices are falling).
South Australian households have remained more positive, while Victorian households have taken something of a dive -as prices are moving south at a faster clip. And we can also look at the age band data.
Here, younger households remain the least confident, and the general slide continues across the age bands, other than those aged 50-60 – who are less likely to hold mortgages, so more likely to reside in the “Free Affluent” segment.
We can then look at the data drivers for the index.
Job security shows a spike in those feeling less secure, up 3% – and workers in the construction and real estate sectors have become more concerned. There was a fall of 1.7% in those feeling more secure than a year ago, at 11%. 53% of households reported no change than a year ago, down 2%.
Savings are taking a beating, with more households tapping to savings to sustain their budgets, and also being hit by falls in interest rates on deposits and falls/volatility in the share markets. 2% only, are more comfortable than a year ago, 46% less comfortable, and 51% about the same.
Debt remains a major source of concern for many households. Whilst overall personal credit (other than for mortgages) is falling there are credit hot spots where households under pressure are putting more on credit cards, using staged repayment products like Afterpay, or even Payday loans. Many households are finding their large mortgages more difficult to handle (as reflected in our stress reports). Around 1.5% of households are feeling more comfortable than a year ago, 46% less comfortable and 51% about the same.
Household income remains under pressure, with many reporting no increase in real incomes in the past 5 years. Many households are working multiple jobs, and are still underemployed. In addition, the interest on deposits held with the banks have fallen significantly, as they trim their interest rates to protect their margins. 4% said their income in real terms had risen, 53% said it had fallen and 43% said there was no change.
Households reported continued rising living costs in December with and additional 1.5%, or a total of 86% saying costs, in real terms had risen. 5% said they had fallen and 8% said there was no change. As well as the usual suspects – higher electricity costs, health care, child care and some food costs, a number of households reported rises in land tax as a concern. Once again the official CPI seems disconnected from the true experiences of many households, costs continue to rise and fast!
Finally, we look at Net Worth – Assets less loans owning. We see a rise in those reporting a fall, directly associated with the fall in home prices, 34% said their net worth had dropped in the past year, 33% said it had improved, and 29% said it was about the same. So whilst for some the “wealth effect” is intact, one third are feeling the effects of a reduction in wealth on paper, and as a result they are more cautious on their planned spending. This is sufficient to slow consumption ahead, and may well impact GDP as a result.
In summary then, we continue to see the same forces in play, in that as home prices slide and costs rise, household finances are under pressure. But the effects are not uniform, those with mortgages, and younger are most impacted. But the recent stock market ructions and lower returns on deposits are also biting.
By way of background, these results are derived from our household
surveys, averaged across Australia. We have 52,000 households in our
sample at any one time. We include detailed questions covering various
aspects of a household’s financial footprint. The index measures how
households are feeling about their financial health. To calculate the
index we ask questions which cover a number of different dimensions. We
start by asking households how confident they are feeling about their
job security, whether their real income has risen or fallen in the past
year, their view on their costs of living over the same period, whether
they have increased their loans and other outstanding debts including
credit cards and whether they are saving more than last year. Finally we
ask about their overall change in net worth over the past 12 months –
by net worth we mean net assets less outstanding debts.
DFA has released the final dimension from our household surveys to end November 2018, zeroing in on financial confidence. As is perhaps predicable, the overall index fell again, down to 87.8, well below the neutral setting, and close to the record low we measured in 2015.
Property owning household segments continue to react to the changed environment, as prices weaken, and mortgage availability tightens. Around half of all mortgage applications are being rejected due to the tighter conditions. Property investors are now very concerned about their financial status, and owner occupied households confidence continues to drift lower. That said, those not owning property – who are renting or living with family or fields are still even less confident so it is still true that property ownership bolsters financial confidence.
One way to understand the confidence dynamic is to look at households in terms of their mortgage commitments. Property owing households without a mortgage – about one third of all households – remain more positive than those with a mortgage and those renting. These more confident households are more affluent, often with market investments, and multiple income sources. Nevertheless, even these households are becoming more disenchanted with the state of things.
Across the states (we select the most populated in this analysis), we see a bunching of confidence scores with Victoria slipping towards Western Australia and Queensland, although New South Wales continues to slide a little too. South Australian households are sitting between New South Wales and Victorian households in terms of average confidence.
The age bands continue to show significant separation, with younger households more concerned (thanks to costs of living and large mortgages) relative to older households, many of who have smaller mortgages or no mortgages and larger asset bases. That said, those moving into retirement are less confident compared with those who are still working.
We can then dive into the elements which drive the survey. Looking at job security first, there was a 2% rise in those feeling less secure about their employment prospects, to 29%, and an offsetting fall of 2% in those who are felling about the same as a year ago at 55%. We continue to see many households employed in multiple part-time jobs to maintain income, and many are still seeing more employable hours, suggesting that underemployment remains a considerable issue. We also noted that significant numbers of workers were being “encouraged” to extend their leave over the upcoming holiday period.
Turning to income, 2.87% reported a rise in real incomes in the past year (allowing for inflation) a fall of 0.81% on last month. There was a small rise in those saying their incomes had not changed in real terms at 42% but 53% said their incomes have fallen in the past year.
Living costs are still rising for many. Once again electricity costs, health care costs, child care costs and food costs all registered. 85% of households say their costs have rise, 9% said there has been no change and and 5% said their costs have fallen. There was small relief from lower petrol prices.
Given the high debt levels which exist in Australia (thanks to poor policy settings and lax lending standards), many households are concerned about their current debt levels. Just 1% were more comfortable than a year ago, and this was often associated with those who sold property and paid down their mortgages. 51% were as comfortable as a year ago, and 46% were more concerned, up 0.76% in the month. We continue to see debt levels rising among those with mortgages as they try to balance their finances, and turn to short term solutions, such as credit cards, personal loans, or installment payment options. Whilst overall levels of personal debt other than mortgages are falling, there is a concentration among those with property loans.
Savings are taking a beating at the moment, firstly because many are raiding savings to maintain lifestyle (which explains the falling savings ratio) and they are also receiving significantly less on deposits at the bank as financial institutions seek to recover margin in the higher cost environment. The fact is, it is the soft underbelly of savers who are taking the brunt of the pain, yet many are very reliant on bank deposits for income, and the media hardly ever focuses on this significant group. All the attention is on the mortgage rate. Banks are in my view taking advantage of this, and it is the easy way out to protect their margins. 46% of households are less comfortable than a year ago, up 3%, and just 3% are more comfortable, down 0.8% on last month.
So putting all this together, net worth is under pressure for many households. 34% of households said their net worth had improved in the past 12 months down 4% on last month, while 33% said their net worth had fallen, up 3% on the previous month. Falls in home prices, share prices and other investments all hit home. This underscore the fading “wealth effect” we are seeing as more react to this new environment.
We also observed one other significant fact. Despite the tighter conditions, and falling confidence, most households say they will still spend over the Christmas season, and will simply pick up the bill in the new year. This may be good news for retailers, but bad news for households down the track.
Slow wages growth, falling home prices and rising costs are combining
to drag wealth and household confidence lower, and there is no end in
sight. Another reason why we think the RBA will not be lifting the cash
rate any time soon.
By way of background, these results are derived from our household
surveys, averaged across Australia. We have 52,000 households in our
sample at any one time. We include detailed questions covering various
aspects of a household’s financial footprint. The index measures how
households are feeling about their financial health. To calculate the
index we ask questions which cover a number of different dimensions. We
start by asking households how confident they are feeling about their
job security, whether their real income has risen or fallen in the past
year, their view on their costs of living over the same period, whether
they have increased their loans and other outstanding debts including
credit cards and whether they are saving more than last year. Finally we
ask about their overall change in net worth over the past 12 months –
by net worth we mean net assets less outstanding debts.
Welcome to the Property Imperative weekly to 17th November 2018, our digest of the latest finance and property news with a distinctively Australian flavour.
Watch the video, listen to the podcast or read the transcript.
It has been a roller coaster ride on all fronts this week, with more market gyrations, larger predicted falls in home prices locally, and the first “unnatural act” from the Government to try and sustain the finance sector, ahead of next year’s election, expect more ahead.
And by the way you value the content we produce please do consider joining our Patreon programme, where you can support our ability to continue to make great content.
We start with the markets this week the Dow closed lower for the week, despite a rally on Friday that came despite the White House reportedly walked backed President Donald Trump’s upbeat comments on trade.
The Dow Jones Industrial Average rose 0.49% to 25,413 at the end of the week, the S&P 500 rose 0.22% to 2,736, but the Nasdaq Composite fell 0.15%.
After the falls earlier in the week, Wall Street went into rally mode Friday after Trump said he was hopeful the U.S. and China will reach a consensus on trade deal. Later the White House, however, peddled a more sombre narrative on trade in the wake of Trump’s comments, telling CNBC that a deal was not coming soon. Still, the broader averages held their gains, but that did little to avert a weekly loss following a rout in tech. The fear index, the VIX eased a little on Friday, down 9.21% to 18.14, but is still elevated, signalling uncertainty ahead.
In tech, Facebook fell 3% amid the fallout from a New York Times article detailing how the company conspired to cover up warnings that Russia had used the social media platform to disrupt the U.S. election in 2016. Apple moved higher after recent falls, up 1.11% to 193.53, while Alphabet fell 0.26% to 1,068. Intel was up 1.5% to 48.53.
Financials were mixed, with the S&P 500 Financials index up 0.06% on Friday to 443.45 but Goldman Sachs Group was down 0.8% to 202.12.
Sentiment on stocks were also lifted by easing concerns about steeper U.S. rate increases after Federal Reserve Vice Chairman Richard Clarida indicated that the U.S. central bank may stop at the neutral rate, rather than continue hiking beyond the neutral rate, which might be interpreted as an effective “rate cut,” JPMorgan said in a note to clients. The 3m bond rate slid 0.67% to 2.35, and the 10-year was 1.71% down on Friday to 3.065. Clarida does not expect a big increase in inflation this year. With that in mind, both central bankers are still confident enough in the domestic economy to proceed with a December rate hike, but there’s a good chance that it will be accompanied by a less hawkish outlook.
Energy added steel to the rally on Friday as oil prices settled flat, but slumped 6% for the week on concerns about a global glut in supplies. The WTI futures was up 0.66% to 56.83. Oil bears are back to taunting Saudi Arabia by pressuring the market again, just two days after giving a reprieve to the record sell off in crude.
In fact, West Texas Intermediate and Brent crude futures settled steady to slightly higher on Friday after rallying more than 2% earlier in the day on fears that the oil-rich kingdom and the OPEC cartel it leads could cut supplies substantially at a December 6-7 meeting. Friday’s s rebound didn’t help crude’s weekly loss of 6%, making it the sixth-straight week in the red.
Prices initially rose on an analysis from tanker-tracking firm ClipperData that showed Saudi Arabia was already loading fewer barrels on ships bound for the United States this month, continuing a trend that began in September. By sending fewer barrels to the United States, the Saudis hope to starve U.S. crude stockpiles, which have swelled by nearly 50 million barrels the past eight weeks. It’s a strategy the kingdom used last year while working alongside OPEC members, Russia and other producers to rescue oil prices from lows under $50 a barrel. But after the morning highs in New York trade, prices turned volatile before returning to positive territory just before the close. Adding pressure to the market was weekly U.S. oil rig data showing drilling activity at its highest in over three years, after an addition of two rigs this week.
In an extreme turn of events, the fire from Bitcoin Cash’s hardfork war has spread wildly across the entire crypto market, burning through virtually every cryptocurrency and leaving many investors burnt too. Bitcoin had more than $28 billion stripped from the market, as it fell beyond the support of its long-standing safety net at $5,800.
Gold was higher, up 1.9% to 1,222 on Friday, with some suggesting that the US$ bull run might be ending, as economic outperformance, rising interest rates, equity market pressure and trade policy all look suspect, and a switch to metals might make sense. But more likely it is the risks around Brexit, Theresa May could be fighting for her political survival, but the Brexit crisis she’s in has thrown gold bulls a lifeline. Initially resigned to losing the market’s $1,200 support level as the week began, fans of the yellow metal not only got to stay in their comfort zone but also saw their best weekly gain in five as hedgers rushed to the relative safely of bullion after the pounding taken by sterling from Britain’s EU-exit woes. Tory MPs may have enough votes – 48 are needed – for a letter of no confidence that would force a vote in Parliament. If the rebels within her ranks really do have the votes to force a no-confidence motion UK politics will be thrown into an even greater existential crisis.
Not that a change in leadership there would make much difference. U.K. Prime May on Friday reshuffled her minister team and took personal charge of the divorce talks with the European Union. The moves came at the end of an extraordinary week in which seven members of her government resigned and a push to force her from power gained momentum.
The pound gained 0.4% against the U.S. dollar on Friday, rebounding a bit from Thursday’s plunge. But sterling still suffered a loss for the week and volatility soared to a two-year high. The British Pound Dollar was up 0.48% on Friday to 1.2835, while the Euro USD rose 0.76% to 1.1414. The US Dollar index fell 0.51% to 96.43. Deutsche Bank, was down 0.06% to 8.59, not helped by recent Eurozone bank stress test results.
All 3 of the commodity currencies traded higher on Friday with the Australian hitting a 2-month high and the New Zealand dollar hitting a 4-month high. AUD and NZD ripped higher on the hope that President Trump will forgo another round of tariffs on China. Ever since the mid-term elections, his tone toward China has been softening. The Aussie ended up 0.76% to 73.32, helped by strong jobs numbers in October and bullish noises from both the treasurer and the RBA.
In the local market, the ASX 100 fell 0.17% to 4,711, reflecting similar weakness in US stocks. The ASX Financials was also down, 0.09% to 5,635.60 in bearish territory. Regional Bendigo bank was up 0.99% to 10.20, while Suncorp fell 0.15% to 13.54 and the Bank of Queensland was higher up 0.82% to 9.78. Macquarie who generates more than half of its business offshore, rose 0.16% to 119.00 whilst the majors were softer, with NAB down 0.46% to 23.77, Westpac down 0.28% to 25.27, then went ex. Dividend this week, ANZ was down 0.12% on Friday to 25.36 while CBA was up a tad to 68.90. Lenders Mortgage Insurer Genworth tracked lower down 0.91% to 2.18, not least because they are exposed to the housing sector and the investment markets, both of which look weaker. AMP continues in weak territory, although up 1.98% to 2.58. The Australian VIX index eased back, down 3.33% to 16.80, still will in the nervous zone. The Aussie Bitcoin dropped 2.76% to 7,492 and the Aussie Gold slid 0.06% to 1,666.43.
The property news continues south, with the latest CoreLogic average clearance rate down again last week, with only 42.7 per cent of homes successful at auction. And that excludes the large number of unreported results, so the true numbers in even worse. There were 1,541 auctions held across the combined capital cities, having decreased from the 2,928 auctions held over the week prior when a higher 47 per cent cleared. Both volumes and clearance rates continue to track lower each week when compared to the same period last year (2,046 auctions, 61.5 per cent).
In Melbourne, final results saw the clearance rate fall last week, with 45.7 per cent of the 266 auctions successful, down from the 48.6 per cent across a significantly higher 1,709 auctions over the week prior. Across Sydney, the final auction clearance rate came in at 42.6 per cent across a slightly higher volume of auctions week-on-week, with 813 held, up from 798 the previous week when 45.3 per cent cleared. Sydney’s final clearance rate last week was not only the lowest seen this year, but the lowest the city has seen since December 2008.
The only capital city to see more than 50 per cent of auctions successful last week was Adelaide (50.8 per cent), however this was lower than the prior week’s 57.6 per cent. Brisbane saw the lowest clearance rate, with only 30 per cent of homes selling.
Geelong recorded the highest clearance rate of all the non-capital city regions, with 57.1 per cent of auctions reporting as successful, while the Sunshine Coast region had the highest volume of auctions (55).
CoreLogic are expecting more auctions today, so we will see if this eventuate.
I discussed the latest household data at a UBS forum on Monday, other members of the Panel were included Tim Lawless from CoreLogic and Christopher Joye Coolabah Capital as well as Jon Mott Head of Banks at UBS and George Tharenou their Chief economist. You can watch my segment of the discussion “Some Thoughts About The Housing Market” via a scratch recording I made. Frankly demand for property continues to weaken, as supply rises, and sales volumes fall. First time buyers and investors are becoming more cautious. Jon Mott has been negative on the sector for some time and his new note proposes a worst case scenario in which Aussie house prices crash 30%, the RBA cuts rate to zero and launches quantitative easing, and banks are crushed by cascading bad debts, cut dividends and class actions. Smartly he has developed a range of different scenarios (scenarios will sound familiar to anyone following DFA, as we have been doing this for years, it’s the best way to communicate the intrinsic uncertainty in the system.
He thinks that his scenario 3 – housing correction is most likely, with a 10% drop in prices, and that the banks will be challenged in this environment. But if prices fall further, the banks get hit with class actions, and bad debts they will have to cut dividends.
SQM’s Louis Christopher also issued their latest Boom-to-Bust report, and guess what, he also used scenarios. SQM’s base case forecast is for dwelling prices to fall between -6% to -3%, which is a continuation of the current falls of 4.5% over the past 12 months. Sydney and Melbourne will drive the falls. Other cities will record mixed results with Hobart expected to have a third year of strong price rises of 5% to 9%. The base case forecasts assume no changes in interest rates, a Labor win at the next Federal Election with Negative Gearing repeal and CGT changes coming into effect 1 July 2020. If SQM Research is correct on the Sydney and Melbourne forecasts, it will mean by the end of 2019, the peak to trough declines will be at least in the order of 12% to 17% for these two cities. SQM Research believes that, presuming the RBA does not intervene in the market, 2020 could also record price declines due in part to the repeal of Negative Gearing which is a firmly stated Labor party objective. As such there is a risk that the total peak to trough declines could be in the order of 20% to 30% for our two largest capital cities. The range is dependent on: When, if and how the RBA responds to the downturn; How the economy responds to the downturn; Will the banks be required to lift rates out of cycle; Will negative gearing and capital gains tax concessions be repealed as per the Labor Party’s policy. Christopher said, “If the RBA does not respond and/or the bank lift interest rates again in 2019, it is possible the peak to trough falls in Sydney and Melbourne could be even more than this negative range. But we do take the view that the downturn in Sydney and Melbourne will be a significant negative for the overall economy, and so the central bank will eventually respond at some point and cut interest rates.”
Gareth Aird the senior economist at CBA discussed the drivers of dwelling prices, and identified four leading indicators that capture the momentum in the property market well. They are: (i) the flow of credit (i.e. housing finance); (ii) auction clearance rates; (iii) foreign residential demand; and (iv) the house price expectations index from the WBC/MI Consumer Sentiment survey. Presently all of these indicators are pointing to dwelling prices continuing to deflate over the near term (up to six months).
Indeed, credit and prices are strongly correlated, as we have discussed before. From a dwelling price perspective, the flow of credit matters more than changes in the stock. The annual change in housing finance has a close leading relationship with the annual change in dwelling prices by around six months. New lending is driven by the supply and demand for credit. The latest housing finance data indicates that the flow of housing credit continues to fall. And the pace of the decline has accelerated (chart 3). Credit to investors has been trending down for the past 1½ years. But it’s the shift downwards in lending to owner-occupiers that is behind the recent acceleration in the decline of credit.
Generally, auction clearance rates are a leading indicator of prices. Auction clearance rates tend to lead prices on average by two months. Auctions are more popular in Sydney and Melbourne as a means of selling a property. As such, the link between auction clearance rates and property prices is very much a Sydney and Melbourne story. As a rough rule of thumb, the annual change in dwelling prices tends to be negative when the auction clearance rate is below 55%.
Over the past two years, foreign investment in Australian property has waned. This is primarily due to a lift in state government stamp duties levied to foreign investors as well as tighter capital controls out of China. There is a decent relationship between the annual change in property prices against the share of sales going to foreign investors. Generally foreign purchases have led prices on average by around four months, although that lead time has shrunk more recently.
And finally on consumer sentiment, Aird says it has proved a very useful near term indicator of the annual change in dwelling prices. There is of course a self-fulfilling aspect at work. If households expect prices to weaken then demand for credit will fall and prices will correct lower. The reverse is also true when households expect price growth to accelerate. The WBC/MI house price expectations index is pointing to dwelling prices continuing to deflate over the near term.
He also again illustrated the fall in investor borrowing, the shift away from interest only loans, and a significant decrease in the maximum loan sizes now on offer – on average down 20%, though we think for some households the fall is significantly larger. He also showed some households were now paying higher rates, thanks to larger spreads over the P&I loan benchmark.
The trend unemployment moved a little lower according to the data from the ABS, from 5.2 per cent to 5.1 per cent in the month of October 2018. This is the lowest unemployment rate since early 2012 and the 25th consecutive monthly increase in employed full-time persons with an average increase of 20,300 employed per month. The trend underutilisation rate decreased 0.1 percentage points to 13.4 per cent and the trend participation rate remained steady at 65.6 per cent in October 2018.
But wages growth remains sluggish with the seasonally adjusted Wage Price Index (WPI) up 0.6 per cent in September quarter 2018 and 2.3 per cent through the year. The more reliable trend was 0.5% in the September quarter. Private sector wages grew by 0.55% over the quarter, whereas public sector wages grew by 0.61%. So Public Sector wages are growing more strongly, whilst the private sector continues to struggle. The weak wages growth will dent the budget projections and household budgets. Western Australia recorded the lowest through the year wage growth of 1.8 per cent while Tasmania recorded the highest of 2.6 per cent.
So no surprise that our household financial confidence index was lower in October The index measures households overall comfort level with their finances across a number of key dimensions. Recent home price trends, lower returns on deposits and share market gyrations have combined to take the index lower, despite strong employment trends. The wealth effect is now working in reverse, with a potential impact on future consumption. The index returned a result of 88.1, down from 88.4 last month. This continues the decline since late 2016, and is now approaching the lowest ratings from 2015. The convergence across the states continue as home price falls in NSW and VIC take a toll, with the southern state showing a significant slide. WA and QLD appear to be tracking quite closely. Across the age bands, younger households are under the most pressure (thanks to large mortgages, or renting) while those aged 50-60 years remain the most confident, thanks to lower net borrowing, and more savings and investments. For those aged 40-50 recent falls in property prices swamp any benefit from stock market performance. Those holding property for owner occupation remain the most positive, despite falls in paper values of their homes, but property investors are now registering significant concerns, thanks to flat or falling net income from rentals, falling capital values and concerns about the future of negative gearing and capital gains tax relief. More property investors signalled an intention to seek to sell property, as the switch from interest only to principal and interest loans continues. More than 41% of mortgage applications were rejected, compared with 5% last year, as more rigorous underwriting standards bare down. In fact those renting are in many cases more confident than property investors, significant turnaround. The great property investor decade in passing. You can watch our show “Household Financial Confidence Is In The Gutter”.
The use of the Household Expenditure Measure HEM may well be back in play, following the latest from the Westpac ASIC case. Given that at some banks HEM is still being used for around half of applications, and the Royal Commission commented specifically in the use of HEM, perhaps the law needs to be changed. The core of the argument is whether the loans were unsuitable, and that it seems would depend of the ultimate progress of the loan subsequently. In other words, it cannot be proved to be unsuitable until it falls over. ASIC would need to prove the loan was unsuitable! Actually we think the law says lenders have to verify expenses, and in other cases, for example in pay day lending specific inquiries are required as part of the assessment. But it’s as clear as mud at the moment! When is unsuitable lending to be demonstrated? This will have a significant impact on any potential class actions. And of course next week the Royal Commission start they next round, with senior bank executives and regulators on the stand. This should at very least be entertaining, and will perhaps get to the heart of the cultural issues in banking and finance. In this regard you should watch our recent show with John Dahlsen, business man and ex. ANZ Director, who has some important things to say about what has driven the poor outcomes from the sector and what needs to change. It’s a long piece, but highly relevant – “Thinking About Banking From The Inside”.
But for now, banks want more data on expenses, and the latest was ANZ who outlined new tighter rules from 20th November, where mortgage applicants will need to provide much more evidence, and history on income and expenditure. Any income from bonuses will be ignored and income shaded to 80% and evidence of continuous employment is needed. As well as more granularity and evidence on expenditure, they also will want more detail on potential changes to personal circumstances.
And finally, this week we saw the first “unnatural act” from the Government to support the banking sector, in an attempt to alleviate the home price falls and lending freeze ahead of the election next year. The proposed $2 billion funding pool is small beer in the estimated $300 billion SME lending sector. There is precedent a decade ago when the government’s $15 billion co-investment with the private sector into the residential mortgage-backed securities market during the GFC. So the federal government announced a new, $2 billion Australian Business Securitisation Fund to help provide additional funding to small business lenders. But this is lipstick on a pig in my view, and does not get to the heart of the matter at all. But I expect more such measures in the run up to the next election.
And if you want to understand what is ahead, then watch my recent interview with Harry Dent, as we discuss the limitations of central banks, and how QE has really created a monster which is still running rampant. And we are also extending our reach into the New Zealand market with the help of Joe Wilkes, see our latest Ireland V New Zealand – A Passion For Rugby & Property.
But to sum up the state of play, the Bears are indeed in town, and we should prepare ourselves for more falls ahead. Our scenarios continue to play out as expected.
Finally, a quick reminder, our next live Q&A session is now scheduled for November 20th at 8 pm Sydney time. You can schedule a reminder by using the YouTube Link and join in the live discussion, or send in questions beforehand. If previous sessions are any guide, it should be a lively event!
The results from the DFA household surveys to the end of October 2018 are out today. The index measures households overall comfort level with their finances across a number of key dimensions. Recent home price trends, lower returns on deposits and share market gyrations have combined to take the index lower, despite strong employment trends. The wealth effect is now working in reverse, with a potential impact on future consumption.
The index returned a result of 88.1, down from 88.4 last month. This continues the decline since late 2016, and is now approaching the lowest ratings from 2015.
The convergence across the states continue as home price falls in NSW and VIC take a toll, with the southern state showing a significant slide. WA and QLD appear to be tracking quite closely.
Across the age bands, younger households are under the most pressure (thanks to large mortgages, or renting) while those aged 50-60 years remain the most confident, thanks to lower net borrowing, and more savings and investments. For those aged 40-50 recent falls in property prices swamp any benefit from stock market performance.
Those holding property for owner occupation remain the most positive, despite falls in paper values of their homes, but property investors are now registering significant concerns, thanks to flat or falling net income from rentals, falling capital values and concerns about the future of negative gearing and capital gains tax relief. More property investors signalled an intention to seek to sell property, as the switch from interest only to principal and interest loans continues. More than 41% of mortgage applications were rejected, compared with 5% last year, as more rigorous underwriting standards bare down. In fact those renting are in many cases more confident than property investors, significant turn around. The great property investor decade in passing.
Turning to the moving parts within the index, there was a small fall in those feeling more insecure about their job prospects, down 0.71% to 26.99%. There was a rise of 1.53% in those feeling more secure to 12.68%, and as a result those saying there was no change dropped a little, down 1.91% to 57.14%. We continue to see the spread of more precarious employment, including gig economy jobs, zero hours contracts, and growth in low paid ancillary healthcare jobs. We also saw a significant fall in employment in the finance, construction and real estate sectors, as the property sector eases.
Savings have been hit by recent stock market ructions, plus lower deposit rates on call accounts. As a result, there was a 3.38% rise in those less comfortable with their savings, to 43.39%. 49.28% said there was no change.
On debt, 45.47% of households were more concerned about their debt holdings, up 3.48%, thanks to some higher interest rates, rejected loan applications, and falling property values eating into equity, so reducing loan to value ratios. That said, those seeing no change stood at 51.87%, so more than half of households do not see any significant change.
Looking at household cash flow, income growth remains anemic in real terms. Just 3.69% said they had real income growth in the past year, up 1.32%, partly thanks to recent wage awards. However, 53.71% said their incomes had fallen over the same period, up 4.01%, and 41.33% said there was no change. Those in the public sector (especially in Canberra) appear to be fairing the best.
On the costs side of the equation, recent oil price falls have yet to translate into the results, so households said that overwhelmingly their costs of living has risen in the past year – at 83.66%. 4.88% said their costs had fallen, up 1.50% and 11.33% said there was no change. We see find households discussing power bills, fuel, health care costs and child care expenses, but they also highlighted recent rises in some food staples and council charges.
So finally, we can look at net worth (assets minus debts). Around 30% of households reported no change compared with a year ago, but 30.6% reported a net fall, up 5.27% and directly associated with the fall in property values and share values. 37.92% said their net worth was higher, down 1.89% from last month. So the fall in values is now hitting home, and as a result more households are experiencing a negative wealth effect.
This may well be deadly to household consumption (the engine of growth from the RBA’s perspective). This all goes to show that tracking employment growth as a leading indicator of the economy is not telling the whole story.
Slow wages growth, falling home prices and rising costs are combining to drag wealth and household confidence lower, and there is no end in sight. Another reason why we think the RBA will not be lifting the cash rate any time soon.
By way of background, these results are derived from our household surveys, averaged across Australia. We have 52,000 households in our sample at any one time. We include detailed questions covering various aspects of a household’s financial footprint. The index measures how households are feeling about their financial health. To calculate the index we ask questions which cover a number of different dimensions. We start by asking households how confident they are feeling about their job security, whether their real income has risen or fallen in the past year, their view on their costs of living over the same period, whether they have increased their loans and other outstanding debts including credit cards and whether they are saving more than last year. Finally we ask about their overall change in net worth over the past 12 months – by net worth we mean net assets less outstanding debts.
Welcome to the Property Imperative weekly to 13th October 2018, our digest of the latest finance and property news with a distinctively Australian flavour.
This week saw major ructions on the financial markets, which may be just a short-term issue, or a signal of more disruption ahead. And locally, the latest data reveals a slowing of lending to first time buyers and owner occupied borrowers, suggesting more home price weakness ahead. So let’s get stuck in.
Watch the video, listen to the podcast, or read the transcript.
And by the way you value the content we produce please do consider joining our Patreon programme, where you can support our ability to continue to make great content.
Let’s look at property first.
The IMF’s latest Global Financial Stability Report (FSR) says Australia is one of a number of advanced economies where rising home prices are a risk. “household leverage stands out as a key area of concern, with the ratio of household debt to GDP on an upward trajectory in a number of countries, especially those that have experienced increases in house prices (notably, Australia, Canada, and the Nordic countries). Housing market valuations are relatively high in several advanced economies. Valuations based on the price-to-income and price-to-rent ratios, as well as mortgage costs, have been on the upswing over the past six years across major advanced economies, with valuations relatively high in Australia, Canada, and the Nordic countries.
And they also warn that the effect of monetary policy tightening (lifting interest rates to more normal levels) – could reveal financial vulnerabilities. Indeed, it’s worth looking at expected central bank policy rates globally. Bloomberg has mapped the relative likelihood of increases and decreases across a number of major economies, and most advanced economies are on their way up. Worth thinking about when we look at the long term home prices trends across the globe. Guess where Australia sits? High debt, in a rising interest rate environment is not a good look, so expect more stress in the system.
Yet the latest RBA Financial Stability review, out last Friday seems, well, in a different world. They go out of their way to downplay the risks in the system, and claim that households are doing just fine, based on analysis driven by the rather old HILDA data – again.
But back in the real world, Corelogic’s auction results for last week returned an aggregated clearance rate of 49.5% an improvement on the week prior at 45.8 per cent of homes sold, which was the lowest weighted average result since 42 per cent in June 2012. There was a significantly higher volume of auctions with 1,817 held, rising from the 895 over the week prior.
Melbourne’s final clearance rate fell last week, to 51.8 per cent the lowest seen since 50.6 per cent in December 2012. There were 904 homes taken to auction across the city. Compared to one year ago, the Melbourne auction market was performing very differently, with both volumes and clearance rates significantly higher over the same week (1,119 auctions, 70.3 per cent).
Sydney’s final auction clearance rate increased last week, with 46.1 per cent of the 611 auctions held clearing, up from the 43.8 per cent the week prior when a similar volume of auctions was held. One year ago, Sydney’s clearance rate was 61.3 per cent across 818 auctions.
Across the smaller auction markets, Canberra returned the strongest final clearance rate of 64.6 per cent last week, followed by Adelaide where 62.3 per cent of homes sold, while only 11.1 per cent of Perth homes sold last week.
Looking at the non-capital city regions, the Geelong region was the most successful in terms of clearance rates with 48.5 per cent of the 41 auctions recording a successful result.
This week, CoreLogic is tracking 1,725 auctions across the combined capital cities, which is slightly lower than last week. Compared to one year ago, volumes are down over 30 per cent (2,525).
They also highlighted the growing settlement risk relating to off the plan high-rise sales. Prospective buyers may sign a contract to purchase from the plan, but when the unit is ready – perhaps a year or two later, a bank mortgage valuation may not cover the purchase price. Meaning the buyer may be unable to complete the transaction. CoreLogic says that in Sydney, 30% of off-the-plan unit valuations were lower than the contract price at the time of settlement in September, double the percentage from a year ago. In Melbourne, 28% of off-the-plan unit settlements received a valuation lower than the contract price. In Brisbane, where unit values remain 10.5% below their 2008 peak, the proportion was substantially higher, at 48%. And they also argue that loss making resales are rising, especially in the unit sector, although it does vary by location.
The latest housing finance figures from the ABS showed that lending flows for owner occupied buyers appear to be following the lead from the investment sector. Both were down. This is consistent with our household surveys. Looking at the original first time buyer data, the number of new loans fell from 9,614 in July to 9,534 in August, a fall by 80, or 0.8%. As a proportion of all loans written in the month, the share by first time buyers fell from 18% to 17.8%.
Looking at the trend lending flows, the only segment of the market which was higher was a small rise in refinanced owner occupied loans. These existing loans accounted for 20.5% of all loans written, up from 20.3%, and we see a rising trend since June 2017, from a low of 17.9%. Total lending was $6.3 billion dollars, up $31 million from last month. Investment loan flows fell 1.2% from last month accounting for $10 billion, down 120 million. Owner occupied loans fell 0.6% in trend terms, down $81 million to $14.5 billion. 41% of loans, excluding refinanced loans were for investment purposes, the lowest for year, from a high of 53% in January 2015.
On these trends, remembering that credit growth begats home price growth, the reverse is also true. Prices will fall further, the question remains how fast and how far? We will be revising our scenarios shortly.
The latest weekly indices from CoreLogic shows price falls in Sydney, down 0.16%, Melbourne down 0.18%, Brisbane down 0.08%, Adelaide down 0.09% and Perth down 0.38% giving a 5 cities average of down 0.18%.
Morgan Stanley revised their house prices forecasts, down. They say “We struggle to see improvement in any of our components over the next year. We now see a 10-15 per cent peak to trough decline in real house prices (from 5-10 per cent), which would mark the largest decline since the early 1980s. With households 2x more leveraged to housing than back then, the impact on housing equity would be larger again. This downgrade largely reflects the downturn’s extended length, as we expect the relatively orderly declines to date will continue. However, an acceleration of declines is in our bear case, and we will continue to monitor stress points, including arrears trends. Strong employment growth and temporary migration has helped contain reported vacancy rates thus far, but we see a sustained overbuild into 2019 weighing on rentals”.
NABs latest quarterly property survey index fell sharply in Q3, to the lowest level in 7 years, Sentiment was dragged lower by big falls in NSW and VIC. NAB’s view is the orderly correction in house prices will continue over the next 18-24 months with Sydney falling around 10% peak to trough and Melbourne 8%. This reflects a bigger fall than previously expected but would still leave house prices well up on 2012 levels. Their central scenario does not include a credit crunch event leading to disorderly falls in house prices. They also say the boom in Australian real estate sales to foreign investors has run its course, with NAB’s latest survey results continuing to highlight a decline in foreign buying activity resulting from policy changes in China on foreign investment outflows and tighter restrictions on foreign property buyers in Australia. In Q3, there were fewer foreign buyers in the market for Australian property, with their market share falling to a 7-year low of 8.1% in new housing markets and a survey low 4.1% in established housing markets.
Expect the calls for an increase in migration, and a freeing of lending standards to reach fever pitch – both of which MUST be ignored. We have to get back to more realistic home price ratios, despite the pain. So it was interesting to note that the NSW State Government this week, suggested that migration needed to slow, to provide breathing space, and for infrastructure to catch up. Better late than never. Remember the 2016 Census revealed that Australia’s population increased by 1.9 million people (+8.8%) in the five years to 2016, driven by a 1.3 million increase in people born overseas (i.e. new migrants)!
We published our latest household survey data this week. Mortgage stress rose again, to cross the one million households for the first time ever. We discussed the results in full in our post “Mortgage Stress Breaks One Million Households” The latest RBA data on household debt to income to June reached a new high of 190.5. This high debt level helps to explain the fact that mortgage stress continues to rise. Across Australia, more than 1,003,000 households are estimated to be now in mortgage stress (last month 996,000). This equates to 30.6% of owner occupied borrowing households. In addition, more than 22,000 of these are in severe stress. We estimate that more than 61,000 households risk 30-day default in the next 12 months. We continue to see the impact of flat wages growth, rising living costs and higher real mortgage rates. Bank losses are likely to rise a little ahead.
Moodys released a report suggesting that Mortgage delinquencies and defaults are more likely to occur in outer suburbs of Australian cities than inner-city areas, because of the lower average incomes and weaker credit characteristics in these suburbs. “Delinquency rates are highest in outer suburban areas. On average across Australian cities, mortgage delinquency rates are lowest in areas within five kilometers of central business districts and highest in areas 30-40 kilometers from CBDs. In the residential mortgage-backed securities they rate, delinquency rates are in many cases higher in deals with relatively large exposures to mortgages in outer areas.
We agree there are higher loan to value and debt to income ratios in the outer areas, but the overall debt commitments are higher closer in and so we suspect that many more affluent households are going to get caught, because of multiple mortgages, including investment mortgages and their more affluent lifestyles. My thesis is the banks have been lending loosely to these perceived lower risk high income households, but it ain’t necessarily so…
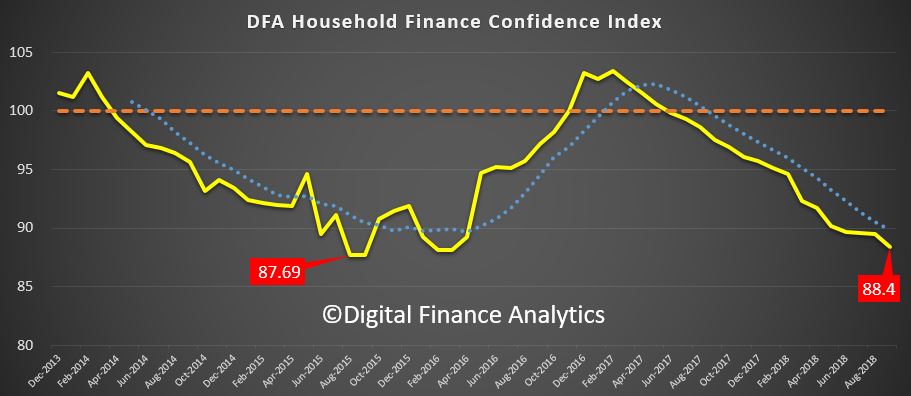
We also published our Household Financial Confidence index. The latest read, to end September shows a further fall, and continues the trend which started to bite in 2017. The current score is 88.4, just a bit above the all-time low point of 87.69 which was back in 2015. Last month – August – it stood at 89.5. You can watch our video “Household Financial Confidence Drifts Lower Again” where we discuss the results. We expect to see the index continuing to track lower ahead, because the elements which drive the outcomes are unlikely to change. Home prices will continue to move lower, the stock markets are off their highs, wages are hardly growing and costs of living are rising. Household financial confidence is set to remain in the doldrums.
Finally, we also published our survey results in terms of forward intentions. So what is in store for the next few months? Well, in short it’s more of the same, only more so, with more households reporting difficulties in obtaining finance, fewer expecting to transact in the next year and to see home prices rise. You can watch our video “Decoding Property Buying Intentions” where we analyse the results. The single most startling observation is the fall in the number of property investors, including those who hold portfolios of investment properties intending to transact. 20% of portfolio investors are expecting to transact, and the bulk of these intend to sell a property, compared with a year ago when 50% said they would transact, and most were looking to add to their portfolios. Most solo property investors are now on the side lines, with around 10% expecting to transact, and most of these on the sell side. Demand for investment property will continue to fall, as rental yields and capital appreciation fall.
So to the markets.
Locally, the ASX 100 ended the week well down, although there was small rise on Friday, after the heavier falls earlier in the week. We ended at 4,849, up 0.20%. The local volatility index remains elevated, ending at 20.4 on Friday, though that 6.5% lower than the previous day. Expect more ahead.
The ASX Financials index however did less well, and ended at 5,744, up just 0.03% and below the June lows. The banking sector is under pressure, for example Macquarie ended at 115.5, up 0.03% on the day, but well down from its 125 range. And AMP continues to languish at 3.05. We heard from some of the major bank CEO’s this week, with Westpac and ANZ apologising for the issues revealed in the Royal Commission, but I also note that CBA has so far only addressed one of the many issues which APRA agreed with them in terms of behavioural remediation. The banks have a long way to go to regain trust, and we expect more weakness ahead. And the latest estimates are that the sector will be up for something like $2.4 billion dollars in remediation costs and other charges. And guess who will end up paying for their bad behaviour?
The Aussie ended the week at 71.10, having reached the 70.5 range in the week. This has more to do with the US dollar movements than changes in sentiment here.
There are debates about what caused the significant falls, after all the FED rate lift strategy, and the trade wars have been around for some time. But my guess is the market has finally understood the era of low-cost or no-cost money is over. Thus expect more volatility ahead. The US fear index fell back on Friday, down 13.8% to 21.31, but is still elevated.
In fact, Wall Street indexes rose on Friday after a week of significant losses as investors returned to technology and other growth sectors, but gains were hampered by ongoing worries about U.S.-China trade tensions and rising interest rates.
Energy and financial stocks continued to fall and bank stocks kicked off the third-quarter financial reporting season with a whimper, while investors fled insurance stocks after Hurricane Michael slammed into Florida.
The technology sector was the biggest gainer of the S&P’s 11 major industry indexes, with a 1.5 percent advance, but it was still on track for its biggest weekly drop since March. The Dow Jones ended up 1.15% to 25,340, but is well off its recent highs. The NASDAQ was up more, 2.29% to 7,497, as buyers came back into the sector. The S&P 500 ended up 1.37% to 2,765.
All three indexes were on track for their biggest weekly declines since late March.
The S&P Financial index was down 0.42% to 465.07, on mixed trading results which came out on Friday. The S&P 500 banks subsector slid 1.6 percent. The biggest drag on the subsector was JPMorgan Chase & Co which reversed early gains to trade down 2 percent despite its quarterly profit beating expectations. PNC Financial led the percentage losers among bank stocks, with a 6.5 percent drop after the regional bank reported disappointing quarterly loan growth and said it expected only a small improvement in lending this quarter. The only gainers among banks were Citigroup, which rose 0.6 percent, and Wells Fargo which eked out a 0.64 percent gain after upbeat results.
The bank results launch a quarterly reporting season that will give the clearest picture yet of the impact on profits from President Donald Trump’s trade war with China.
The short term 3-Month Treasury remained flat at 2.27 at the end of the week, while the 10-Year bond rose a little to 3.165, up 1.09%. The Treasury yield is now at a 7-year high. The suspicion is that perhaps rates have turned and will go higher still, as a longer term view shows. It is also interesting to compare the US 3-Month Bill Rate minus the same rates in Germany and the UK. Short term rates in the US are higher, in fact reaching the highest positive difference since September 1984. This highlights the different path now being taken by the US, but the fall-out will be global.
Gold, which had moved higher among the market ructions, slide a little, and was down 0.52% on Friday to end at 1,221. Bitcoin finished at 6,316 up 0.57%, and continues in its marrow range for now. And Oil which had fallen earlier in the week moved up 0.72% to 71.48.
Finally, it’s worth noting that the Reserve Bank Of New Zealand is now publishing a bank specific set of scorecards to help consumers weigh up the risks bank to bank. This is essential, given the now explicit Deposit Bail-In which exists there. We discussed this most recently in our Post “The Never Ending “Bail-In” Scandal, and in the Video that Economist John Adams and I released yesterday. In fact, the bank specific data which is available in Australia is derisible compared with the NZ stats, but I came across this slide from LF Economics which highlights how the ratio of Bank Loans To Bank Deposits compares across a number of Banks, including the big four. It’s fair to assume the higher the ratio, the greater the potential risk. Westpac, CBA, NAB and ANZ are all in the top half. I believe we need more specific disclosure from the sector, and I suggest that APRA continues to provide only a partial view of the banking system here. The fact is, Bail-In, or no, we need much more transparency. It would help to negate the spin presented in the RBA’s Financial Stability Review, which in my view is not effective. Oh, and look out for our joint video on Gold, coming up in the next few days, it will surprise you!
Finally, a reminder that on Tuesday 16th October at 20:00 Sydney we are running our next live stream Q&A event. The reminder is up on YouTube, and you can send me questions before hand, or join in the live chat. So mark your dairies.
In the final post relating to our latest household surveys this month, we turning to our household financial confidence index.
The latest read, to end September shows a further fall, and continues the trend which started to bite in 2017. The current score is 88.4, just a bit above the all-time low point of 87.69 which was back in 2015. Last month – August – it stood at 89.5.
Looking across our property segments, both property investors and owner occupiers were lower, reacting to the falls in home prices, and the difficulty of refinancing many are experiencing. Mortgage rate increases are also putting more pressure on many budgets. Despite this, those renting remain less confident, though investors have really turned sour now.
Across the states, we see a bunching of results, though Victoria appears to be heading south, while South Australian households are a little more positive than last month.
The falling levels of confidence are evident across many of the age bands, older households are still relatively more positively, largely thanks to historic capital growth in their property, and strong stock market performance in recent times. Younger households are more concerned and many are now seeing their property values fall, at least on paper.
Looking at the moving parts which drive our index, those who felt more confident about their job security than 12 months ago fell 1.8% to 11%. 59% saw no change.
There was a fall in those confident with regards to their savings, with a fall of 1.7% in those feeling more comfortable than a year ago, and 50% feeling about the same. The falling savings rates that many have experienced is part of the story, but so is the fact that more are raiding savings to make ends meet. This of course is not a sustainable position.
There was a fall of 1.3% in those who are comfortable with the amount of debt they hold, and 42% are less comfortable than a year ago, reflecting recent mortgage rate increases, and problems with getting an appropriate refinance deal.
Overall income remains an issue for many, with 42% saying there had been no increase in the past year, and 50% saying there had been a decrease in real income. Many households are relying on multiple jobs to pay the bills, and some of these are zero hours and uncertain in terms of income. We still see high levels of under employment, suggesting that many households want more work than they can get.
The costs of living remain a significant issue with 84% saying their costs have risen in the past year. It is the normal story, higher electricity and fuel bills, rising medical costs and child care as well as school fees. The standard reported CPI measure does not appear to align with many households current experience.
Putting all this together, 39% say their net worth is higher now than a year ago, mainly thanks to the strong stock market, 28% say they see no change and 25% say their net worth has dropped. The most significant factor here is the fall in property values over the past 12 months.
We expect to see the index continuing to track lower ahead, because the elements which drive the outcomes are unlikely to change. Home prices will continue to move lower, the stock markets are off their highs, wages are hardly growing and costs of living are rising. Household financial confidence is set to remain in the doldrums.
Finally, despite the attractor mortgage rates on offer from the banks continues, (in an attempt to keep mortgage volumes up), our research shows that many households cannot access them in the new tighter lending environment. 40% of applications are being rejected.
By way of background, these results are derived from our household surveys, averaged across Australia. We have 52,000 households in our sample at any one time. We include detailed questions covering various aspects of a household’s financial footprint. The index measures how households are feeling about their financial health. To calculate the index we ask questions which cover a number of different dimensions. We start by asking households how confident they are feeling about their job security, whether their real income has risen or fallen in the past year, their view on their costs of living over the same period, whether they have increased their loans and other outstanding debts including credit cards and whether they are saving more than last year. Finally we ask about their overall change in net worth over the past 12 months – by net worth we mean net assets less outstanding debts.
The latest edition of the DFA Household Financial Confidence Index to end July 2018 remains in below average territory, coming in at 89.6, compared with 89.7 last month. We had expected a bounce this month, in fact the rate of decline did slow, thanks to small pay rises for some in the new financial year, and refinancing of some mortgage loans to the “special” rates on offer currently. However, the index at this level is associated with households keeping their discretionary spending firmly under control. And the property grind is still impacting severely.
Looking at the results by our property segmentation, owner occupied households overall remain around the neutral reading, while property investor confidence continues to fall, into territory normally associated with those who are renting or living with family. This signals significant risks in the property investment sector ahead.
Owner occupied property owners who have been able to refinance (lower LVR loans) have been able to shave their monthly repayments, while for some in rented accommodation they have found it easier to find a rental at a lower rent. Investment property holders reported continued concerns about servicing their loans, and of potentially higher interest rates ahead. Those on interest only loans were particularly concerned about their next reset review, given the tighter underwriting standards now in play. The peak of the resets however is well more than a year away.
The spread of scores across the states continues to bunch, as NSW and VIC households react to lower home prices. WA continues to show little real recovery in household finance (despite the hype) although there was a small rise in Queensland, thanks to recent pay lifts for some.
Across the age bands, younger households remain the least confident, while those aged 50-60 were more bullish, thanks to recent stock market lifts, and access to lower rate refinance mortgages. The inter-generational dynamic is in full force, with younger households not in the property market seemingly unable to access the market (despite the recent incentives in NSW and VIC) and those with a property, and mortgage wrestling with the repayments.
Looking in more detail at the index components, job security improved a little this month, with 12.5% feeling more secure, up 0.67%, 27% less secure, down 0.92% and those about the same at 58.8%, up 2%. However, we see many households in multiple part-time jobs, and around 20% of households are actively seeking more work/hours.
There was a small rise in those reporting an income improvement, thanks to changes which kicked in from July. 2.3% said their income has improved, up 1.5% from last month, while 43.7% stayed the same, and there was a drop of 2.2% of those reporting a fall in income, to 50.5%.
Households continue to see the costs of living rising, with 82.3% reporting higher costs, up 1%, 13% reporting no change, and 2.5% falling. The usual suspects included power bills, child care costs, the price of fuel, plus health care costs and the latest rounds of council rate demands. The reported CPI appears to continue to under report the real experience of many households. Many continue to dip into savings to pay the bills.
In terms of debts outstanding, there was a small fall in those reporting they were less comfortable, with 42% reporting compared with 44% last month. This is attributable to changes in interest rates, and refinancing, especially for owner occupied households with a lower Loan to Income ratio. Many with large mortgages also have other debts, including credit cards and personal loans which also require servicing. Around 52% reported no change in their debt, up 3.5%. Property Investors were more concerned overall.
Looking at savings, those with stocks and shares have enjoyed significant gains (at least on paper) and recent dividends, so tended to be more confident. Some were able to benefit from higher savings rates on selected term deposits, though rates attached to on-call accounts continue to languish as lenders manage their margins. Around a quarter of households have less than one months spending in savings, so many are facing a hand to month situation with regards to their finances. Many of these households are in the younger age bands and have no savings to protect them should their personal situations change.
We noted in the survey that a number of households were actively seeking alternative savings vehicles as property and bank deposits look less interesting. We will have to see whether these alternatives are as attractive (in terms of risk-return) as some are claiming. We have our doubts. But then risk is relative.
So finally, putting this all together, the proportion of households who reported their new worth was higher than a year ago continues to slide as property price falls continue to hit home, and as savings are raided to maintain lifestyle. 42% said their net worth had improved, down 3.75% from last month. 25.6% said their net worth had fallen, up 2.5% and 28% reported no real change.
We had expected to see a small bounce in the index this month as some incomes rise in the new tax year and other changes take effect. But the impact of the fading property sector, and cash flow constraints are likely to dwarf this impact. The only “get out of jail card” will be income growth above inflation, and as yet there is little evidence of this occurring. Thus we expect the long grind to continue.
Finally, the spate of attractor rates from the banks continues, in an attempt to keep mortgage volumes up. However, our research shows that many households cannot access them in the new tighter lending environment.
By way of background, these results are derived from our household surveys, averaged across Australia. We have 52,000 households in our sample at any one time. We include detailed questions covering various aspects of a household’s financial footprint. The index measures how households are feeling about their financial health. To calculate the index we ask questions which cover a number of different dimensions. We start by asking households how confident they are feeling about their job security, whether their real income has risen or fallen in the past year, their view on their costs of living over the same period, whether they have increased their loans and other outstanding debts including credit cards and whether they are saving more than last year. Finally we ask about their overall change in net worth over the past 12 months – by net worth we mean net assets less outstanding debts.