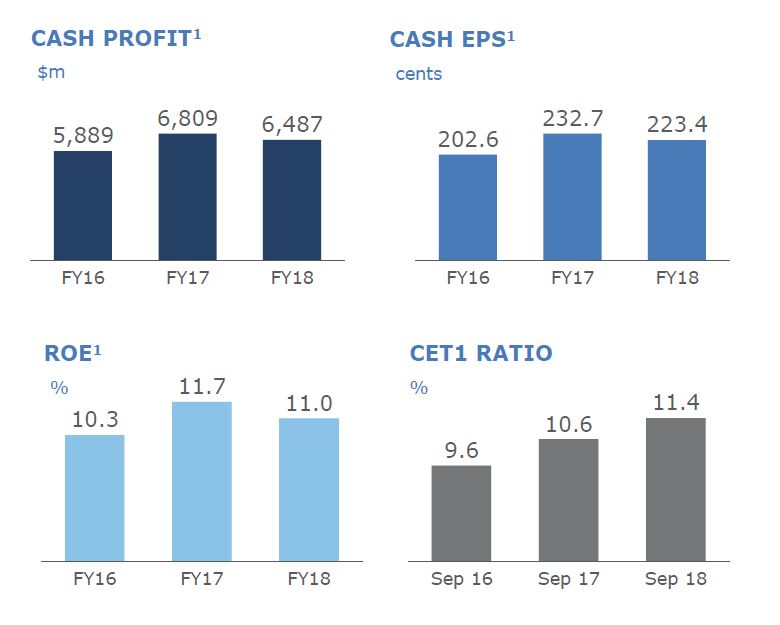
ANZ today announced a Statutory Profit after tax for the Full Year ended 30 September 2018 of $6.40 billion, flat on the comparable period and a Cash Profit on a continuing basis of $6.49 billion, down 5%. Their approach to simplify the business and reduce costs have bolstered their capital position, but also left them potentially more exposed to a mortgage and construction sector downturn.
ANZ’s Common Equity Tier 1 Capital Ratio was 11.4% up 87 basis points (bps). Return on Equity decreased 67 bps to 11.0% with Cash Earnings per Share down 4% to 223.4 cents (continuing). The Final Dividend is 80 cents per share, fully franked, bringing the Full Year Dividend to 160 cents.
They called out the headwinds facing Retail banking thanks to housing growth slowing, and borrowing capacity reduced. They said they had sacrificed sort-term revenue growth and high margins in Australia, particularly in the investor and interest-only segments. New Zealand performed well. The risk adjusted performance for Australia FELL in the second half, as the impact of the tighter mortgage sector hit home.
Net Interest Margin was significantly lower, thanks to the change in business mix, funding and customer remediation charges.
The results were supported by the $3 billion share buy-back and the neutralisation of the full year dividend reinvestment plan. They reduced variable remuneration paid to staff this year across the bank by $124 million and are undertaking the urgent work required to fix the failures that have been highlighted by the Royal Commission.
ANZ announced earlier this month charges of $377 million after tax have been recognised in 2H18 for refunds to customers and related remediation costs. ANZ also recorded accelerated amortisation expense of $206 million in 2H18, predominantly relating to its International business. A restructuring charge of $104 million, largely relating to the previously announced move of the Australia and Technology Divisions to agile ways of working, was also recorded in 2H18.
Staff numbers have fallen significantly from 50,152 in 2015 to 37,860 in 2018.
As a result, costs were lower, despite significant technology investments.
The total provision charge for the year was $688 million down 43%.
Looking at the Australian Home Lending portfolio, they say 72% of households are ahead on repayments. They hold more loans above 95% than 90% in their portfolio.
Australian Home Loan 90+ Delinquencies were higher, especially investor loans, rising from 0.84% in September 2017 to 0.86% in September 2018.
WA continues to show more 90+ delinquency, and WA is 13% of funds under management, but 33% of 90+ and over half of portfolio losses. This shows the long slow drag on performance from a slowing economy.
They also increased their exposure to commercial property, with apartment development limits up 17% to ~$4 billion, which accounts for ~39% of total residential limits. Inner City apartment limits totalled $0.56 billion and was 14% of the total apartment development limit in FY18, down from 20% in the prior year. This was thanks to developments in Sydney and Melbourne being repaid. They have highest exposure in NSW.
The Group Loss rate reduced to 12 bps with the second half loss rate 9 bps. New Impaired assets declined just over $1.1 billion or 34% with Gross Impaired Assets down 16%. The significant decline in the Group loss rate reflects portfolio credit quality improvement driven by strategic changes to the composition of the asset book, such as the sale of retail and commercial in Asia, together with tighter lending standards and a relatively benign credit environment.
The APRA CET1 capital ratio at 30 September 2018 was 11.4% (16.8% on an Internationally Comparable basis). This places ANZ well above the APRA prescribed ‘unquestionably strong’ threshold, comfortably ahead of the 2020 deadline.
Completed assets sales during the year increased the CET1 position by ~84bps. They commenced an on market share buyback in January 2018 and was increased to $3 billion in June 2018. As at 30 September $1.9bn of this had been completed, representing ~2% of ANZ shares outstanding. They expect the remaining ~$1.1bn to be completed during 1H19.
The Group’s funding and liquidity position remained strong with the Liquidity Coverage Ratio at 138% and Net Stable Funding Ratio at 115%. Other asset sales already announced will provide further flexibility.
Lenders Mortgage Insurer Genworth reported their 3Q18 earnings today with a statutory net profit after tax (NPAT) of $19.6 million and underlying NPAT of $20.4 million for the third quarter ended 30 September 2018 (3Q18). It is an important bellwether for the mortgage industry, and confirms recent softening. Whilst they have a strong capital position, their net investment returns were also down a little.
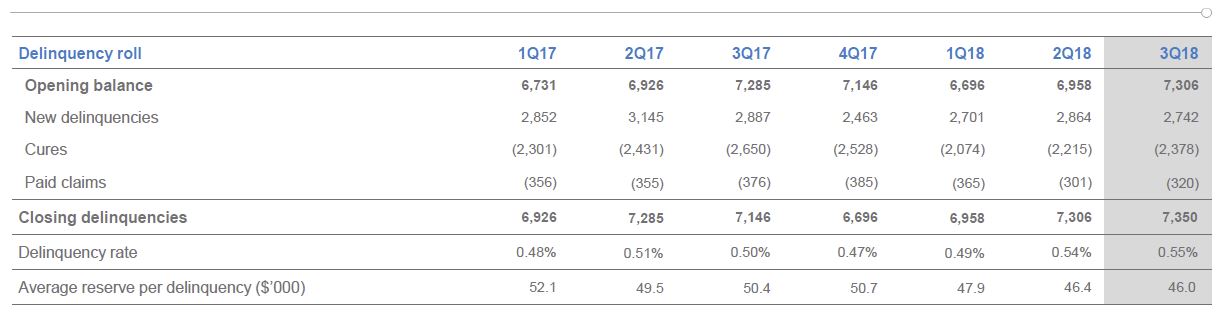
The Delinquency Rate (number of delinquencies divided by policies in force but excluding excess of loss insurance) increased from 0.50% in 3Q17 to 0.55% in 3Q18 (1H18: 0.54%). They called out “the continued trends of softening cure rates from a moderating housing market, tightening credit standards and increases in mortgage interest rates. This has resulted in a more subdued seasonal uplift than has historically been experienced by our business”. As a result, loss ratio guidance was revised higher to 50-55% from 40-50% guidance range previously.
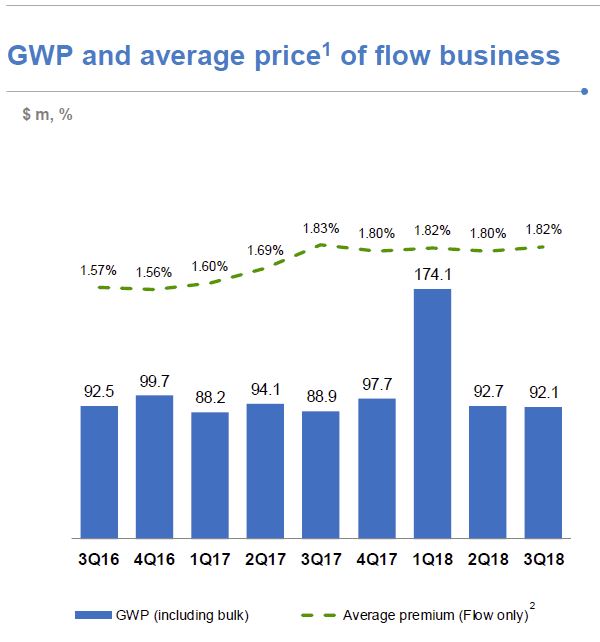
Gross Written Premium increased in 3Q18 reflecting growth in their traditional Lenders Mortgage Insurance (LMI) flow business.
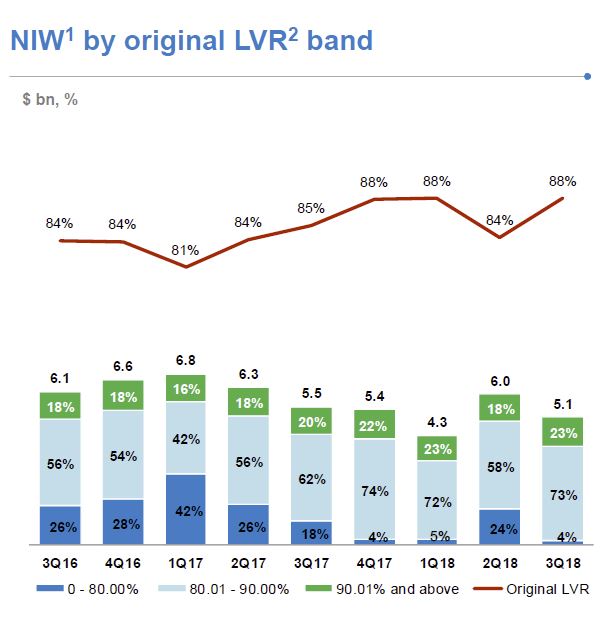
New business volume (excluding excess of loss insurance), as measured by New Insurance Written (NIW), decreased 7.3% to $5.1 billion in 3Q18 compared with $5.5 billion in 3Q17. NIW in 3Q17 included $0.8 billion of
bulk portfolio business versus no bulk portfolio business in 3Q18. Excluding the bulk portfolio business written in 3Q17, flow business NIW increased 8.5% in 3Q18.
Gross Written Premium (GWP) increased 3.6% to $92.1 million in 3Q18 (3Q17: $88.9 million). This does not include any excess of loss business written by Genworth’s Bermudan entity and reflects the greater proportion of traditional LMI flow business written by Genworth lender-customers.
Net Earned Premium (NEP) decreased 32.0% from $100.1 million in 3Q17 to $68.1 million in 3Q18. This includes the adverse $24.8 million impact of the 2017 Earnings Curve Review, and lower earned premium from current and
prior book years. Excluding the 2017 Earnings Curve Review impact, NEP would have declined 7.2% in 3Q18.
The adverse impact on NEP of the 2017 Earnings Curve Review has been reducing quarter on quarter since it took effect on 1 October 2017. Whilst the 2017 Earnings Curve Review has the effect of lengthening the time-period over which premium is earned, it does not affect the quantum of revenue that will be earned.
Genworth’s Unearned Premium Reserve as at 30 September 2018 was $1.2 billion.
The Delinquency Rate (number of delinquencies divided by policies in force but excluding excess of loss insurance) increased from 0.50% in 3Q17 to 0.55% in 3Q18 (1H18: 0.54%). This was driven by two factors. Firstly, there was a decrease in policies in force following completion of the lapsed policy initiative undertaken by the Company in 2Q18. The second factor was the increase in delinquency rates year-on-year across all States (in particular Western Australia, New South Wales and to a lesser extent South Australia). In terms of number of delinquencies, Western Australia and New South Wales experienced the largest increase with Queensland and Victoria experiencing a decrease in number of delinquencies.
New delinquencies were down in the quarter (3Q18: 2,742 versus 3Q17: 2,887) with mining regions showing signs of improvement. In non-mining regions, the softening in cure rates experienced in 1Q18 and 2Q18 continued in 3Q18 with the traditional seasonal uplift in the third quarter being more subdued than prior years.
Net Claims Incurred for the quarter were down 3.2% (3Q18: $35.8 million versus 3Q17: $37.0 million). The Loss Ratio in 3Q18 was 52.6% up from 37.0% in 3Q17, reflecting the impact of lower NEP due to the 2017 Earnings Curve Review. Excluding the impact of the 2017 Earnings Curve Review the loss ratio would have been 38.6%.
The Expense Ratio in 3Q18 was 32.5% compared with 29.7% in 3Q17, reflecting the lower NEP.
Investment Income of $21.5 million in 3Q18 was up 38% on the prior corresponding period (3Q17: $15.6 million). The 3Q18 Investment Income included a pre-tax mark-to-market unrealised loss of $1.2 million ($0.8 million after-tax) versus a pre-tax mark-to-market unrealised loss of $12.0 million ($8.4 million after-tax) in 3Q17.
As at 30 September 2018 the value of Genworth’s investment portfolio was $3.2 billion, more than 90% of which is held in cash and highly rated fixed interest securities and $169 million of which is invested in Australian equities in line with the Company’s low volatility strategy. After adjusting for mark-to-market movements the 3Q18 investment return was 2.80% p.a. marginally down from 2.88% in 3Q17.
Mortgage delinquencies have remained broadly stable over the year, but are expected to increase moderately as a result of the property market slowdown, according to Moody’s Investors Service, via MPA.
While the agency said it expected only a slight uptick in arrears over the coming year, it projected that NSW and Victoria would be the most affected, largely because of high household leverage in these states and the impact of interest-only loans switching to P&I repayments.
Keeping arrears contained, however, is completely reliant on solid macroeconomic conditions. If there is strong job growth and stable employment, borrowers will be more able to make their repayments.
It found that the proportion of residential mortgages that were more than 30 days in arrears was 1.58% in May 2018, compared to 1.62% in May 2017. As expected, delinquency rates were lower in capital cities. The most affected regions were Western Australia and Queensland, where borrowers have suffered from a lack of mining and resource-related jobs and drought.
However, another ratings agency, S&P, struck a more cautionary tone in its latest arrears report. It found that “there has been an ongoing increase in home loans that are more than 90 days in arrears”, which it defines as advanced.
“Loans more than 90 days past due reached 0.74% in August, making up around 54% of total arrears. This is up from 42% five years ago.”
The regional bank mortgage originators reported the highest percentage of loans in arrears in August, at 1.33%, followed by the major banks, at 0.99%. This heightened pressure regionally echoes Moody’s findings.
To re-cap, the number of loans in the “advanced stages of arrears” has to do with geographic pressures, repayment shock from the IO loan transition, general mortgage stress, and out-of-cycle rate rises, S&P said.
Likewise, the agency said it expected falling house prices to put further pressure on mortgage arrears in coming months, especially among borrowers with higher loan-to-value rations who haven’t had time to build up equity or accumulate mortgage buffers.
“This could tip some borrowers into a negative equity position, which would significantly impede their refinancing prospects in the current lending environment. Across all RMBS loan portfolios we expect borrowers with LTV ratios of 80% and higher to be most at risk. These loans account for around 13% of RMBS loan portfolios,” S&P said
The latest and updated edition of our flagship report “The Property Imperative” is now available free on request with data to October 2018. This is volume 11.
This Report is a distillation of our research in the finance and property market, using data from our household surveys and other public data. We provide weekly updates via our blog – the Property Imperative Weekly, and our YouTube Channel, but twice a year publish this report.
The past six months has seen a significant shift in momentum as home prices have moved lower across many of the main centres, auction clearance rates have eased, and more property stock is added to the market, thanks to more new builds and as more owners try (or are forced) to sell.
Many of the “experts” have changed their tune and are expecting to see further falls in home prices ahead, although the extent and speed of these falls remains uncertain. Meantime more households are in financial stress, as incomes remain constrained, costs of living rise, and returns from investments look shaky. No surprise to see mortgage delinquencies are rising, though they are still in an absolute sense very low.
At its heart, home price growth is fundamentally linked to credit availability and thanks to belated tightening from APRA, the fallout from the Royal Commission into Financial Services Misconduct, and the Productivity Commission and ACCC work, lending standards continue to tighten.
Whilst some still spruik future growth thanks to migration, government intervention, or first time buyer appetite, these factors pale into insignificance against the global backcloth of rising interest rates, slowing global growth and broader political and economic uncertainty.
As a result, we have revised our property price scenarios which are driven by our household surveys, and modelling, and believe that a 40% peak to trough fall in home values in the main eastern states is quite conceivable. But even smaller falls will have a significant impact, in terms of broader economic growth, the negative household wealth effect, and will impact the banks and their profitability.
We believe that 2019 will become a critical year, with the potential for the property sector to move into territory not seen in a generation or more. The final report from the Royal Commission, expected in February will be a significant event, despite the fact that even now, the RBA and Treasury are warning the Commission that further lending tightened has economic risks attached. But a generation of too lose lending needs to be addressed, rather than just reverting to a further cycle of debt induced growth. That is the policy battleground we discuss in this edition.
We will continue to track market developments in our Property Imperative weekly video blogs, and publish a further update in about six months’ time.
If you are seeking specific market data from our Core Market Model, reach out, and we will endeavour to assist.
Here is the table of contents:
Request the free report [60 pages] using the form below. You should get confirmation your message was sent immediately and you will receive an email with the report attached after a short delay. Note that reports are sent in batches, so please allow time for the system to processes your request.
Note this will NOT automatically send you our ongoing research updates, for that register here.
[contact-form to=’mnorth@digitalfinanceanalytics.com’ subject=’Request for The Property Imperative Report 11′][contact-field label=’Name’ type=’name’ required=’1’/][contact-field label=’Email’ type=’email’ required=’1’/][contact-field label=’Email Me The Report’ type=’radio’ options=’Yes Please’ required=’1′ /][contact-field label=’Comment If You Like’ type=’textarea’/][/contact-form]
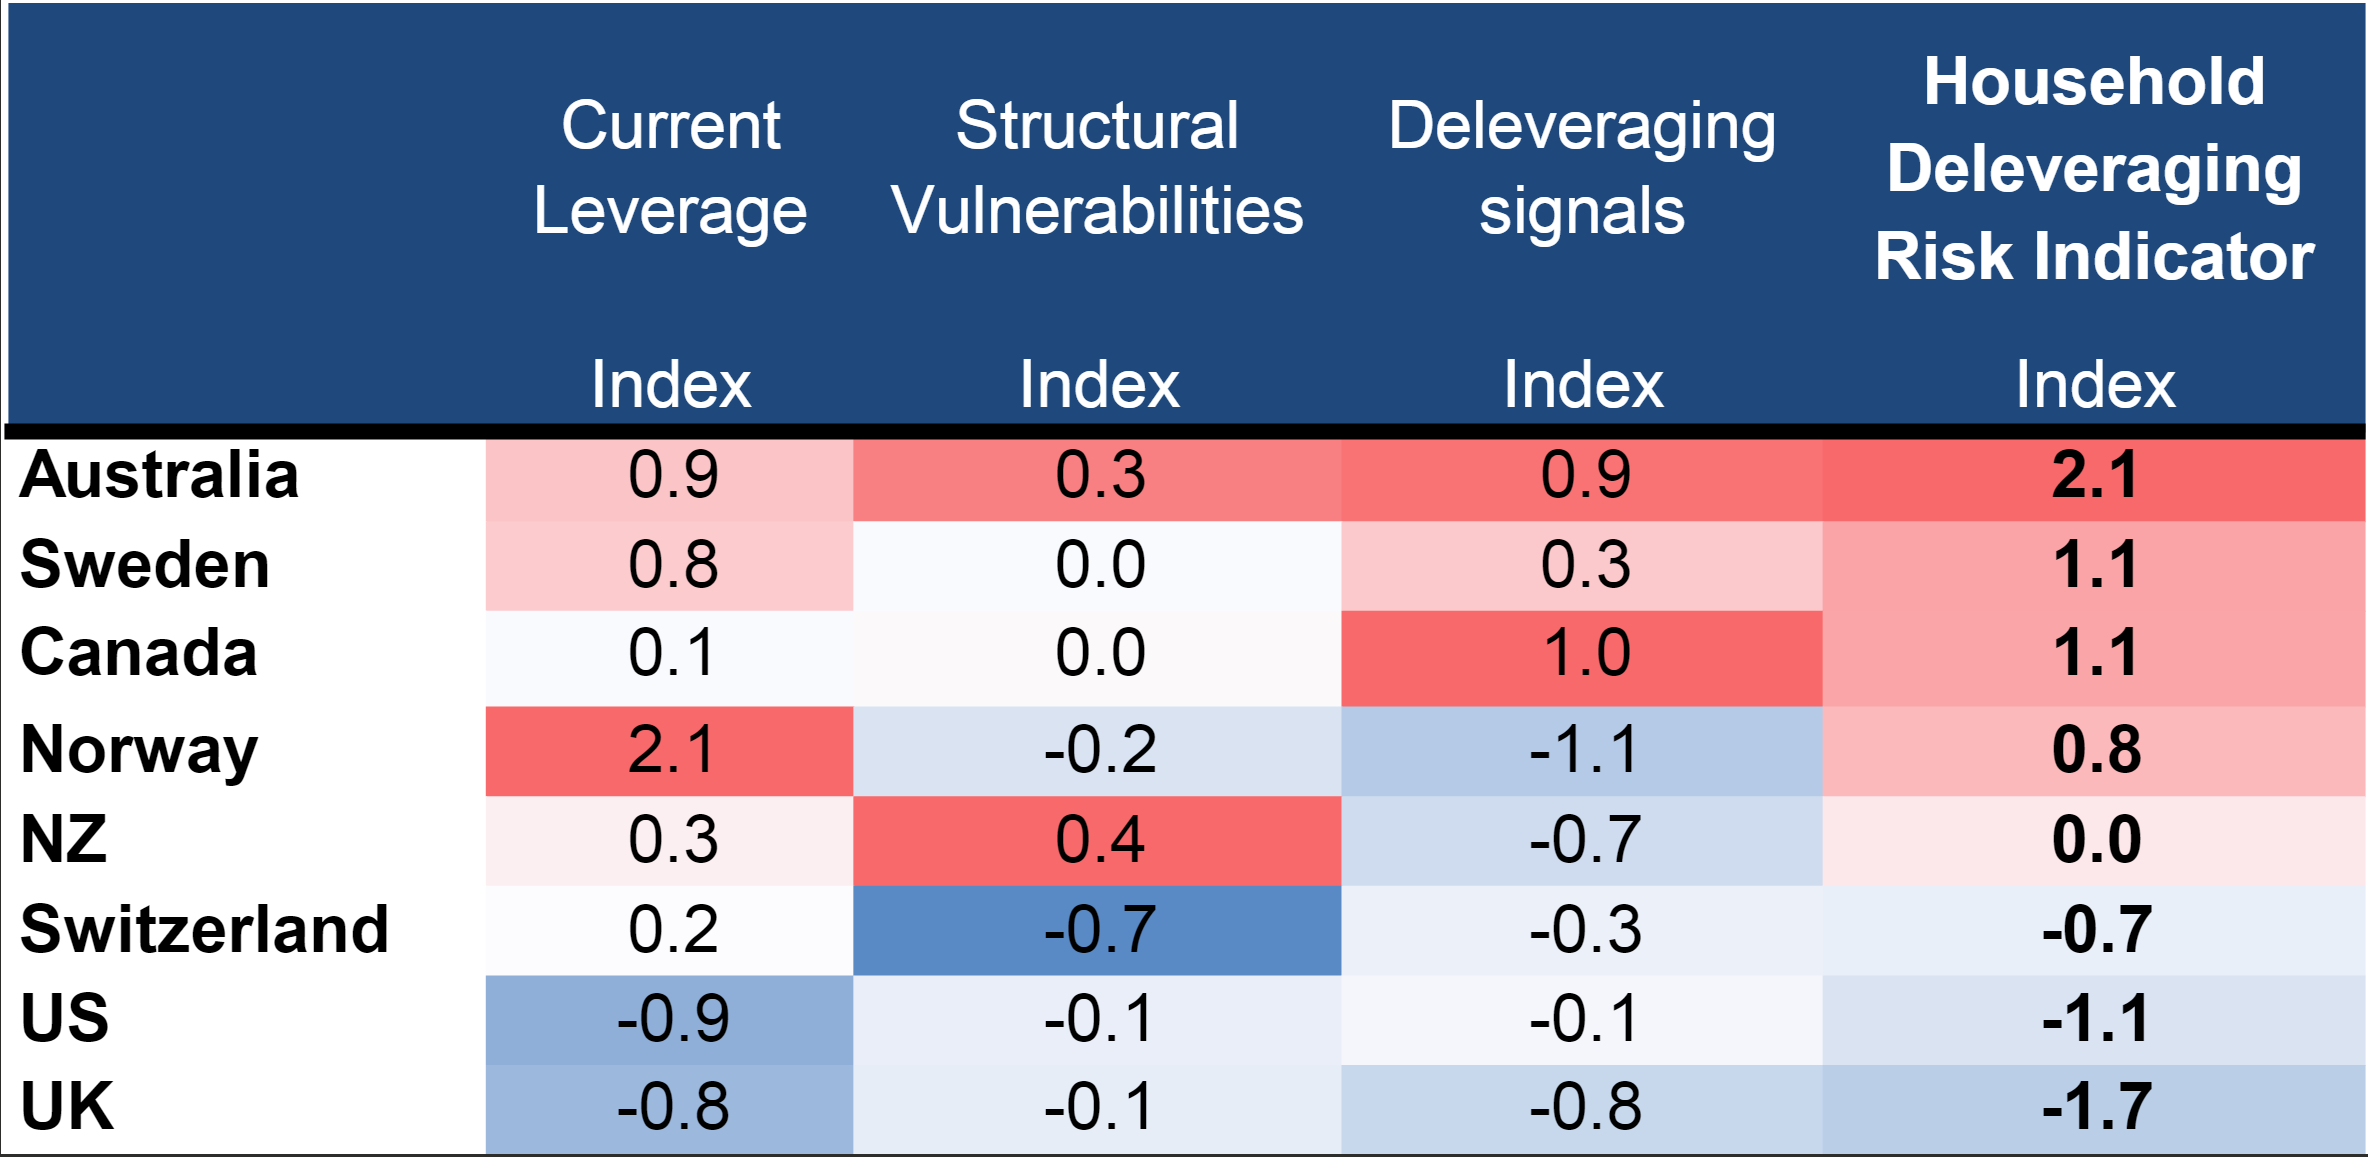
According to Morgan Stanley, via Bloomberg, Australia’s economy is most at risk in the developed world from household debt reduction because of weak house prices and potential tax changes that could curb property investments.
That’s the conclusion from the bank’s Household Deleveraging Risk Indicator, which looks at relative debt and structural weaknesses. The study of the world’s 10 leading developed economies puts Sweden and Canada as the second-most at risk, followed by Norway.
Source: Morgan Stanley Research
“These economies now face a crucial juncture as housing markets weaken, forcing a reappraisal of leverage and wealth, and global financial conditions tighten, increasing the consumption drag from debt service and rising savings,” the bank’s strategists said.
The opposition has called on the coalition government to extend the Hayne royal commission after listening to victims of the banks, via InvestorDaily.
Labor leader Bill Shorten made the comments after a town hall meeting with Victorians in the federal seat of Deakin.
“We’ve heard today from victims of the banks, we’ve heard from small businesses, we’ve heard from women trapped in domestic violent relationships. We’ve heard from people who were the victims of crime and then became victims of crime again reinjured through the processes of careless greedy negligent banks,” he said.
The opposition leader said it was clear from the royal commission that the banks were guilty of ripping off ordinary Australians.
“The banks should be ashamed of themselves. In Australia if you steal from the banks you go to jail but if the banks steal from you they get a bonus and a promotion and a bigger profit,” he said.
Mr Shorten said he thought the Hayne Royal Commission was doing a great job and that what they had exposed would wake up the industry.
“This is the biggest wake-up call that we’ve seen in Australian corporate history,” he said.
Mr Shorten said that Labor called on the government to extend the royal commission and demanded an apology from the guilty parties.
“I think the people in power and regulators owe a big apology to the tens of thousands of victims of banking in Australia. We want to see Mr Morrison extend the royal commission,” he said.
Mr Shorten said that Scott Morrison’s track record on the royal commission called into question his ability to implement any changes.
“On 26 occasions the current Prime Minister, when he was Treasurer, voted against the royal commission. The action of him rejecting the banking royal commission 26 times speaks far louder than the words in our mouths.
“I’ve got my doubts that this government and this prime minister can be trusted to implement what comes out of the RC,” he said.
Mr Shorten acknowledged that Labor potentially should have called for a royal commission years ago but reiterated the parties support for the victims.
“Labor just wants to say to all the victims of the banks, we hear you and sure maybe things should have been done a lot longer ago but for the last 2 years we’ve stood up for the victims and today we are putting a submission into the royal commission just drawing attention to our knowledge and the voices we hear,” he said.
There would be challenges ahead in regulating banks as it was hard to legislate against being a bully said Mr Shorten.
“Some of the conduct we have heard is illegal and you shouldn’t have to pass a law to say don’t charge dead people for services that they are not getting. Some things are allowed within the law and they just exploit,” he said.
Blame was also to be put on the regulators who gave out the equivalent of corporate speeding tickets to banks, said the opposition leader.
“The regulators have found this royal commission to be highly embarrassing as they should. Having said that it does go back to the banks. The system is broken when it comes ethical protections of consumer and customers,” he said.
It is not enough to come to parliament to apologise said Mr Shorten and he said executives at banks should think about how they show they mean it.
“If the boards of banks and CEOs were to hand back some of the bonuses they’ve received whilst they were in charge of banks whilst they were exploiting ordinary Aussies. It doesn’t change where the victims are but it would be a good down payment,” he said.
This town hall meeting was the first of many as the Shadow Minister for Financial Services Clare O’Neil is currently undertaking a series of roundtables with victims in towns that have not been visited by the Royal Commission.
The move by labor was announced following the release of the interim report with Mr Shorten outlining that despite over 9000 submissions, the hearing had only heard from 27 customers.
“All of the hearings of the commission have been in just three capital cities; regional and rural customers have not had a sufficient chance to have their say in this process.
“Misconduct in the financial services sector is a national issue, and Australians across the country deserve their chance to be heard.”
However, federal Treasurer Josh Frydenberg has censured Mr Shorten for “threatening the independence, the authority of our royal commission”, stating earlier this month: “Bill Shorten first thought that he knew better than the royal commissioner saying there must be an extension of time, when the royal commissioner has yet to ask for it. Now he thinks he is the royal commissioner by conducting his own hearings and running a parallel process around the country.”
However, when asked whether the government would extend the commission further, should Commissioner Hayne ask for one, the Treasurer has previously said: “If he asks for more time, he has got it”.
Welcome to the Property Imperative weekly to 27th October 2018, our digest of the latest finance and property news with a distinctively Australian flavour.
Watch the video, read the transcript or listen to the podcast.
As we approach the end of October, which is often a volatile month, the markets are down and the outlook globally and in Australia to my mind looks increasingly uncertain. Property and Stocks, and other asset classes are looking distinctively wobbly, as does the banking sector. I fear that money printing will become back on the agenda sooner than many are expecting to try to stop the rot, and “maintain” the wealth effect created as real money loses its true value.
We start with the markets which had one of the worst weeks this year. Let’s start in the US, before looking at the local Australian markets. And later we will look at the latest property data too.
The Dow tumbled on Friday, shrugging off data showing ongoing U.S. economic growth as high-flying tech companies were punished in the wake of downbeat reports from Google and Amazon.
The Dow Jones Industrial Average fell about 1.19% to 24,688, though remember it hit 23,500 back in April. The S&P 500 fell 1.73% down to 2,659, while the Nasdaq Composite fell 2.07% ended at 7,167 on Friday. The three indexes are on track for their worst month in years. The narrower S&P 100 was down 1.82% to 1,189. Technical correction or not, these are significant falls, and we expect more volatility ahead. The fear index, or volatility index ended the week at 24.16, near its recent highs, but still below the February 18 spike.
The pair of downbeat reports overshadowed data showing the U.S. economy grew 3.5% in the third quarter, above economists’ estimates for a 3.3% increase, though analysts said a deeper look into the data revealed signs of a possible slowdown. In fact, it was buoyant consumer spending which helped to prop up the numbers.
Disappointing business investment suggested “the boost in capex from tax cuts and deregulation was likely front-loaded and fading quickly,” BNP Paribas said. “We continue to expect growth to slow from here as the sugar high in consumer spending turns into a sugar low.”
Investors grappled with wild swings on Wall Street amid growing concerns U.S. corporates were approaching peak profit growth after tech heavyweights Google and Amazon delivered underwhelming quarterly reports and signalled a softer patch of growth for the fourth quarter.
Alphabet fell 1.80% to 1,083 after it posted third-quarter revenue that fell short of expectations. Amazon shares, meanwhile, dropped 7.38% to 1,643 as its third-quarter revenue also fell short, while its weaker-than-expected guidance for the key holiday season exacerbated concerns.
On the other hand, Intel did better, up 3.11% to 45.69, despite some trade war concerns. The S&P 500 tech sector closed about 2% lower, while the communication services sector, which includes Netflix, Facebook, Alphabet and telecom companies sunk more than 2%.
More broadly you can list out some of the underlying concerns which are driving the market lower.
First, it’s the tightening policy of the Federal Reserve. Interest rates in the United States go up and the Fed let the market know that it will continue hiking rates next year. Higher interest rates mean that borrowing will become more expensive for US companies. Hence, the negative impact on stocks.
The trade tensions. So far, no end of the mutual tariff blows between the United States and China is in sight. This creates uncertainty and is bad for business.
Then the bumpy earnings season. Investors had high expectations for the financial reports of American companies. As well as result so far, concerns are now spreading about the fate of earnings in 2019. Interest rates rises would crimp consumers spending.
Then we cannot overlook the political tensions in America. The US midterm election will take place on November 6, and the pressure is rising. Will the Republicans retain power in the Congress?
Add to that more weak housing data as we discussed last week. There are worries that rising prices will hamper US economic growth.
And more broadly consensus is rising that global growth is heading south in 2019. This could hit China, Europe and other centres, Of course the quest for perpetual growth is unrealistic and stupid, but no-one is wanting to change tack, and drove towards a more sustainable path.
Banks are right in the middle of this, with the S&P 500 Financials down 1.39% on Friday to 419.21. Bitcoin slide a little, down 0.24% to 6,553, while Gold was up 0.51% to 1,235 and Oil was up 0.43% to 67.62.
The 3 Month yield was steady at 2.33, and the 10-year yield was down to 3.077, 15 basis points off its recent highs, though given the FED’s stance that may be temporary.
One International Bank to watch is Deutsche Bank, which has been taking a bath recently. Bank in January 2014 it was at around 30.00 Euros, but now its languishing at 8.51 and was down 3.56% on Friday. The plunge in shares for the German lender comes after mixed quarterly figures were released this week which showed Deutsche Bank profits had dropped by 65 percent in the third quarter. Deutsche Bank revealed net profit of €229 million, a decline from the €649 million seen in the same period in 2017. But despite the steep decline, Deutsche Bank officials declared they were still on track to swing to a profit this year, its first since 2014. The German lender has been restructuring under a new leadership as it struggles to rebound after three consecutive years of losses. Chief Executive Christian Sewing said: “We have our costs under control and sufficient capital to grow. “We are on track to be profitable in 2018, for the first time since 2014.” Revenue in the third quarter fell 9 percent, to €6.175 billion. Deutsche Bank is currently in the middle of a mass restricting, with 2,800 jobs already cut to bring headcount to 94,717. The aim is to drag this number to below 90,000 by the end of this year. The bank predicts a saving of €900 million by 2022 through restructuring, including the merging of the head office and infrastructure. But the bank has very large exposures to derivatives, especially interest rate related, and given the uncertainly around Brexit, the FED and other factors, its risk on at the moment.
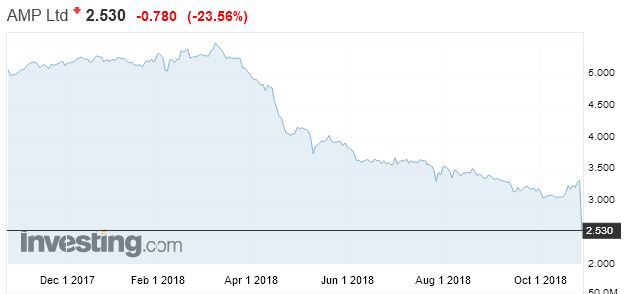
So to the local markets. Among the banks, most were up a little on Friday, having dropped the day before. CBA was up 0.83% to end at 65.81, NAB was up 0.69% to 24.70, Westpac was up 0.46% to 25.96 and ANZ was up 0.44% to 24.91. The Regionals also bounced a little with Bendigo and Adelaide Bank up 1.42% to 9.90, Suncorp up 0.28% to 13.65 and the Bank of Queensland up 1.17% to 9.54, after it had dropped significantly the previous day thanks to going ex. Dividend. Macquarie was also high, up 0.94% to 111.17, but AMP continues to fall as it reported the loss of more customers, despite a fire sale. It ended down another 7.72% to 2.36. Frankly it’s hard to know that value remains there.
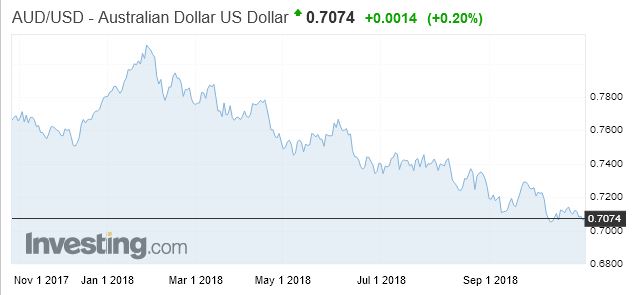
The ASX 200 Financials remains down, well down, though did rise by 0.35% yesterday to 5,554. The local volatility index was down 9.68% on Friday at 20.12, but is still elevated. The Aussie ended at 70.92, at the lower end of its recent range and most commentators expect more falls ahead. Fitch, for example said “We are bearish on the Australian dollar over the near term due to a neutral RBA”, but suggested that may change later. They only expect a 25bps rate hike from the RBA by end-2019, in contrast with 100bps worth of hikes from the US Fed over the same period. The ASX 100 ended up just a little at 0.12% to 4,666, but we might expect more downward moves next week. At very least trading will remain choppy.
To understand why, its worth looking at the ABS data on The Australian Annual National Accounts which show that the size of the economy has reached over $1.8 trillion, reflecting a 2.8 per cent increase in 2017-18. This is up from the $1.2 trillion in 2007-08 in nominal terms.
But household consumption is a large part of the story, contributing 1.6 percentage points, though with incomes and the savings ratio falling, while investment in property is the standout. Households borrowed an additional $981 billion over the 10-year period from 2007-08, while the value of land and dwellings increased by $2,957 billion over the same period. No wonder the regulators want to maintain the credit bubble. Household gross disposable income plus other changes in real net wealth decreased $634 billion, or 33.3%, in 2017-18, thanks mainly to falling property values. Expect more falls ahead. This shows that our economic settings are just plain wrong. Yet I suspect more of the same ahead. And note this, The Annual National Accounts also include labour productivity by industry estimates, which are only available annually. Australia’s labour productivity rose by 0.2 per cent, recording the lowest rise since recording a fall in 2010-11. Agriculture, mining and utilities industries all recorded falls in labour productivity while services industries such as finance, professional, scientific and technical services as well as administrative support services were more productive.
So the property market. CoreLogic reported that last week, the weighted average clearance rate came in below 50 per cent for the 3rd consecutive week with 47 per cent of capital city homes selling. There were 1,851 homes taken to auction, having increased on the 1,817 auctions held over the week prior when the clearance rate was 49.5 per cent. One year ago, 67.1 per cent of capital city homes cleared at auction, when volumes were considerably higher (2,525).
Melbourne’s final auction clearance rate showed further softening last week, returning a 50.4 success rate, surpassing the previous week as the lowest recorded since December 2012 (50.6 per cent). Volumes across the city were relatively stable week on week, with 912 homes taken to auction; only 8 more than the prior week. Clearance rates across the city are now down around 20 per cent on last year, when over the same week a higher 1,223 homes were taken to auction and 73.2 per cent cleared.
In Sydney, the final clearance rate fell last week, with 45.1 per cent of the 647 homes taken to auction selling, down from the 46.1 per cent over the week prior when 611 auctions were held. One year ago, a higher 928 Sydney homes were taken to auction with 63.3 per cent successful.
Across the smaller markets, Canberra came in with the highest clearance rate last week with 59.6 per cent of the 67 auctions held returning a successful result. Brisbane saw the highest number of homes auctioned, with 117 held, however only 28.6 per cent sold.
There are 2,009 capital city homes set to go under the hammer this week, increasing on last week’s 1,851 auctions held as at final figures, however, lower than the 2,519 auctions held over the same week last year. Melbourne will see 1,020 homes auctioned this week, rising from the 912 auctions held last week, and lower than the 1,251 homes taken to market one year ago. Activity is set to remain steady across Sydney this week, with a total of 640 properties scheduled for auction, down only 7 auctions from final figures last week. One year ago, 823 Sydney homes went to auction. Across the smaller markets, Adelaide will see the most notable increase in weekly volumes, with 124 scheduled auctions this week, increasing from the 72 held last week. Canberra and Perth are also expected to see a higher volumes of auctions take place this week, while Brisbane and Tasmania will see fewer auctions held.
More are getting twitchy about the property sector, with both Mirvac and Stockland now selling off land sites in Sydney and Melbourne, to reduce risks, according to a report in the Australian. Then there was the latest HIA-CoreLogic land report, which on one hand reported that there was a 15.5% annual increase in the median capital city lot price to an all-time high $336,124, despite a 22% slump in sales volumes and broader housing market weakness. Land supply is clearly an issue, but with demand weakening, these high prices may not be sustainable. This was brought home in the latest from Ernst and Young, which warns that developers are in for a bumpy ride. the combination of falling prices and tightening lending standards has had negative implications for not only developers but also builders and lenders, noting slowing project and land sales may affect the timing of cash flows and payments, leaving developers vulnerable in the medium-to-long term. Thus, declining land values may impact loan-to-value ratios and require developers to generate more or new equity to get new projects off the ground while declining sales and revenues from projects may not cover returns to equity and debt holders. This could lead to an increase in ‘fire sales’ which will re-set the market and cause further concern from a finance perspective.
Meantime both Domain and CoreLogic reported more price falls. CoreLogic said their weekly index has dropped 0.05%, across the main centres, but with Melbourne down 0.12%. We think Melbourne is at risk now. Domain released its State of the Market Report for the September quarter of 2018, which revealed that Sydney and Melbourne house prices fell, down 3.1% and 3.9% respectively over the quarter. Nationally house prices were down 2.6%. But of course there are variations by post code and property type. Averages tell you very little. And remember it’s the “equity” being eroded, if you have an 80% Loan to value, last year, you could easily have lost half now. The banks benefits, home owners with a mortgage do not!
S&P’s latest SPIN index, the measure of defaults on Residential Backed Mortgage Securities for August was mixed. The read was 1.36% in August, down from 1.38% in July. Arrears have typically decrease month on month in August for the past five years. At 1.36%, however, arrears are noticeably higher than the August average for the past five years of around 1.13%, though they remain low overall. They say there has been an ongoing increase in home loans that are more than 90 days in arrears. Loans more than 90 days past due reached 0.74% in August, making up around 54% of total arrears. This is up from 42% five years ago. This is consistent with our mortgage stress data, more households getting into more financial difficulty. Regional bank mortgage originators reported the highest percentage of loans more than 90 days in arrears in August, at 1.33%, followed by the major banks, at 0.99%. Some of the increase is due to geographic influences. This is most evident in the regional bank portfolios, which have a 35% exposure to Queensland, compared with 28% for the entire RMBS prime portfolio, and 18% exposure to Western Australia, compared with 11% for the entire portfolio. The downturn in the mining sector and an ongoing drought in agricultural areas are placing pressure on mortgage payments in Queensland and Western Australia.
They concluded “We expect falling house prices to put further pressure on mortgage arrears in coming months. Borrowers with higher loan-to-value (LTV) ratios are more likely to be affected by softening property prices because they have not had time to build up equity or accumulate mortgage buffers. This could tip some borrowers into a negative equity position, which would significantly impede their refinancing prospects in the current lending environment. Across all RMBS loan portfolios we expect borrowers with LTV ratios of 80% and higher to be most at risk. These loans account for around 13% of RMBS loan portfolios.
Negative Equity could become a big issue if prices do continue to fall. We ran some modelling for the AFR reported today, with 350,000 households at risk if prices fell peak to trough by 20% (which is not our worst case scenario). They even created an interactive tool, using our data. “Comparison site RateCity illustrates the impact of a 20 per cent fall during the two years to December 2019 depending on when a property was purchased. A median-priced Sydney house of $745,000 bought in 2013 with a 10 per cent deposit would have an estimated value of $836,000 in December 2019, a profit of nearly $44,000 and estimated loan to value ratio (LVR) of 71 per cent, according to RateCity. A median-priced house in Sydney worth $930,000 in December 2015 with the same deposit would by the end of next year be worth $836,000 –a loss of more than $154,000 if sold or a LVR of 93 per cent. The same property purchased for $1.05 million in December 2017 would on these numbers sell next December for a loss of $278,000. These estimates do not include interest paid, loan mortgage insurance, stamp duty, moving costs, marketing and legal expenses, which can add another 10 per cent to the cost of purchasing a property.
This week there was a silly report from the Master Builders, claiming to model the impact of Labor’s proposed changes to negative gearing. They claimed it would cause major falls in home prices, and rises in rents, and kill the construction sector, but failed to model in the “minor” fact that Labour would grandfather existing gearing arrangements, and still provide support for new developments. In fact, Macquarie debunked the modelling in short order, and concluded there would be but a small impact, following through to GDP. In fact, we think this is the ideal time to bring in such a reform, when property investors are on the side lines. In fact it might well stimulate new builds.
And more poor arguments, were abroad this week, as people tried to head off the Royal Commission outcomes before they are delivered. We made a submission on the interim report, and you can watch our Video on this.
But, amazingly, Treasury secretary Philip Gaetjens told a Senate estimates hearing in Canberra on Wednesday that a key risk to Australia’s strong economy is banks cutting their lending too much in response to the Royal Commission into financial services and tougher credit rules imposed by the prudential regulator. Amid complaints from small business and home buyers that they are finding it harder to attain finance, Mr Gaetjens said a tightening of credit conditions could constrain household consumption and business investment. “There is also some evidence of a modest tightening in lending standards by banks which could be limiting access to credit for some borrowers who may previously been able to borrow,” he said.
And the RBA is at it too “The Reserve Bank of Australia and Treasury have privately cautioned the Morrison government that any regulatory response to the financial services Royal Commission must be careful to avoid putting the brakes on lending to home buyers and business.”
And in the minutes of its October meeting on monetary policy, the Reserve Bank notes that members discussed the release of the interim report of the Royal Commission into Misconduct in the Banking, Superannuation and Financial Services Industry. “The report contains many questions covering a broad range of issues, but at this stage provides relatively little indication of the recommendations that are likely to be made in the final report,” the minutes said “Members observed that while the regulators had already overseen a tightening of lending standards, and a degree of tightening of lending standards had been implemented by banks in anticipation of the commission’s findings, it was possible that banks could tighten lending conditions further given the issues raised in the report. “Members noted that it would be important to monitor the future supply of credit to ensure that economic activity continued to be appropriately supported.”
Now let’s be clear, a decade of too lose lending has to be brought under control. The Royal Commission has done a great job in shining a light into the dark places, and it’s not pretty. And yes the banks are now tightening their lending criteria. Rightly. The last think we need is a reversion to this bad practice. Loans need to be suitable and fit for purpose, and affordable.
This does put pressure on the overall economy though, because this poor lending which drove household consumption and home prices plus construction, will ease, and we do not have a Plan B for economic success in an uncertain world. But reverting to Plan A, just ease lending restrictions is NOT the answer, and we hope the Royal Commission remains true to its focus on Community Expectations. We should demand more from Treasury and the RBA, but then they are caught in a trap of their own making.
And by the way you value the content we produce please do consider joining our Patreon programme, where you can support our ability to continue to make great content.
AFG Mortgage Index figures released today show the country’s lending in a holding pattern with first home buyers the only category of buyer to record an increase for the first quarter of the 2019 financial year. Of course the AFG data only shows their own channels, but its a good indicator nevertheless.
The volume of mortgages processed by AFG declined 2% on the prior quarter. AFG brokers lodged 27,900 mortgages during Q1 19, totalling $14.2 billion, compared with 28,883 mortgages and $14.5 billion in the final quarter of the 2018 financial year.
AFG CEO David Bailey explained the results: “As the Financial Services Royal Commission continues to rattle the market Australian homebuyers are feeling the pinch as lenders tighten their borrowing criteria. Compared to the same quarter last year, lending volumes are down by just under 5% – a sure sign of a tightening market. The availability of credit has impacted investors most of all, with that category dropping by 1% to 27% of loans processed.
Refinancers were steady at 23% and Upgraders were also static at 43%.
New South Wales and Victoria are both down on the prior quarter, 2.5% and 6% respectively. Queensland also recorded a drop across the quarter, down 2%. Gains were recorded in SA – 2% up on last quarter, NT – up 22% and WA with an increase of 6% for the quarter.
Loan to Value Ratios (LVR) have increased in SA, NSW and WA.
The national average loan size has increased to a record $509,736, led by increases in average loan sizes in NSW, SA and Victoria.
“NSW has recorded an increase in average loan size of 3%, which we suspect is the result of a drop in apartment sales and lenders tightening criteria to investors – which are usually a lower average loan size. Both factors are driving up the average overall loan size in that state.
During the quarter many lenders moved to increase interest rates independent of the RBA, causing many borrowers to rethink their arrangements. “With the recent round of rate rises flowing through, many consumers have been speaking with their brokers to discuss the value of fixing all or part of their loans,” he said.
“Fixed rates have risen to 18.9% of loans by product category, whilst standard variable loans dropped to 64.3%. Basic variable products are also back in favour, increasing to 11.2% of all loans.
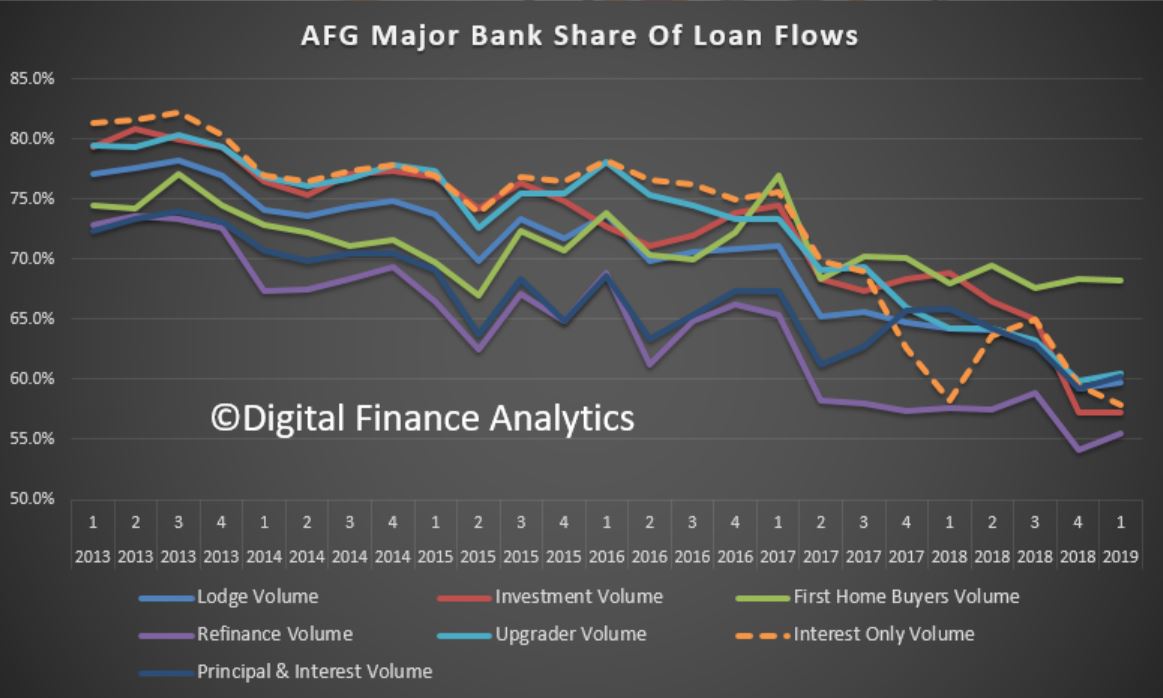
The major lenders clawed back some market share during the first quarter of the new financial year to now be sitting at 59.8%. This figure is still well below the high 70’s they had back in 2013, and much lower than they record outside of the third-party channel.
“The major lenders took some share from the non-majors after treading cautiously for the prior two quarters. The non-majors are still sitting at near historical highs with 40.2% market share after peaking at 40.8% last quarter.
“This is further evidence of the value brokers deliver to competition in the Australian lending market. Refinancers (55.5%) and Upgraders (60.5%) are favouring the competitive offers available from the non-major lenders.
Economist John Adams and I discuss the $250,000 limited bank deposit guarantee which applies to Australian banks under the Financial Claims Scheme. It is more complex than it looks!
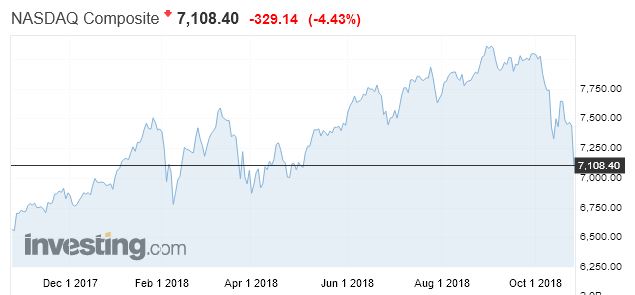
The US market fell last night with tech stocks hit very hard, and the negative sentiment haunted our markets today. The NASDAQ fell 4.43% to 7,108, and has now moved more than 10% off its highs – so officially a correction.
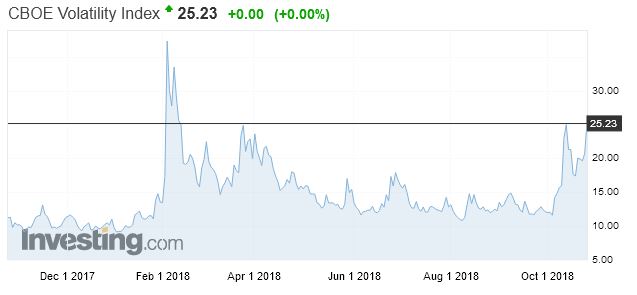
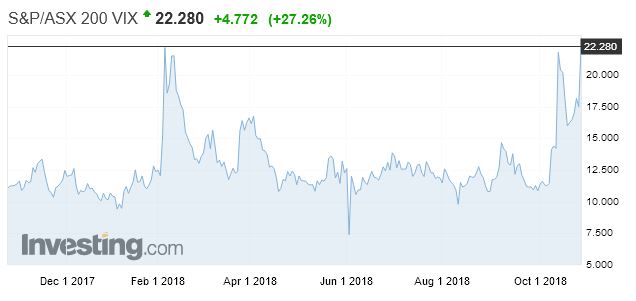
The fear index was up to its recent highs again, at 25.23
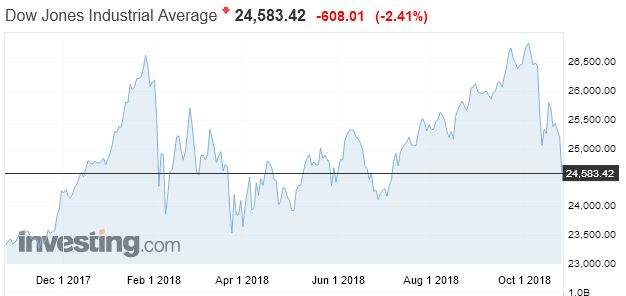
And the Dow Jones fell 2.41% to 24,583. Actually most of the news was old news, with the expectations of a higher US interest rate and fall out from the Trade wars. But sentiment went negative again.
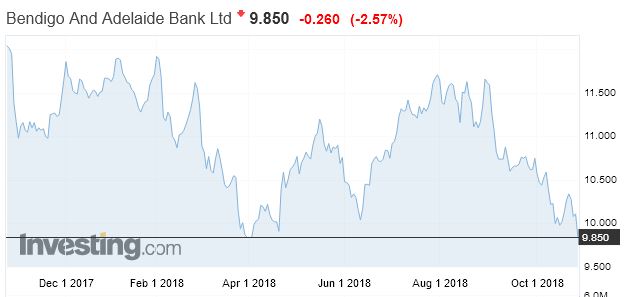
So no surprise the local market was hard hit in choppy trading today. The banks felt the pain. For example, Bendigo and Adelaide Bank fell 2.57% to 9.85,
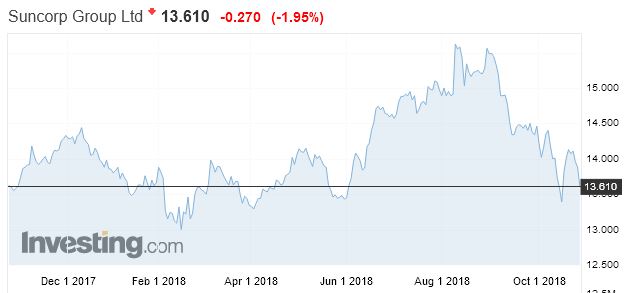
Suncorp dropped 1.95% to 13.61
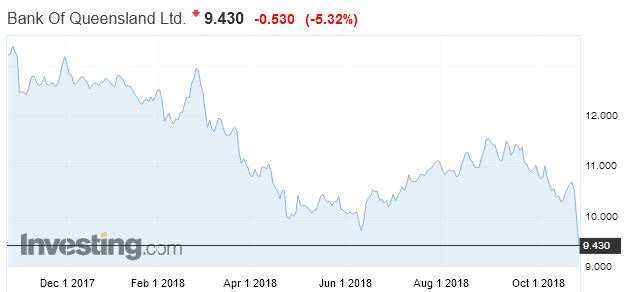
and Bank of Queensland dropped 5.32% to 9.43.
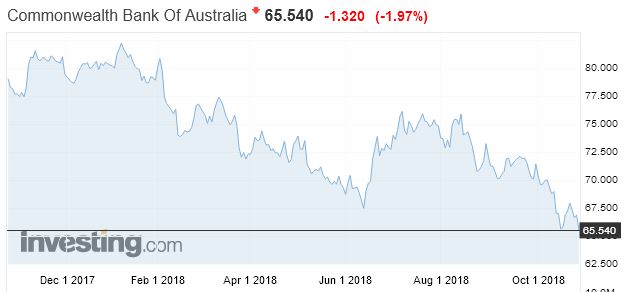
Falls were seen across the sector, with CBA down 1.97% to 65.54.
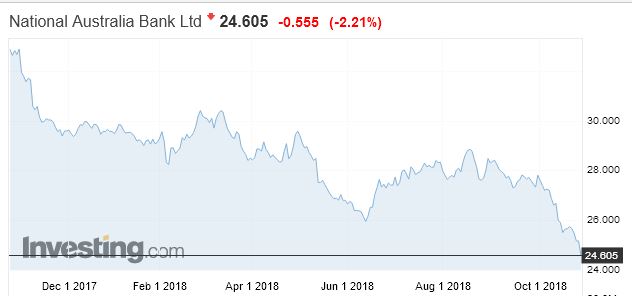
National Australia Bank down 2.21% to 24.61
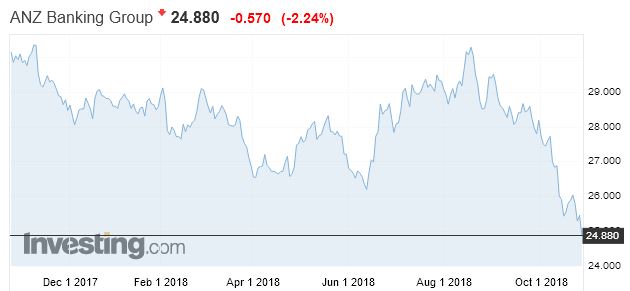
ANZ down 2.24% to 24.88
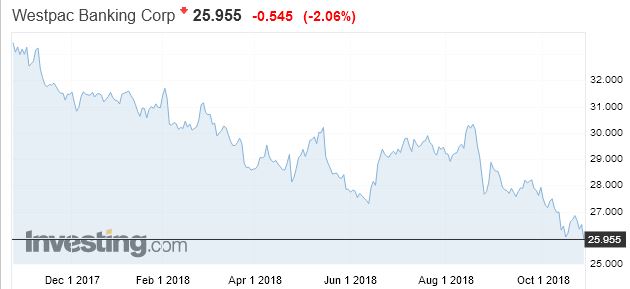
And Westpac down 2.06% to 25.96.
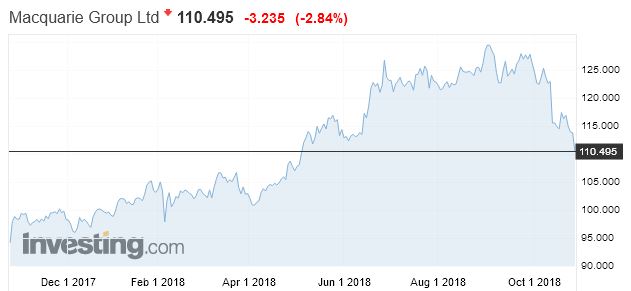
Macquarie, with its international exposure fell 2.84% to 110.46
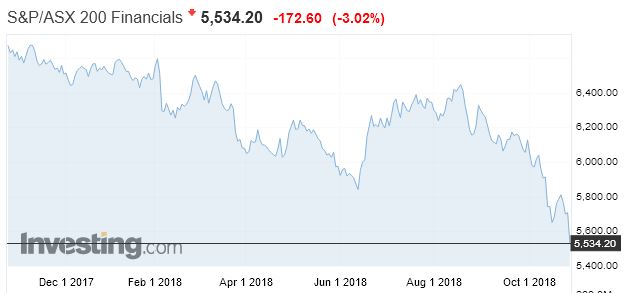
And the ASX Financials fell 3.02% to 5,534.
The Aussie ended at 70.74 against the US dollar, at the low end of the range and
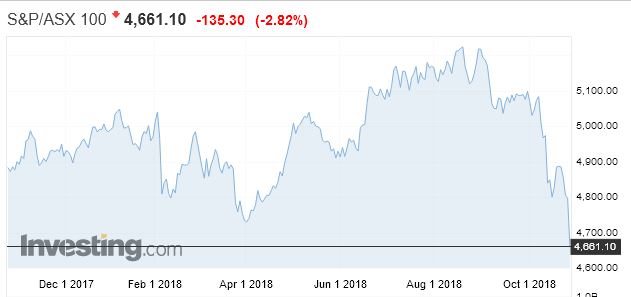
The ASX 100 ended down 2.82% at 4,661.
The local fear index was up again to recent highs
But AMP was hit hard, thanks to their announcement today of further divestments. Timing is everything! “AMP announced the successful completion of its portfolio review including an agreement to divest its Australian and New Zealand wealth protection and mature businesses (AMP Life) and reinsure New Zealand retail wealth protection for total proceeds of A$3.45 billion”.
Tomorrow will be another day, will prices bounce or fall further?

 ANZ’s Common Equity Tier 1 Capital Ratio was 11.4% up 87 basis points (bps). Return on Equity decreased 67 bps to 11.0% with Cash Earnings per Share down 4% to 223.4 cents (continuing). The Final Dividend is 80 cents per share, fully franked, bringing the Full Year Dividend to 160 cents.
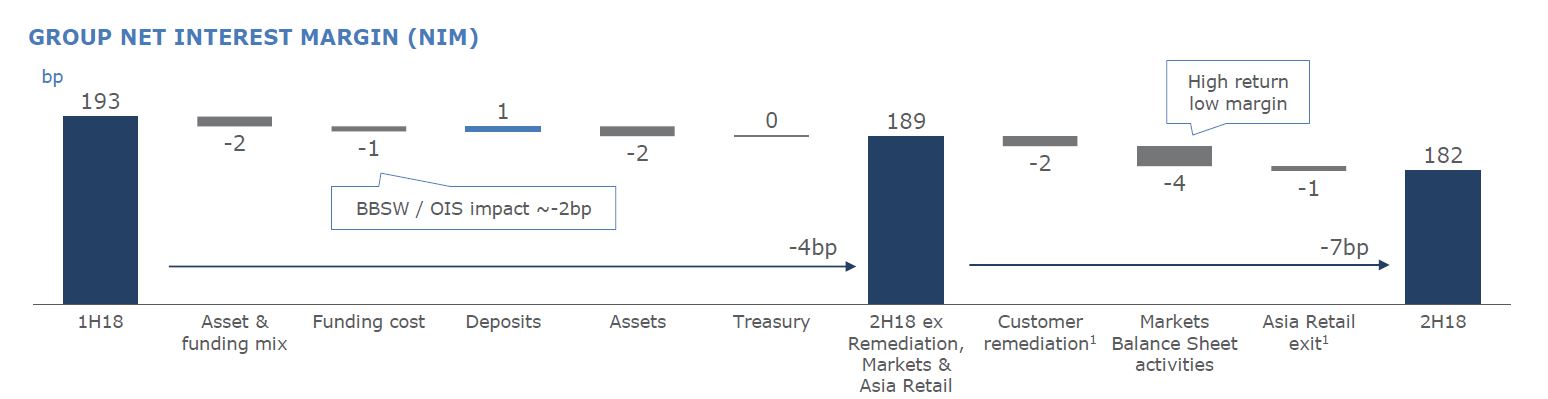 The results were supported by the $3 billion share buy-back and the neutralisation of the full year dividend reinvestment plan. They reduced variable remuneration paid to staff this year across the bank by $124 million and are undertaking the urgent work required to fix the failures that have been highlighted by the Royal Commission.
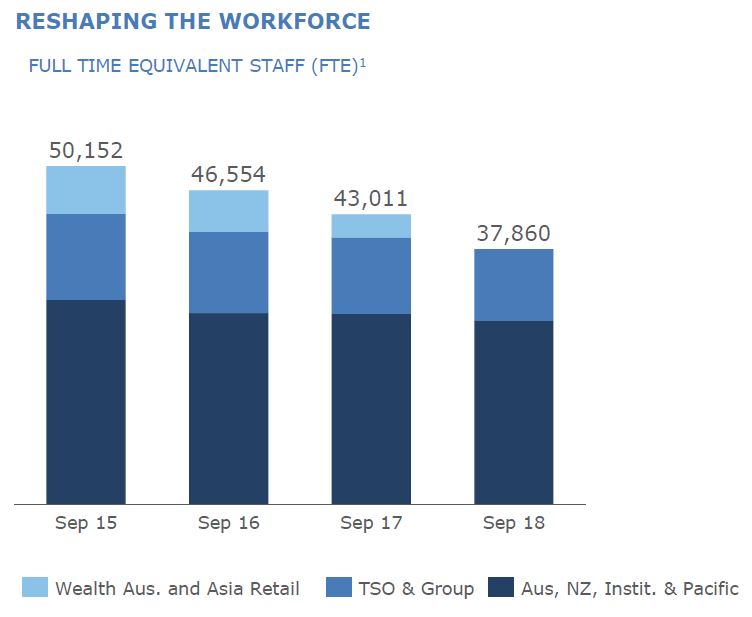 As a result, costs were lower, despite significant technology investments.
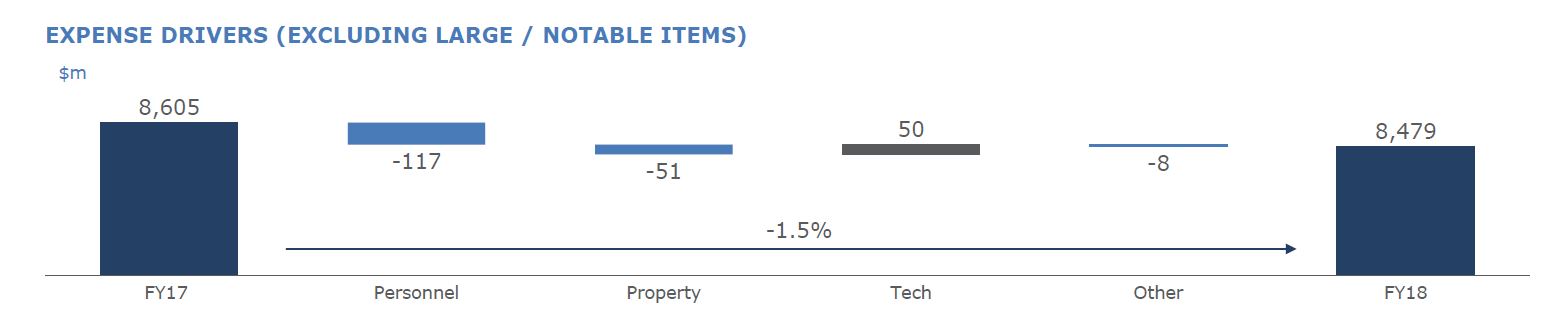 The total provision charge for the year was $688 million down 43%.
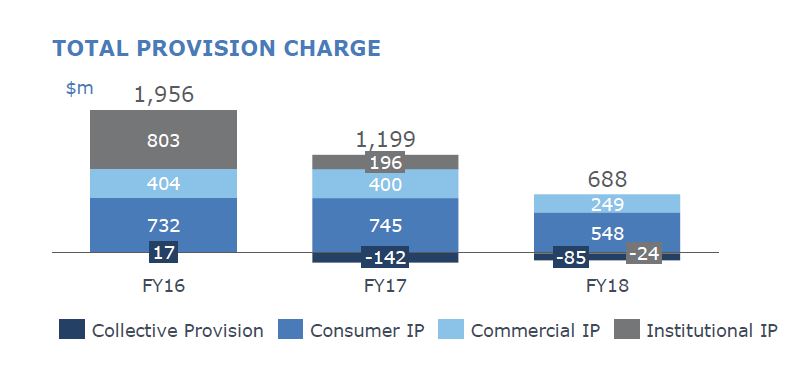 Looking at the Australian Home Lending portfolio, they say 72% of households are ahead on repayments. They hold more loans above 95% than 90% in their portfolio.
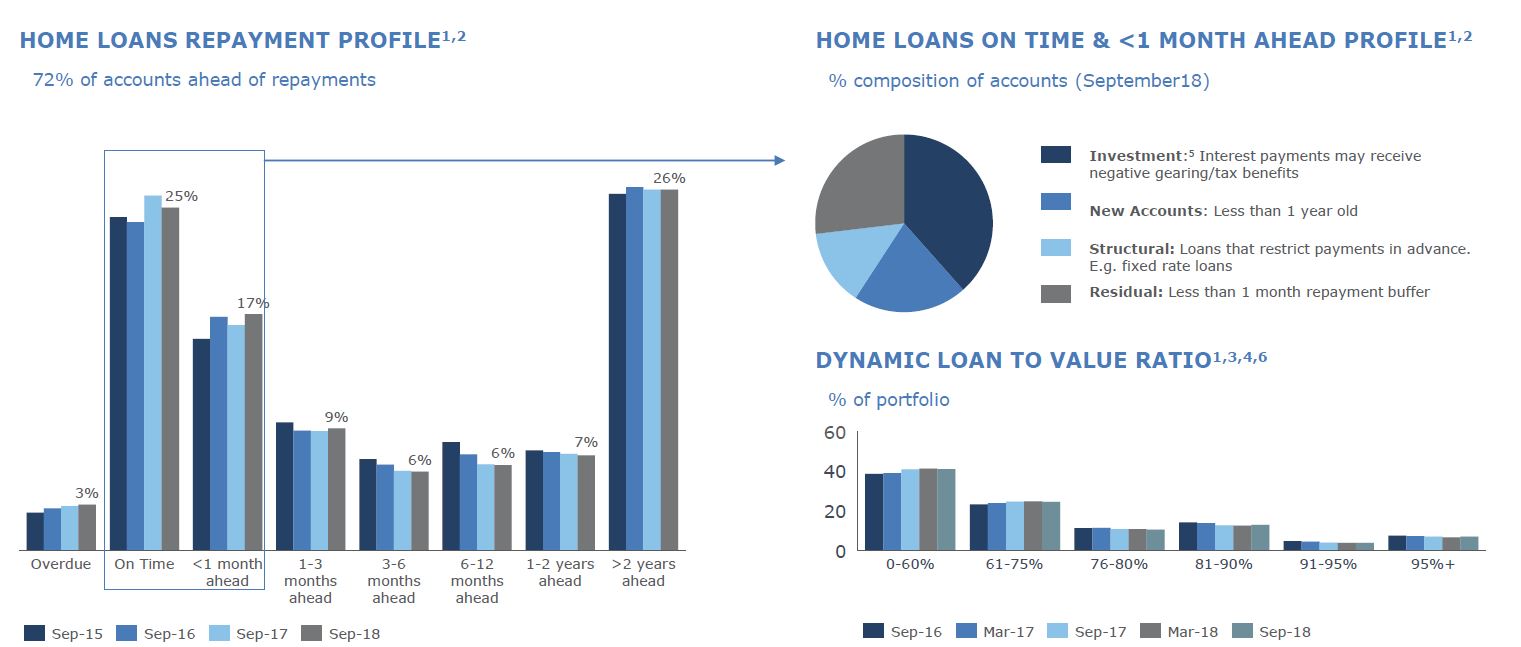 Australian Home Loan 90+ Delinquencies were higher, especially investor loans, rising from 0.84% in September 2017 to 0.86% in September 2018.
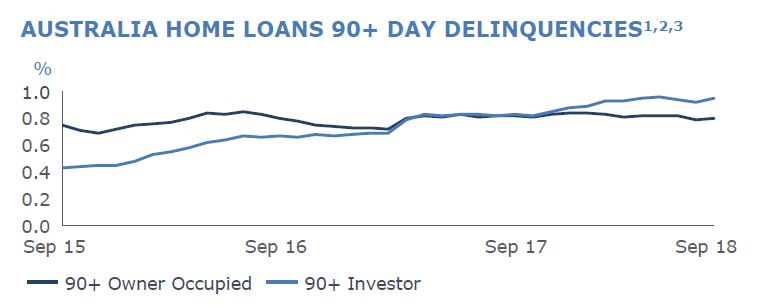 WA continues to show more 90+ delinquency, and WA is 13% of funds under management, but 33% of 90+ and over half of portfolio losses. This shows the long slow drag on performance from a slowing economy.
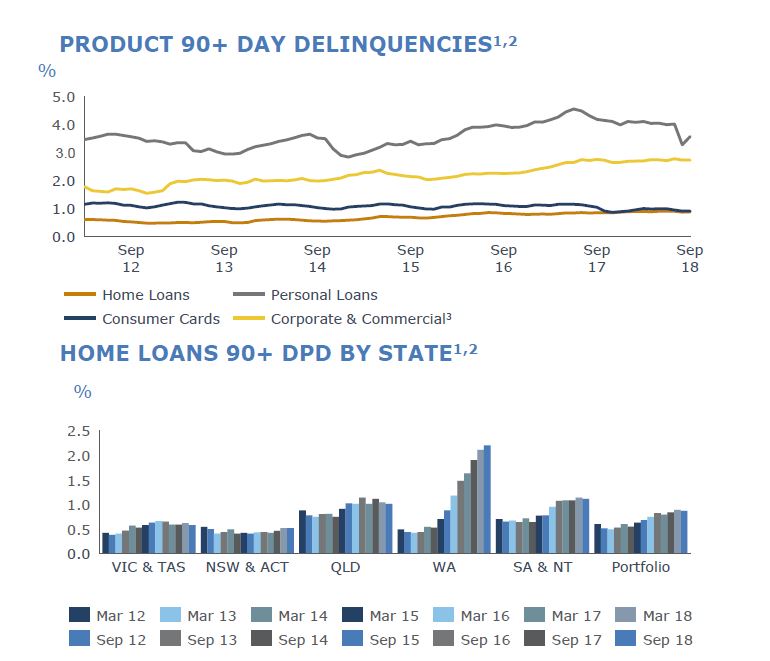 They also increased their exposure to commercial property, with apartment development limits up 17% to ~$4 billion, which accounts for ~39% of total residential limits. Inner City apartment limits totalled $0.56 billion and was 14% of the total apartment development limit in FY18, down from 20% in the prior year. This was thanks to developments in Sydney and Melbourne being repaid. They have highest exposure in NSW.
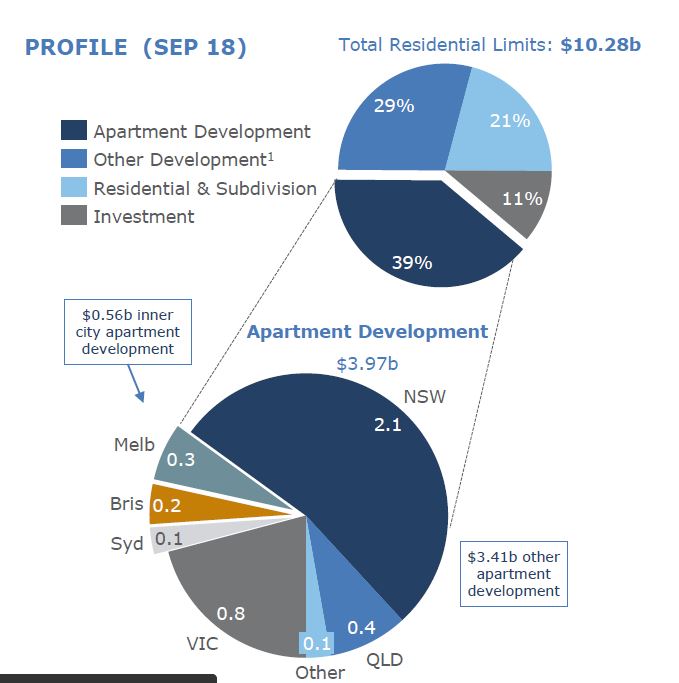 The Group Loss rate reduced to 12 bps with the second half loss rate 9 bps. New Impaired assets declined just over $1.1 billion or 34% with Gross Impaired Assets down 16%. The significant decline in the Group loss rate reflects portfolio credit quality improvement driven by strategic changes to the composition of the asset book, such as the sale of retail and commercial in Asia, together with tighter lending standards and a relatively benign credit environment.
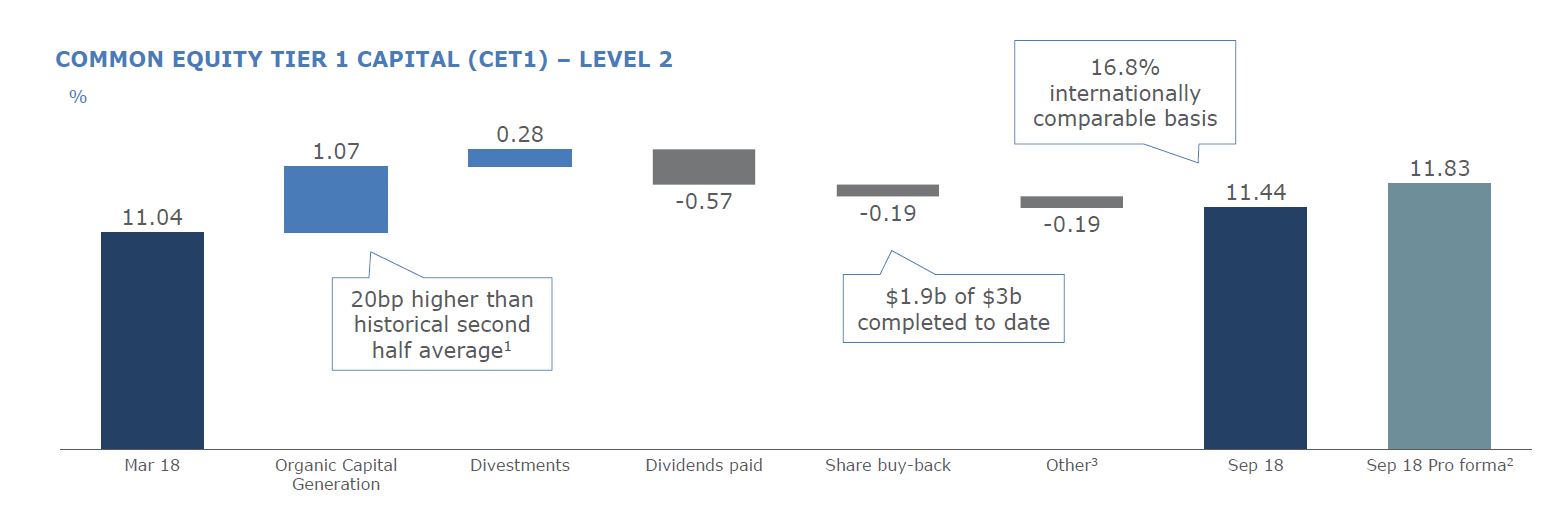 Completed assets sales during the year increased the CET1 position by ~84bps. They commenced an on market share buyback in January 2018 and was increased to $3 billion in June 2018. As at 30 September $1.9bn of this had been completed, representing ~2% of ANZ shares outstanding. They expect the remaining ~$1.1bn to be completed during 1H19.