The RBA released their minutes today relating top the March 2019 meeting. They called out the market’s view that policy rates would be lower in 2020 (a turn around), lower retail, and slowing housing momentum, despite strong employment.
In considering the stance of monetary policy, members observed that growth in the global economy
had been above trend in 2018, although it had slowed over the second half of the year and timely
indicators suggested that this moderation had extended into 2019. Nonetheless, output growth had
remained sufficient in most advanced economies for labour markets to remain tight, putting
upward pressure on wages. Members noted the tension in a number of economies between slower GDP
growth and resilient labour markets. The transmission of tighter labour market conditions to
inflation pressures was taking longer than might be expected, based on historical experience.
The authorities had responded to slowing growth in China by putting in place policies to
increase the flow of credit to the private sector and easing fiscal policy in a targeted way to
support growth, while continuing to pay close attention to risks in the financial sector.
Slowing growth in China and ongoing trade tensions had led to lower growth in global trade, and
continued to be a source of uncertainty for the outlook for global growth.
The tightening of global financial conditions, associated with higher risk premiums required by
investors around the turn of the year, had eased. Members assessed that global financial
conditions remained accommodative, with financial market pricing indicating that little change
to the accommodative stance of monetary policy in the advanced economies was expected over the
following year or so. The terms of trade for Australia were expected to have remained above
their trough in early 2016 and the Australian dollar had remained within its narrow range of
recent times.
Domestically, there continued to be tension between the ongoing improvement in labour market
data and the apparent slowing in the momentum of output growth in the second half of 2018.
Leading indicators of conditions in the labour market, such as vacancies and hiring intentions,
pointed to further tightening in the labour market in the near term. Private sector wages growth
had picked up further in the December quarter, consistent with the Bank’s forecasts and
survey evidence that a significant share of firms were finding it difficult to attract suitable
labour.
Although output growth had slowed in the second half of 2018, the outlook for business
investment and spending on public infrastructure had remained positive. Growth in consumption
was expected to be supported by an increase in growth in household disposable income. However,
there continued to be considerable uncertainty around the outlook for consumption given the
environment of declining housing prices in some cities, low growth in household income and high
debt levels. Dwelling investment was expected to subtract from growth in output over the
forecast period and, unless pre-sales volumes started to increase, this decline could be sharper
than currently expected.
The process of adjustment in the housing market had continued. Housing prices in Sydney,
Melbourne and Perth had declined further, and turnover in the housing market had fallen
significantly. Rent inflation had remained low across most of the country despite declines in
rental vacancy rates over the previous year, except in Sydney, where rental vacancy rates had
been increasing. Credit conditions had tightened for some borrowers and the demand for housing
credit had slowed noticeably as conditions in the housing market had changed. Mortgage rates had
remained low and there was strong competition for borrowers of high credit quality.
Members noted that the sustained low level of interest rates over recent years had been
supporting economic activity and had allowed for gradual progress to be made in reducing the
unemployment rate and returning inflation towards the midpoint of the target. While the labour
market had continued to strengthen, less progress had been made on inflation. Looking forward,
the central forecast scenario was still for growth in GDP of around 3 per cent over
2019 and a further decline in the unemployment rate to 4¾ per cent over the
next couple of years. This further reduction in spare capacity underpinned the forecast of a
gradual pick-up in wage pressures and inflation. Given this, members agreed that developments in
the labour market were particularly important.
Taking account of the available information on current economic and financial conditions and how
they were expected to evolve, members assessed that the current stance of monetary policy was
supporting jobs growth and a gradual lift in inflation. However, members noted that significant
uncertainties around the forecasts remained, with scenarios where an increase in the cash rate
would be appropriate at some point and other scenarios where a decrease in the cash rate would
be appropriate. The probabilities around these scenarios were more evenly balanced than they had
been over the preceding year.
Members agreed to continue to assess the outlook carefully. Given that further progress in
reducing unemployment and lifting inflation was a reasonable expectation, members agreed that
there was not a strong case for a near-term adjustment in monetary policy. Rather, they assessed
that it would be appropriate to hold the cash rate steady while new information became available
that could help resolve the current tensions in the domestic economic data. Members judged that
holding the stance of monetary policy unchanged at this meeting would enable the Bank to be a
source of stability and confidence, and would be consistent with sustainable growth in the
economy and achieving the inflation target over time.
The Decision
The Board decided to leave the cash rate unchanged at 1.5 per cent.
Today we look at the recently confirmed merger talks between Deutsche Bank and Commerzbank.
Will such a merger will really help to resolve the deep structural issues in the Eurozone?
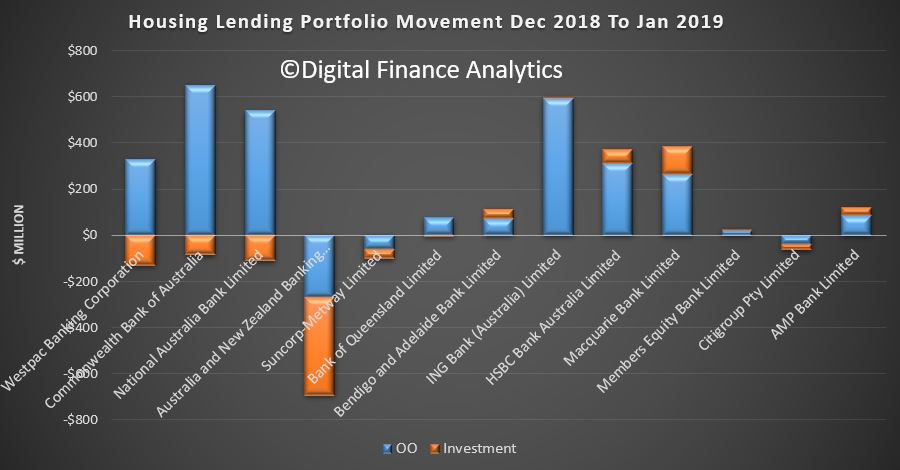
Three banks – two non-major and one ‘big four’ – have announced changes to their loan offerings, several of which cater to customers with a higher LVR, via Australian Broker.
Both Macquarie and ME Bank rolled out home loan rate changes for new customers, while ANZ has implemented changes to its interest-only lending criteria.
“Just when we thought the banks were finding the kitchen a little too
hot, we have seen ANZ and ME Bank move to encourage borrowers at the
higher end of the LVR scale,” said Canstar’s group executive of
financial services, Steve Mickenbecker.
At Macquarie, for both P&I and interest only repayment, owner
occupier fixed rate loans will decrease by 0.09% and 0.20% and
investment fixed rate loans will decrease by 0.05% and 0.10% for 1-, 2-
and 3-year loans.
At ME Bank, owner occupier variable rate loans with principal
repayments, for an LVR of more than 90%, will decrease by 0.80%.
Investment variable rate loans with P&I repayments, for an LVR of
80% to 90%, will decrease by 0.27%.
This means that ME Bank’s P&I home loan will decrease from 5.26%
to 4.46%, potentially saving borrowers tens of thousands in interest
over the life of a longer-term loan.
“The reduction for owner occupiers at the very low deposit end of the
market sounds bullish, but the reduction leaves ME mid range in the
market,” said Mickenbecker.
The changes at both non-major banks went into effect on 15 March 2019.
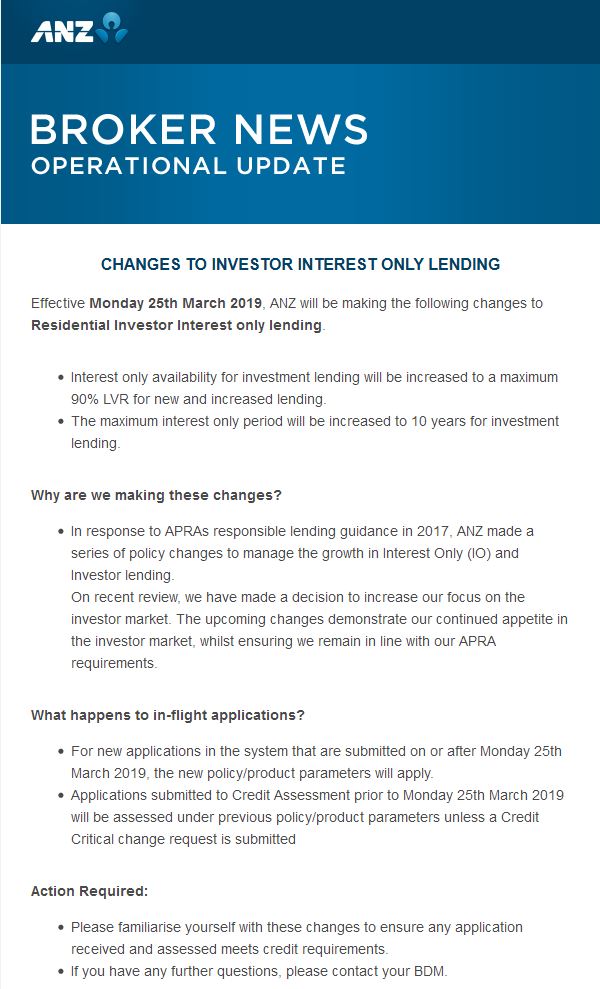
ANZ announced that, as of 25 March 2019, the interest-only loan term
will increase to 10 years, up from five. Additionally, interest-only
loans will have a maximum LVR of 90%, up from the current 80% LVR.
According to Mickenbecker, through raising the LVR by 10%, ANZ is
responding to its “over-reaction to the APRA tightening and is now
moving to restore market share in the slow investor market.”
He continued, “Lengthening the interest only period will provide
attractive differentiation in the market, but also give housing prices
and wages time to recover before repayments have to increase to
accommodate principal reductions. This should also improve customer
retention rates.”
According to Moody’s, on 14 March, the European Parliament voted in favor of a regulation setting minimum loan loss provisioning requirements for nonperforming loans (NPLs). The European Union (EU) regulation aims to prevent the excessive accumulation of soured loans, a scenario that unfolded in several European countries during the global financial crisis. The new rules, which will become effective in the coming weeks, will be credit positive for EU banks.
All European banks will be subject to the same prudential standards. Until now, banks’ provisions were driven by two factors; accounting rules, which were recently amended to make them more prudent and forward-looking (IFRS 9), and supervisory expectations, which the euro-area banking supervisor, the Single Supervisory Mechanism’s (SSM), in March and July 2018 made more explicit by providing qualitative and quantitative guidance.
However, the SSM’s quantitative guidance on NPL coverage (the so-called addendum) has been criticised because the SSM is not empowered to set rules; regulation is the joint responsibility of the European Council (of governments) and the European Parliament.
The new regulation will operate as a backstop to the accounting standard IFRS 9, which can be interpreted in different ways in different jurisdictions. The SSM will continue to have influence over banks’ provisioning decisions in rare instances that it considers the NPL regulation does not provide appropriate coverage.
The regulation directs minimum provisions (prudential provisions) on loans according to a prescribed timetable. The volume of provisions required may vary from the amount computed under IFRS 9 accounting standards.
The new rules categorize banks’ loans as unsecured and secured loans. For secured loans the regulation differentiates between immovable collateral such as property (the highest quality) and other eligible credit protection (the lowest quality). For unsecured loans that move into the NPL category, no provisions would be required for the first two years; a minimum provision of 35% of the outstanding amount would be required during the third year; and 100% coverage should be in place before the end of the fourth year. This final timetable is slightly longer than that originally proposed (100% after two years of nonperformance).
For secured loans, provisioning follows a longer timetable. For loans with the highest quality immovable collateral, the timetable spans nine years, beyond which NPLs must be 100% covered by provisions. For loans with the lowest quality collateral, 100% coverage must be in place by the end of the seventh year after a sound loan is moved to the NPL category.
The new rules will not tackle the outstanding stock of NPLs, but we expect them to have an effect over time. NPLs still are a large proportion of banks’ loans portfolios in several EU countries, including Italy, where we estimate they comprise 10% of total loans. The scope of the NPL regulation, however, is restricted to new loans EU banks extend from the date of implementation. Consequently EU banks’ provisioning decisions on legacy NPLs will still be driven by IFRS 9 accounting rules and guidance from the SSM.
Nevertheless, we expect the SSM’s approach to legacy NPLs will mirror the new regulation, and at some point banks will find it untenable to maintain two parallel provisioning policies.
We review recent changes in central bank policies which will involve another bout of quantitative easing, and the impact on the saver community – a sector which silently are being taken to the cleaners. Why no fuss?
Economist John Adams and Analyst Martin North discuss the trend towards zero interest rates, the removal of cash from circulation, and the use of digital currency to control the system.
Is the black economy initiative all that it seems to be?
Welcome to the Property Imperative weekly to the sixteenth of March 2019 – our digest of the latest finance and property news with a distinctively Australian flavour.
Watch the show, or read the transcript.
The talk is now of more sustained property price falls, the
RBA cutting rates, and risks in the broader economy building. The news just
keeps on coming and reconfirming our central scenarios. That said, it looks like the global economy
will be stoked by more stimulus, for a time, so the question becomes will we be
the first to crack?
Straight into the property markets first, with the CoreLogic Index to 14th
March falling another 0.13% in the past week.
Over the last 12 months, the index has fallen by 8.3%, driven by Sydney,
Melbourne and Perth, and since the last peaks, dwelling values have fallen by
9.4%, led by Sydney (-13.6%), Melbourne (-9.9%) and Perth (-17.8%). And Auction
clearance rates were weak again, on low volumes with the final clearance rate
in Sydney sitting at 52.3% and Melbourne
at 49.2%, while the other states were around 29%, including Canberra. And final auction clearances were still 9.9%
(Sydney) and 21.6% (Melbourne) below the same weekend last year when dwelling
values were also falling. Moreover, auction volumes were also down 28% and 52%
respectively in both Sydney and Melbourne. No signs of a recovery here!
Taking a longer-term view, it’s worth reflecting on Corelogic’s latest
Property Pulse which says that At a national level, since 1980 there have been
eight separate housing market downturns. The current downturn which commenced
after October 2017, has seen values fall by -6.8%. Although that may not seem
like a substantial downturn, since the early 80’s there have only been two
downturns which were larger, 2008-09 and 1982-83. National housing market downturns
have also been generally fairly short-lived with the current downturn of 16
months already the second longest with the 2010-12 decline running two months
longer than the current downturn.
The decline in values throughout the current downturn has been larger
across the combined capital cities, with values now -8.6% lower. By next month,
assuming the falls continue, this will be the largest downturn in the combined capital
city index any time since 1980. The current downturn is also closing in on being
the longest. With values having peaked in September 2017, they have now been
falling for 17 months with the previous longest period of decline coinciding
with the last recession, running for 20 months between 1989 and 1991.
Of course, it’s worth remembering this one is being driven by
right-sizing credit, not rising interest rates or unemployment, but ahead, we
do expect unemployment to turn upwards, and the RBA to cut the cash rate, but
this may not automatically translate to lower mortgage rates. And if credit
supply remains predicated on lower loan to income ratios, and more forensic
analysis of income and expenditure, then prices will indeed continue to fall.
We will get the odd “unnatural act” such as extra first-time buyer incentives,
or ANZ’s loosening of terms for Interest Only loans (which we discussed in
yesterdays post). But unless we go back to the illegal behaviour revealed
through the Royal Commission, and lending standards drop substantially again,
credit will remain tight.
And mortgage arrears continue to trend higher according to S&P
Global Ratings’ latest edition of “RMBS Performance Watch: Australia.”. Arrears on the mortgages underlying
Australian residential mortgage-backed securities (RMBS) have increased year on
year, while prepayment rates have slowed. In particular, arrears that are in an
advanced stage (more than 90 plus days) reached a record high of 0.75% in
December 2018. Arrears in this advanced stage now represent 55% of total loans,
up from 40% five years ago. Prime mortgage arrears have increased to 1.38% in
December 2018 from 1.30% in December 2017. Softening macroeconomic conditions
are likely to keep arrears elevated over the next 12 months given that
borrowers’ refinancing prospects, particularly in the current environment of
tightened lending conditions, are more challenging. While we expect most
borrowers to be able to manage these headwinds, loans in the more advanced
arrears stages are less likely to cure in the current environment they say.
We are watching the apartment market in particular, as demand fades, and
quality of construction question come to the fore. Indeed, the UBS property
round table made the point that “apartments are increasingly out of the money.
That’s where you get settlement issues. What’s happened to buyers now as they
come to settlement, is bank valuations might come in 10 per cent or even 20 per
cent below the contract price and the bank is also probably assessing you with
more stringent expenses potentially hair-cutting any bonus or commission or
other income a bit more. As they reassess you on tighter lending standards you
might find that your borrowing capacity is significantly reduced particularly
if you are a repeat buyer who already has other debts and they are realising
that you are already on six or seven times debt to income.
And there are signs of construction of existing tower stalling,
according to the AFR. “An analysis by
The Australian Financial Review of Cordell/CoreLogic data showed about 21,000
out of about 36,000 approved apartments in Melbourne worth about $6.5 billion
over the two years have been categorised as “deferred” or “possible” but have
not firmed up to go ahead. In Sydney, just over 10,000 out of 26,000 units with
an end value of about $3 billion are in the same boat. And data from
construction information provider BCI Australia confirmed the pattern in Sydney
and Melbourne, adding that the ACT was the only state where almost all
approvals in 2015 – while much fewer than NSW and Victoria – proceeded to
construction.
Indeed, we are seeing a smattering of building companies now. As the ABC
reported, Two more South Australian building companies are facing collapse amid
ongoing pressure from the national housing downturn. An application to wind up
Cubic Homes, based in Kilburn, will be heard later this month and JML Home
Constructions, which operates the Onkaparinga GJ Gardner franchise, has closed
its doors. It follows the recent demise of a string of local companies,
including ODM Group, OAS Group and Platinum Fine Homes. Master Builders SA
chief executive Ian Markos said low population growth, reluctant bank lending,
planning laws and inefficient land release had created a perfect storm.
And something else to bear in mind is the rise of AirBnB type short term
letting. As the New Daily reported, “Airbnb spends a lot of time saying they
have no impact on markets. What this paper shows is that they do,” University
of Sydney professor, Peter Phibbs said, referring to the recent RBA
modelling. The RBA report found that vacancy rates are the
“strongest predictor” of rents, Professor Phibbs said, and while that in itself
seems “pretty obvious”, it also shows the conversion of long-term rental stock
into Airbnb-style tourist accommodation is reducing rental stock, and subsequently
reducing vacancy rates. “Hobart is the standout because they have the lowest
vacancy rates in the country and they’ve probably also got the highest uptake
of Airbnb”.
We know from our surveys that household are expecting home prices to
fall further, as revealed in our latest data out this week – see “What Are Households Thinking Now?” Demand
for credit is easing, too. And we know from our earlier surveys that mortgage
stress is rising as income remain constrained as costs rise. WA is being hard hit, as reported in the West
Australian. “In January and February alone, 112 people sought help from Legal
Aid WA after defaulting on their home loan repayments, more than a third of the
number of people who sought assistance in 2018. The 2018 figures saw Legal Aid
support 301 people — a 550 per cent increase from 2013 when only 46 people
required help. The dramatic jump in cases has prompted Legal Aid WA to launch
outreach facilities of the Statewide Mortgage Hardship Service in three
locations in Perth’s worst affected suburbs.
LAWA’s director of civil law Justin Stevenson said… “Concerningly the
ongoing financial hardship in the West Australian community, with a sustained
softening of property prices, unemployment and an end to interest-only loans
mean we are only going to see more struggle to pay their mortgage in 2019…
Without assistance from LAWA, homelessness is a real consequence for these West
Australians”…
Meantime, the economic indicators worsen. For example, Roy Morgan’s
alternative unemployment indicators of 9.6% for February is significantly
higher than the current ABS estimate for January 2019 of 5.0% although Roy
Morgan’s under-employment estimate of 8.6% is comparable to the current ABS
underemployment estimate of 8.1%. According to the ABS definition, a person
who has worked for one hour or more for payment or someone who has worked
without pay in a family business, is considered employed regardless of whether
they consider themselves employed or not. The ABS definition also details that if a
respondent is not actively looking for work (ie: applying for work, answering
job advertisements, being registered with Centre-link or tendering for work),
they are not considered to be unemployed. The Roy Morgan survey, in contrast,
defines any respondent who is not employed full or part-time and who is looking
for paid employment as being unemployed. Since Roy Morgan uses a broader definition
of unemployment than the ABS, it necessarily reports a higher unemployment
figure. In addition, Roy Morgan’s measure tends to be far more volatile, owing
to the fact that it draws on a smaller sample than the ABS and is not
seasonally adjusted.
The impact of the Royal
Commission into the Financal Services sector continues to be watered down, as Josh
Frydenberg walked away from his plan to ban mortgage broker trailing
commissions, pushing the issue to a review in 2022. The Treasurer said the
government had backflipped on its crackdown on the industry because it wanted
to keep competition in the mortgage market, amid concerns that only the largest
banks could afford to pay steeper bonuses to brokers. The issue will be
reviewed in three years if the Coalition remains in power by the Australian
Competition and Consumer Commission and the Council of Federal Financial
Relations. There is a real issue of competition, here, but remember the
underlying issues is the conflict arising when a Broker is paid more for
recommending a larger loan. Once again, consumers loose to political
expiedency!
And the data this week continues the bad news, as nicely summarised by
Westpac. Markets are now giving about a
50% chance of an RBA cut by June, up from a 40% chance immediately following
the December quarter GDP release. Westpac continues to favour moves coming
later in the year – August and November the likeliest timing – with the Bank
still seeming reluctant to cut and likely to require more evidence around the
‘consumer-housing nexus’ and the labour market outlook before taking action.
The NAB business survey indicates that both business conditions and
business confidence weakened in February – with both at below average levels.
The business conditions index fell by 3pts to +4, down sharply from the average
+18 read over the first half of 2018. Business confidence also fell by 2pts to
+2. We see the soft business update as a significant development. The February
read is less affected by holiday season volatility, and is a clearer
confirmation that the sharp loss of economic momentum since mid-2018 has
extended into 2019. That is consistent with Westpac’s view of GDP growth
running at a below trend 2.2% pace in 2019. The detail shows particularly weak
conditions for retail, the December–February period marking the weakest three
month run since 2013, and construction which saw conditions dip into
contractionary territory. The state breakdown continues to show a sharp loss of
momentum in NSW and Victoria. All of this is consistent with increasing
negative spillovers from the Sydney and Melbourne housing corrections. Importantly,
the shift is clearly starting to affect businesses willingness to hire and
invest. While the employment component of the survey moved sideways in the
February month, at +5 it continues to show a clear easing from the +11 averaged
over the first nine months of 2018. Meanwhile, the March survey points to
downside risks around investment, with capacity utilisation falling to below
average levels and capital expenditure plans down to a three year low.
Consumer confidence is also starting to falter. The WestpacMelbourne
Institute Consumer Sentiment Index fell 4.8% to 98.8 in March from 103.8 in
February. The move takes the index back below 100, indicating pessimists again
outnumber optimists, in contrast to the ‘cautiously optimistic’ reads that
prevailed throughout 2018. At 98.8, the index is still only ‘cautiously
pessimistic’ and comfortably above the average level recorded in 2017. However,
the March fall looks likely to be sustained with the survey detail indicating
the poorer run of economic news is starting to weigh more heavily. Indeed,
responses collected after the March 6 GDP release were much weaker, consistent
with an Index level of 92.7. We suspect that the national accounts release
clarified what were previously somewhat mixed signals about the extent of
Australia’s growth slowdown. As such this aspect of the March weakening in
consumer sentiment looks likely to be sustained. Other aspects of the March
consumer sentiment survey also suggest the shift is starting to have a bearing
on decisions. Job loss concerns rose sharply in the month, the WestpacMelbourne
Institute Unemployment Expectations Index recorded an 8.9% jump, indicating
more consumers expect unemployment to rise in the year ahead. Responses to
additional questions on the ‘wisest place for savings’ also show risk aversion
rising to extremely elevated levels. Two thirds of consumers favouring safe
options – bank deposits, superannuation or paying down debt – and just 17%
nominating risky options such as real estate and shares. The mix is more risk
averse than at the height of the global financial crisis.
We can assume significant stimulus in the upcoming budget, but then that
could all get swept away with an election due soon after and the chance of a
change to Labor, which would reset the agenda to some extent. So its safe to
say, we just keep on keeping on.
So to the markets.
A wave of green washed over U.S. stocks after on Friday,
led by technology companies, as a report on progress in U.S.-China trade talks
lifted sentiment, pushing the S&P 500 to its best week since November. The
Dow racked up gains on Friday, snapping a two-week losing streak.
China’s state-run Xinhua news agency said Washington and
Beijing were making substantive progress on trade talks, providing relief after
news that a summit to seal a deal between the two sides would not happen at
March-end. Many investors expect a deal will eventually happen.
But U.S. data showed manufacturing output fell for a second
straight month in February and factory activity in New York state was weaker
than expected this month. That followed a batch of weak data this week that
lent support to the Federal Reserve’s dovish stance on future interest rate
hikes.
The S&P 500 posted its best weekly gain since the end
of November and Nasdaq had its best weekly gain so far this year. For the week,
the S&P 500 was up 2.9 percent, the Nasdaq was up 3.8 percent, and the Dow
was up 1.6 percent.
Brexit of course rumbled on with the date extended but
little else firming up. And in China, Policy targets announced at the start of
China’s 13th National People’s Congress (NPC) on 5 March underscore the policy
challenges facing the government as it seeks to support growth without adding
significantly to economic imbalances. The 2019 GDP growth target was lowered to
6%-6.5% from “around 6.5%” in 2017 and 2018, and against actual
growth outturns of 6.9% and 6.6%, respectively.
As Fitch pointed
out, the adoption of a lower growth target reflects, an acceptance by the
government that medium-term growth is slowing, to perhaps a medium-term
potential growth at around 5.5%, a significant decline from historical trends
as the economy rebalances towards consumption and away from capital
accumulation. Import growth turned negative in yoy terms at the end of 2018,
reflecting a slowdown in domestic investment and private consumption. The official
manufacturing purchasing managers’ index dropped to its lowest in three years
in February to 49.2, a third consecutive month below 50, indicating contraction.
As Australia’s major trading partner, this could impact the local economy
ahead.
So, standing back, it seems to me that international markets are being
supported by hopes of more stimulus and trade agreements, which then puts the
acid back on the local Australian economy. In fact it may be that Australia
becomes one of the first victims of this current economic cycle, and the fact
is, most of the risk has been created by poor government, and policy failure.
There is no blaming some third party, this is a home based problem – in every
sense of the word.
Finally, a quick
reminder that our next live event will be on Tuesday 19th March at
20:00 Sydney time. As usual we will take questions live via the chat, or ahead
of time. You can send me questions via the DFA Blog. I look forward to seeing
you then.
ANZ have announced a new flavour of interest only loans. They said that from 25th March 2019 they will increase the maximum Loan to Value Ratio of Interest Only Loans from 80% to 90%, and increase the maximum term from 5 years to 10 years.
These loans will be marketed only for high-income professionals with stable jobs. And timing means people could transact before the election in May (probably) and so lock in tax benefits relating to negative gearing, which Labor are going to remove for existing property purchased after a certain data, TBA.
ANZ says their response to APRA’s responsible Lending guidelines from 2017 was to manage down the growth of IO loans. But they have decided to increase their focus on the investor market, wiliest ensuring they remain in line with the APRA requirements.
Just to remind ANZ, the key APRA points are :
Take 80% of rental streams as income to allow
for vacancy rates
Assess the risk on a principal and interest rate
loan basis
Ensure the borrower has firm plans to repay the
capital
Ensure adequate validation of income and
expenditure
Ignore any tax breaks or benefits, so asses on a
pre-tax basis.
ANZ says these changes will apply to new loans, either fixed
or variable interest rate.
The LVR limit is inclusive of the Lenders Mortgage Insurance
Premium
For Owner Occupier Home Loan products: Interest Only term
cannot exceed a maximum 5 years per application OR 5 years in total since the
last full credit critical application.
For Residential Investment Home Loan products: Interest Only
term cannot exceed a maximum 10 years per application OR 10 years in total
since the last full credit critical application.
For servicing, the customer is assessed based on their
ability to repay the loan over 20 years P&I. And we understand these new loans are assessed
at a minimum floor rate of 8.25%, which is a very high hurdle to cross.
These are not available to Owner Occupied Borrowers.
Two comments, first this is to be expected, as ANZ has seen
their mortgage portfolio growth drop away, and they are desperate to write
business. They are trying to target a specific customer segment, and some who
are currently facing a loan reset may be rescued.
But then, our modelling suggests only a very small cohort who might be eligible, and we expect other lenders to react, so they will lift competition for that small segment.
Talking of reaction, we think APRA should step in to ban loans
of this duration, but they probably won’t, and the RBA might even welcome the
move behind the scenes as generating a rise in credit.
But frankly, this is just one more of those unnatural acts I
keep talking about from actors who are trying to keep the property bubble alive.
But potential investors should realise that prices are likely to keep falling,
rental streams are diminishing, especially in Sydney, and a repayment plan over
20 years, will require higher monthly repayments down the track. This has high
risk written all over it!
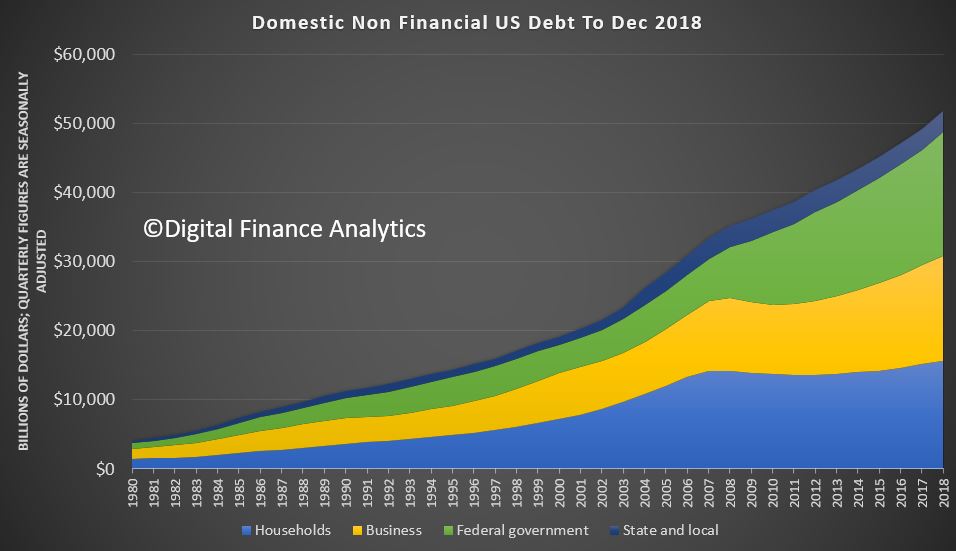
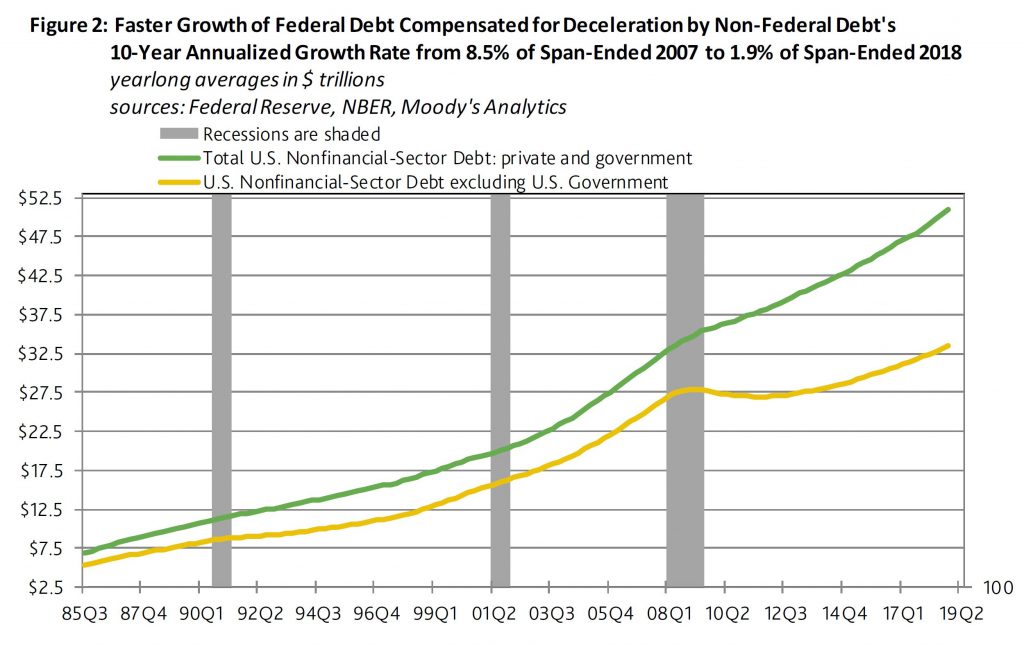
Moody’s says that US debt continues to rise (with strongest growth in the public sector) and a powerful enough external shock could force U.S. benchmark interest rates up to levels that shrink business activity considerably.
The latest version of the Federal Reserve’s “Financial Accounts of the United States” was released on March 7. As of 2018’s final quarter, the total outstandings of private and public nonfinancial-sector debt grew by 5.1% year-to-year to a record high $51.796 trillion. The year growth rate of the broadest estimate of U.S. nonfinancial-sector debt has slowed from second-quarter 2018’s current cycle high of 5.6%. Since the end of the Great Recession, the 3.9% average annualized rise by nonfinancial-sector debt has slightly outpaced nominal GDP’s accompanying 3.7% average annual increase.
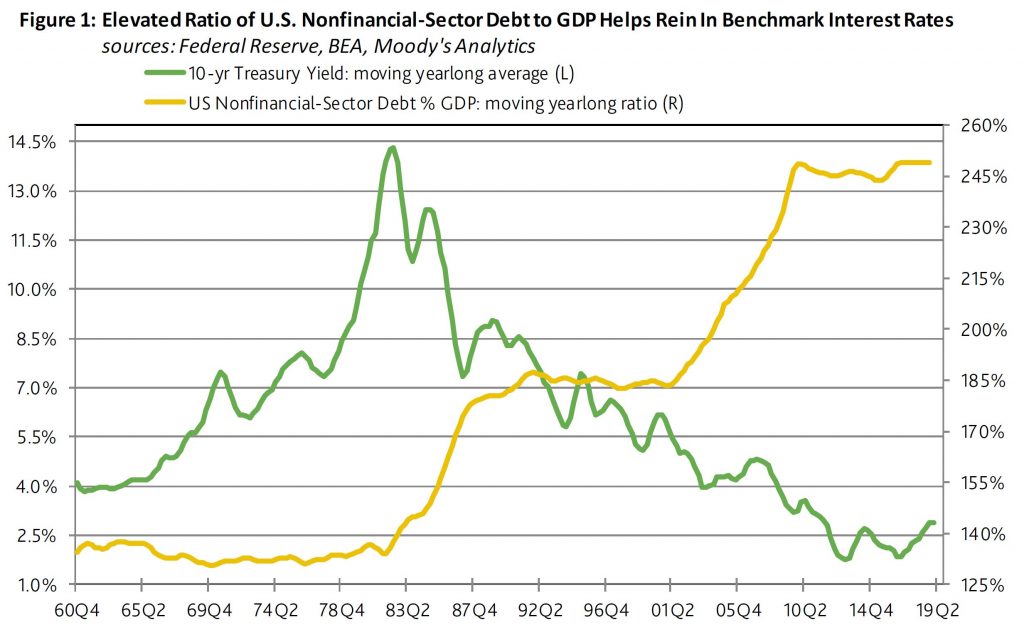
By contrast, during 2002-2007’s upturn, the 8.1% average annualized advance by nonfinancial-sector debt was much faster than nominal GDP’s comparably measured growth rate of 5.3%. As a result, the moving yearlong ratio of total nonfinancial-sector debt to GDP climbed from the 197% of 2001’s final quarter to the 225% of 2007’s final quarter. Because of the current recovery’s much slower growth of debt vis-a-vis GDP, debt barely rose from second-quarter 2009’s 243% to fourth-quarter 2018’s 249% of GDP.
Today’s near record high ratio of nonfinancial-sector debt to GDP limits the upside for benchmark interest rates. Just as highly leveraged businesses exhibit a more pronounced sensitivity to higher benchmark interest rates, highly leveraged economies are likely to slow more quickly in response to an increase by benchmark rates. Relatively low interest rates do much to lessen the burden implicit to a comparatively high ratio of debt to GDP.
Nevertheless, a powerful enough external shock could force U.S. benchmark interest rates up to levels that shrink business activity considerably. Under this scenario the Fed would be compelled to hike rates in defense of the dollar exchange rate despite how a deterioration of domestic business conditions requires lower rates.
The federal government has dominated the growth of total nonfinancial-sector debt during the current business cycle upturn. In terms of moving yearlong averages, U.S. government debt’s 9.3% average annualized surge has well outrun the accompanying 2.2% growth rate for the sum of private and state and local government nonfinancial-sector debt.
Regarding 2018’s final quarter, the outstandings of U.S. government debt advanced by 7.6% annually to $217.865 trillion. By comparison, household-sector debt rose by 3.1% to $15.628 trillion, nonfinancial corporate debt increased by 6.5% to $9.759 trillion, unincorporated business debt grew by 4.9% to $5.485 trillion, while state and local government debt shrank by 1.7% to $3.060 trillion. Thus, fourth quarter 2081’s U.S. nonfinancial-sector debt excluding the obligations of the federal government grew by a modest 3.9% annually. Over the past 10-years, the faster growth of federal government debt compensated for the sluggish debt growth of non-federal borrowers.
I will talk about how climate change affects the objectives of monetary policy and some of the challenges that arise in thinking about climate change.
Finally, I will also briefly discuss how climate change affects financial stability.
Let me start by highlighting a few of the dimensions that we need to consider:
We need to think in terms of trend rather than cycles in the weather. Droughts have
generally been regarded (at least economically) as cyclical events that recur every so
often. In contrast, climate change is a trend change. The impact of a trend is
ongoing, whereas a cycle is temporary.
We need to reassess the frequency of climate events. In addition, we need to reassess our
assumptions about the severity and longevity of the climatic events. For example, the
insurance industry has recognised that the frequency and severity of tropical cyclones (and
hurricanes in the Northern Hemisphere) has changed. This has caused the insurance sector to
reprice how they insure (and re-insure) against such events.
We need to think about how the economy is currently adapting and how it will adapt both to
the trend change in climate and the transition required to contain climate change. The
time-frame for both the impact of climate change and the adaptation of the economy to it is
very pertinent here. The transition path to a less carbon-intensive world is clearly quite
different depending on whether it is managed as a gradual process or is abrupt. The trend
changes aren’t likely to be smooth. There is likely to be volatility around the trend,
with the potential for damaging outcomes from spikes above the trend.
Both the physical impact of climate change and the transition are likely to have first-order
economic effects.
Climate Change, Economic Models and Monetary Policy
The economics profession has examined the effects of climate change at least since Nobel Prize
winner William Nordhaus in 1977. Since then, it has become an area of considerably more active
research in the profession.[4]
There has been a large body of research around the appropriate design of policies to address
climate change (such as the design of carbon pricing mechanisms), but not that much in terms of
what it might imply for macroeconomic policies, with one notable exception being the work of
Warwick McKibbin and co-authors.[5]
How does climate affect monetary policy? Monetary policy’s objectives in Australia are full
employment/output and inflation. Hence the effect of climate on these variables is an
appropriate way to consider the effect of climate change on the economy and the implications for
monetary policy. The economy is changing all the time in response to a large number of forces.
Monetary policy is always having to analyse and assess these forces and their impact on the
economy. But few of these forces have the scale, persistence and systemic risk of climate
change.
A longstanding way of thinking about monetary policy and economic management is in terms of
demand and supply shocks.[6]
A positive demand shock increases output and increases prices. The monetary policy response to a
positive demand shock is straightforward: tighten policy. Climate events have been good examples
of supply shocks. Indeed, droughts are often the textbook example used to illustrate a supply
shock. A negative supply shock reduces output but increases prices. That is a more complicated
monetary policy challenge because the two parts of the RBA’s dual mandate, output and
inflation, are moving in opposite directions. Historically, the monetary policy response has
been to look through the impact on prices, on the presumption that the impact is temporary. The
banana price episode in 2011 after Cyclone Yasi is a good example of this. The spike in banana
prices and inflation was temporary, although quite substantial. It boosted inflation by 0.7
percentage points. The Reserve Bank looked through the effect of the banana price rise on
inflation. After the banana crop returned to normal, prices settled down and inflation returned
to its previous rate.
The response to such a shock is relatively straightforward if the climate events are temporary
and discrete: droughts are assumed to end; the destruction of the banana crop or the closure of
the iron ore port because of a cyclone is temporary; things return to where they were before the
climate event. That said, the output that is lost is generally lost forever. It is not made up
again later, but rather output returns to its former level.
The recent IPCC report documents that climate change is a trend rather than cyclical, which makes the assessment much more complicated. What if droughts are more frequent, or cyclones happen more often? The supply shock is no longer temporary but close to permanent. That situation is more challenging to assess and respond to.
Climate Change and Financial Stability
Having talked about the macroeconomic impact of climate change and how that might affect monetary
policy, I will briefly discuss climate through the lens of financial stability implications.[10] Financial
stability is also a core part of the Reserve Bank’s mandate. Challenges for financial
stability may arise from both physical and transition risks of climate change. For example,
insurers may face large, unanticipated payouts because of climate change-related property damage
and business losses. In some cases businesses and households could lose access to insurance.
Companies that generate significant pollution might face reputational damage or legal liability
from their activities, and changes to regulation could cause previously valuable assets to
become uneconomic. All of these consequences could precipitate sharp adjustments in asset
prices, which would have consequences for financial stability.
The reason that I will only cover the implications of climate change for financial stability only
briefly today is that it has been very eloquently discussed by Geoff Summerhayes (APRA) and John
Price (ASIC) including at this forum over the past two years.[11] I would very much
endorse the points that Geoff and John have made. Geoff stresses the need for businesses,
including those in the financial sector to implement the recommendations of the Task Force for
Climate-related Financial Disclosures (TCFD).[12]
I strongly endorse this point. We have seen progress on this front in recent years, but there is
more to be done. Financial stability will be better served by an orderly transition rather than
an abrupt disorderly one.
One area that Geoff highlighted in a recent speech is that there is a data gap which needs to be
addressed:[13] ‘The
challenge governments, regulators and financial institutions face in responding to the
wide-ranging impacts of climate change is to make sound decisions in the face of uncertainty
about how these risks will play out.’ In that regard, Geoff mentions one challenge that I
spoke about earlier in the context of monetary policy. Namely, taking the climate modelling and
mapping that into our macroeconomic models. For businesses and financial markets, that challenge
is understanding the climate modelling and conducting the scenario analysis to determine the
potential impact on their business and investments.