The Full 100 Mortgage Stress Listing

To complete our series on mortgage stress, based on our household surveys, here is the complete list of the top 100 most stressed suburbs, and their relative position on the default list, as at December 2016.

Victoria has the highest number of suburbs in the listing.

As we discussed yesterday, this is based on the absolute number of households in the suburb who are in difficulty.  You can also watch our video blog where we discuss the research.

Running our risk models, we expect the banks to be reporting higher mortgage defaults next year, with a lift in write-offs from around 2 basis points, to 4 basis points. However, this is still at a low, and manageable level given the capital buffers they hold. We do expect provisions though to rise.

New DFA Video Blog – Household Mortgage Stress and Defaults

Using data from our household surveys in this new video blog we discuss the findings from our latest modelling. More than 22% of households are currently in mortgage stress, and 1.9% of households are likely to default. Both are likely to rise next year.


Top 20 Postcodes For Mortgage Stress Across Australia

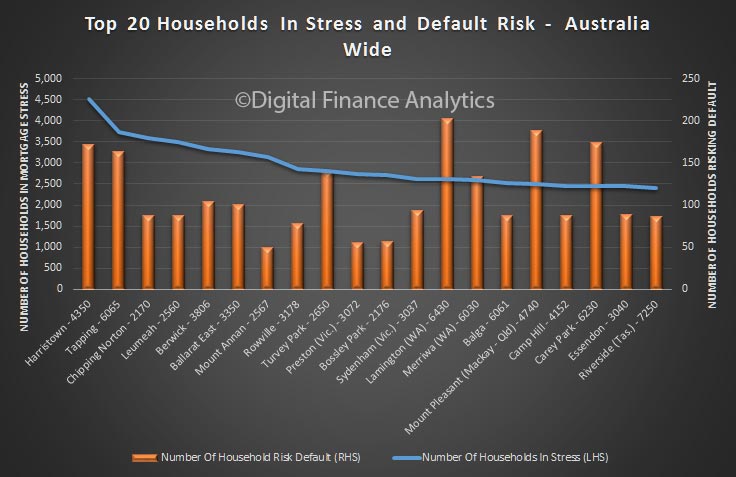
Now we get to the pointy end of our mortgage stress and default analysis. Today we list the top 20 post codes across Australia where the highest number of households currently in mortgage stress reside. We also reveal our estimate for the number of defaults which we expect to occur in the coming months.

It is worth saying that the percentage of households stressed or at risk of default, in a particular post code, varies considerably, but we have chosen to look at the actual number of households this represents. This is because there are a number of post codes where the percentage is very high, but off a very low number of householders. Statistically speaking such low numbers would make us less certain of the accuracy of the estimates. But by choosing to focus on the absolute number of households involved, the estimates are more firmly grounded. In any case the numbers involved, if larger, makes a material difference to the economy, and the banking system.

So, then, here is the list. The post code with the highest number of households in mortgage stress in December 2016 is Harristown – 4350 – in Queensland. It is about 109 kms from Brisbane. This area covers Toowoomba, Harristown, Glenvale and Rockville etc and a population of close to 60,000. Many of the households here are younger. Incomes are lower than the QLD average. More than 4,500 households there are in difficulty and more than 170 households in the district risk mortgage default.

Within the top 20 nationally, the post code with the highest level of default risk is Lamington, WA, a suburb of South East & Central. It is about 549 kms from Perth.  The region includes Kalgoorlie, Lamington and Williamstown, etc. Many of these households are in the younger aged segments.  Incomes are higher than the WA average. Here more than 2,600 households are in mortgage stress, and more than 200 are likely to default.

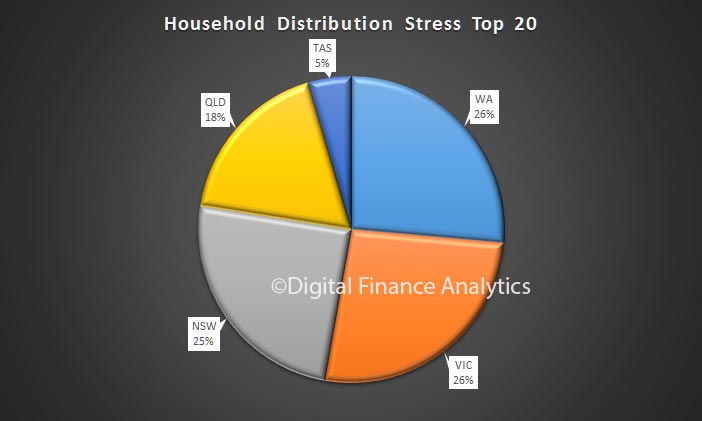
The distribution of stressed households in also interesting. Within the top 20, Western Australia has the largest number of households (26.4%), just ahead of Victoria (26.38%), but off a smaller population base. Shows the pressure on households in the west.

Next time we will look in more detail at some the state levels data.

A Segmented View Of Mortgage Stress and Default

As we continue our series on mortgage stress, using the latest data from our surveys, we look at how stress aligns with our core household and property owning segments.

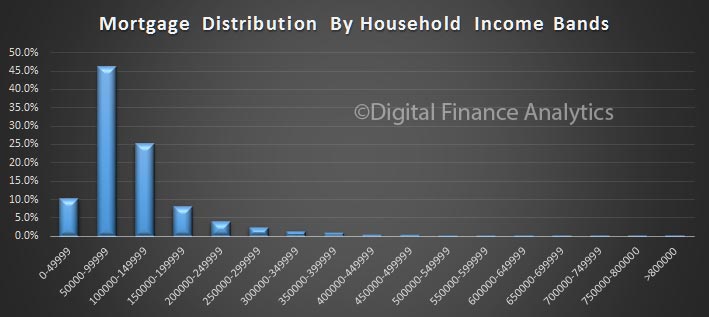
To set the context for this, here are a couple of charts showing the mortgage distribution by income and age bands. The majority of mortgages are held by households with an income of between $50,000 and $150,000.
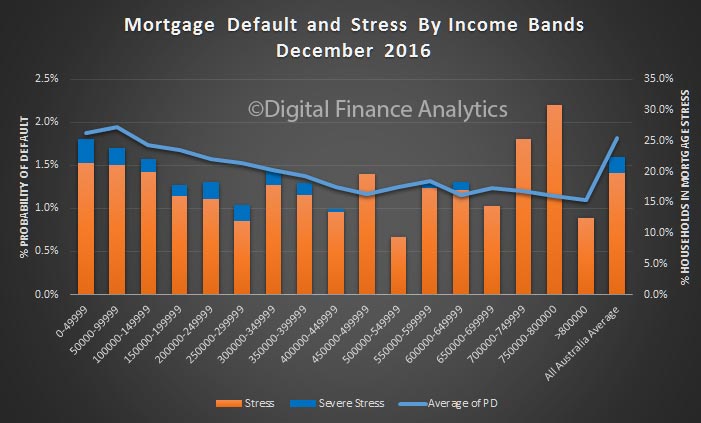
Mortgage stress and default are slightly higher across the lower income bands, but note that households with substantially higher incomes can also be in severe stress. But of course the absolute number are very small.
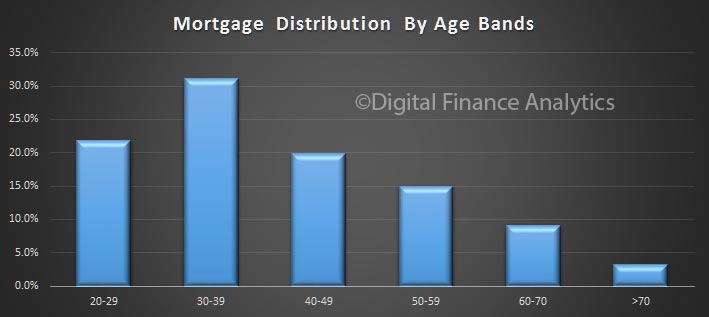
The highest proportion of mortgages are held by those aged 30-39, more than 30%.
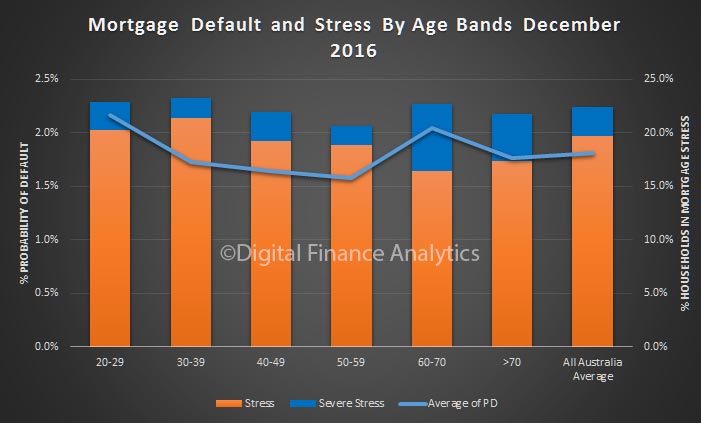
Default probability is higher among younger and older households. Whilst the number of these households with a mortgage is relatively low, more are in severe mortgage stress because their incomes are much lower. More generally, some mortgage stress is evident across all age bands. In volume terms, the highest stress volumes are found in those 30-39 years.
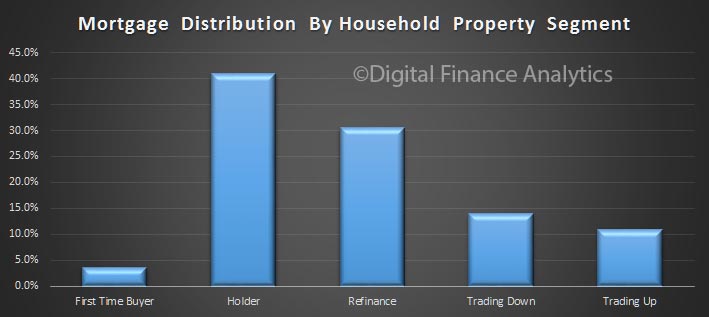
Next we turn to our property segmentation.  Those holding property account for the largest segment of the market. You can read about our segmentation approach here.
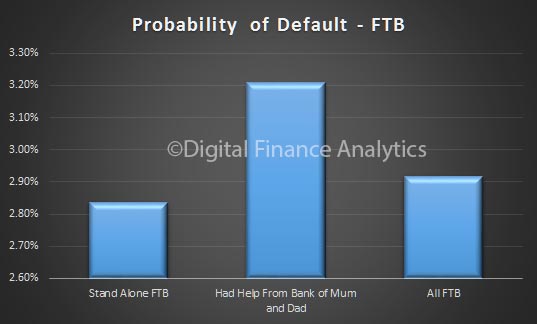
Probability of default is highest among first time buyers, who also have the highest proportion of severe mortgage stress. The segment with the lower risk and levels of stress are those seeking to trade up.
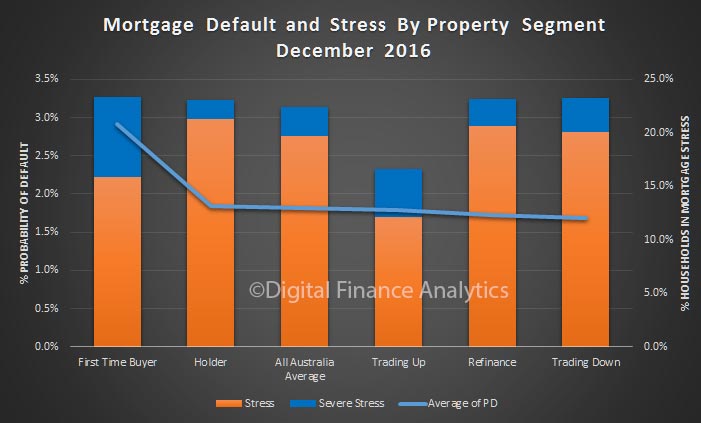
On interesting finding, bearing in mind we highlighted the rise of first time buyers seeking help from “The Bank of Mum and Dad“, is that those who do get help are more likely to default. So, assistance from parents may be a two-edged sword.
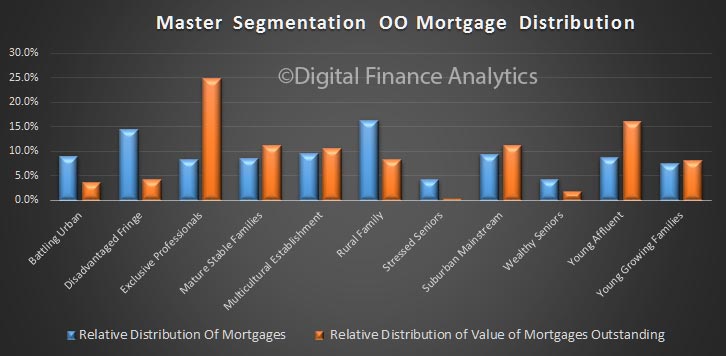
Finally, we turn to our master segmentation. The number of households with a mortgage varies across these segments. The value distribution footprint is quite different, with the exclusive professional and young affluent segments holding the larger average mortgage.
Mortgage stress is highest among the disadvantaged fringe, though their mortgages are relatively lower and default rates are relatively low. Wealthy seniors registered high levels of severe mortgage stress, thanks to pressure on incomes (the impact of low returns from bank deposits and rentals are important here).

However, the highest risk of defaults sits with the younger segments. Young affluent households, with large mortgages are most exposed because their incomes are flat whilst they are highly leveraged, so as interest rates rise, they are exposed. Many have bought new high-rise apartments in the inner city areas.

Young growing families may have, on average smaller mortgages, but their finances are tight, with little room to maneuver, and any rise in interest rates will be a problem for them. Costs are living are moving higher for this group, especially child care costs.
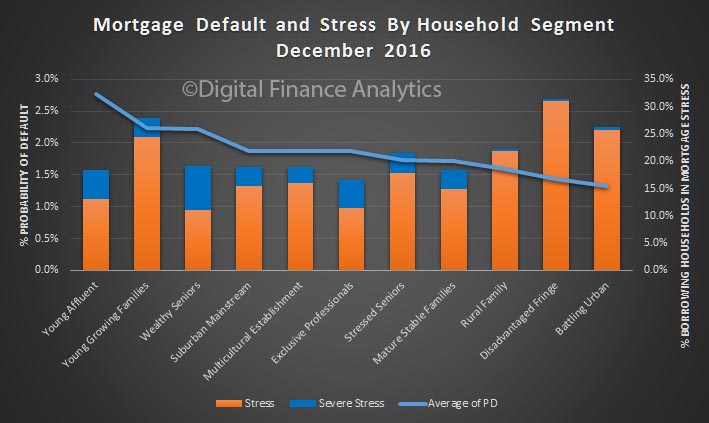
So, we think effective segmentation is critical to understand the various portfolio risks which reside in the bank’s mortgage book. We need to move beyond LVR and LTI.

Next time we will look at some of the post code level data.

Mortgage Stress Covers 18.5% Of Book Value

Containing our latest series on mortgage stress and probability of default, we look further at the distribution of mortgage stress and potential defaults, using data from our household surveys, which includes results up to the middle of December 2016.

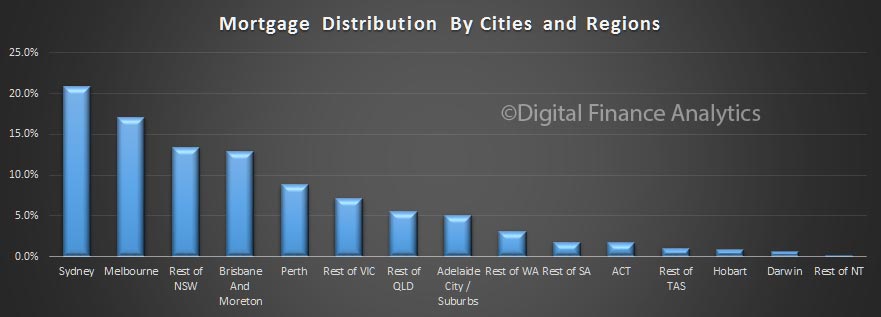
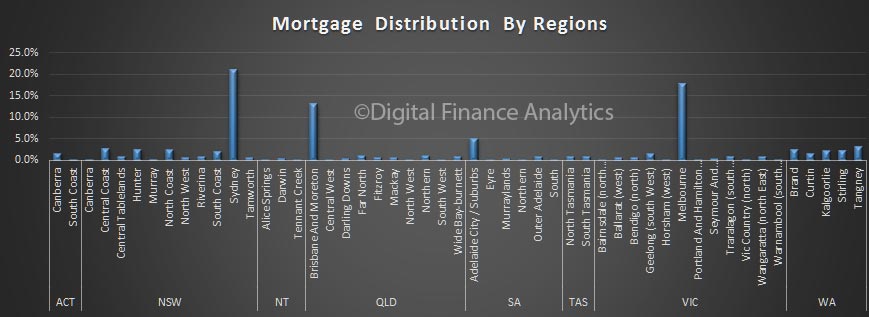
Building on the data we discussed yesterday, it is worth remembering that the bulk of mortgages reside in just a few zones across the country. This chart shows the number of loans in each of the major cities and regional areas, as a proportion of the total – we are looking here at owner occupied loans. The urban centres of Sydney, Melbourne and Brisbane hold the bulk of the loans, add in the rest of NSW and Perth, and you have more than 80% of all loans covered. So what happens in these areas is significant from a portfolio point of view. We include both loans from the banks (ADIs) and non-banks in this analysis.

We can then look at the same analysis, but by loan value. Given the larger loans in Sydney, thanks to higher prices, the distribution based on value is more skewed, with more than 35% of loans in the greater Sydney region.

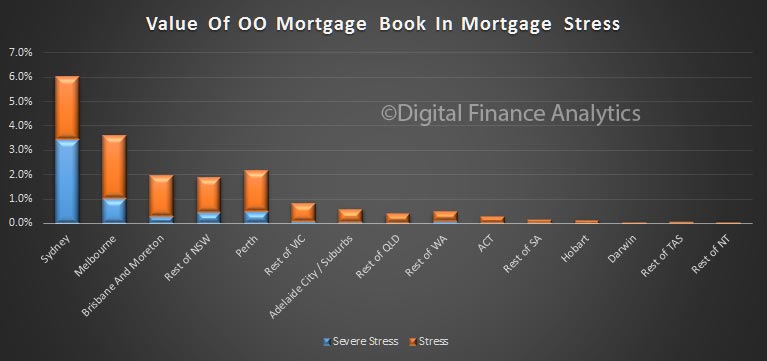
If we then overlay those households who are in mortgage stress, we see that in value terms, 6% of the portfolio in stress is in greater Sydney, 3.5% in greater Melbourne, and just over 2% in greater Perth.

Total this up, and we conclude that in value terms, 18.5% of the current owner occupied loans are held by households in some degree of mortgage stress.  This proportion has been rising over the past couple of years, as income growth slows, whilst household debt rises.

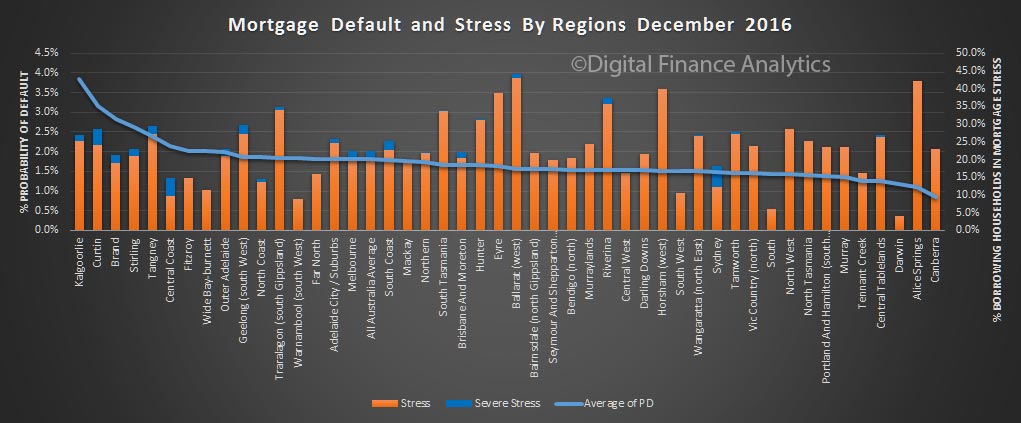
Another way to look at the data is by a more granular regional break down. Here is the probability of default by region, plus the latest reading on mortgage stress. The highest probability of default can be found in the Kalgoorlie, Curtin and Brand regions of WA. Regional WA probability of default sits at around 4%.

Ballarat, Horsham and Alice Springs has the highest rate of mortgage stress. But, when you look at the relative distribution of mortgages on the same basis, we see that the bulk of the mortgages reside in just a few regions. In other words, there may be high stress levels, but on low absolute volumes of loans. Once again, to see what is really going on, you need to get granular.

Next time we look at stress and default by our segmentation models.

Mortgage Stress And Probability Of Default Is Rising

We have just finished the December update of our mortgage stress and probability of default modelling for the Australian mortgage market.

Our model has been updated to take account of the latest employment, wage, interest rate and growth data, and we look are the current distribution of mortgage stress (can households settle their mortgage repayments, on time without financial pressure?) and make an estimate of the probability of households defaulting on their repayments by more than 30 days. The former uses our survey data on mortgages held, interest rates applied, and income available in the light of other financial commitments. Probability of default overlays the broader economic drivers. The base analysis is completed at a customer segment level by post code then rolled up to form various data views. In the next few days, we will discuss the findings in some detail. You can read more about our approach here. We also also reveal the current top 100 post codes for mortgage stress and mortgage defaults across the nation.

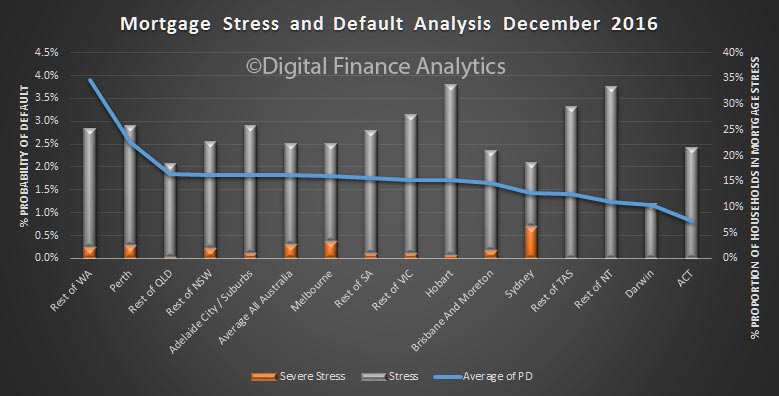
To begin, here is a summary by states, split down by CBD and rest of state.

The highest probability of default can be found in regional WA, thanks to pressure in the mining belt. 30 days defaults will be close to 4%. Here, around 25% of households are in mortgage stress, including some in severe stress – see our descriptions here.

Default expectations are also high in and around Perth, where employment prospects are faltering, and incomes under pressure. In QLD, away from Brisbane, we see similar issues. The ACT has the lowest level of default probability.

The highest levels of mortgage stress are found in Tasmania, and across Regional NT, where more than 30% of households are under pressure. We also see hot spots in regional areas.

Of note is the high proportion of households in greater Sydney in severe mortgage stress – at 6.2% of borrowing households. This is a function of large mortgages (driven by high prices), rising interest rates AND flat incomes. By way of comparison, Melbourne households in severe stress sit at 3.3%, as mortgages are a little smaller. They are both higher than the national average of 2.8% of households.

Combined, across the country, more than 22% of all households are now in some degree of mortgage stress.

Next time we will dig into the more specific geographic footprints, because you really have to get granular to make sense of what is going on. Averages across the national simply mask what is going on.  Later will will look at loan-to-income and debt servicing ratios which are also deteriorating for many.  Then finally we will look at the loss implications for the banking sector.


The Property Imperative 7th Edition Is Available

The latest edition of our flagship report “The Property Imperative” is now available. The seventh edition updates the current state of the market by looking at the activities of different household groups using our recent primary research, blogs and other available data.

In this edition, we look at household debt servicing ratios, a critical indicator of potential mortgage stress in a low income growth environment. We focus on the impact of “The Bank of Mum and Dad” on first time buyers.

We also examine the latest dynamics in the property investment sector and discuss the future of commissions in financial services.

property-imperative-7-faceIn summary, the rate of mortgage loan growth is slowing, but the overall level of household debt continues to rise and investment loans are back in favour.

Request the free report [49 pages] using the form below. You should get confirmation your message was sent immediately and you will receive an email with the report attached after a short delay.

Note this will NOT automatically send you our ongoing research updates, for that register here.

[contact-form to=’mnorth@digitalfinanceanalytics.com’ subject=’Request for The Property Imperative Report 7′][contact-field label=’Name’ type=’name’ required=’1’/][contact-field label=’Email’ type=’email’ required=’1’/][contact-field label=’Email Me The Report’ type=’radio’ options=’Yes Please’ required=’1′ /][contact-field label=’Comment If You Like’ type=’textarea’/][/contact-form]

Mortgage Stress – It’s All About Granularity

We have updated the Digital Finance Analytics Mortgage Stress Analysis, to August 2016, using data from our household surveys. Contrary to what might be thought, whilst the ultra-low mortgage rates are easing the finances of some households, mortgage stress still exists, and it’s iron hand is being felt by more than 21% of households. But it is not equally spread across the population, so you need to get granular to see what is going on. Worth though noting the Roy Morgan data we reported already, estimated 18.4% of households were in mortgage stress, so some correlation.

Over the next few days we will drill into the details to highlight where the pain is most severe, but today we start with an overview.

Before we start, we define mortgage stress, not as a fixed percentage of income servicing the mortgage, rather we examine the household budget, comparing the income with outgoings, including mortgage repayments and other commitments. Those in mortgage stress do not have sufficient free funds to pay their mortgage on time, without difficulty. You can read more about our definitions of mortgage stress here.

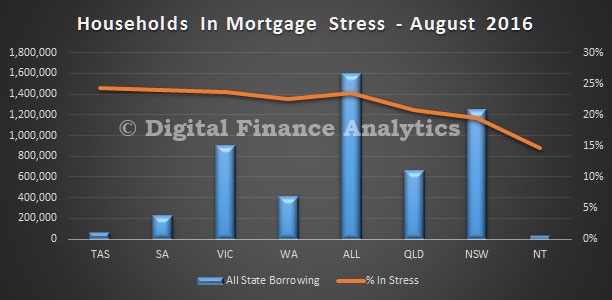
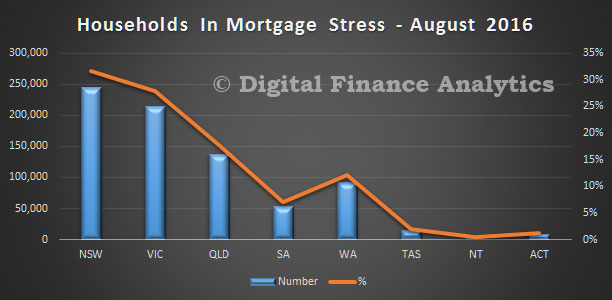
Looking at the summary analysis, the largest proportion of households who are borrowing and in mortgage stress reside in TAS and SA, then VIC, WA; all above the national average. QLD and NSW are below the average, along with NT.

Stress-Aug-2016---State-PCIn total there were 769,592 households nationally in stress. Looking at the number of households in stress by state however, NSW has the largest number with 244,119.

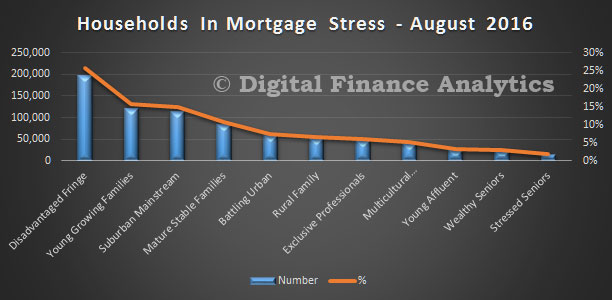
Stress-Aug-2016---State-NumberTurning to our household segments, those in the disadvantaged fringe and young growing family groups are the most strongly represented.

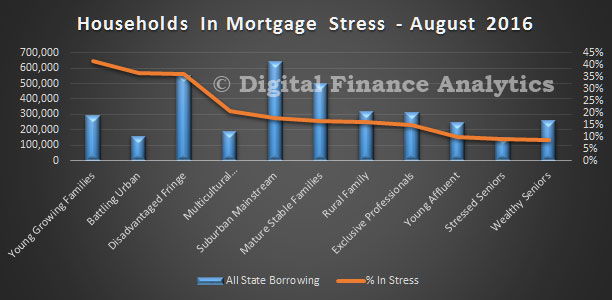
Stress-Aug-2016---SegmentBut, expressed as a percentage of segments in stress, young growing families are most exposed, with 41% in mortgage stress, slightly ahead of battling urban 36.7% and disadvantaged fringe 36%. Young affluent, stressed seniors and wealthy seniors were the least stressed.

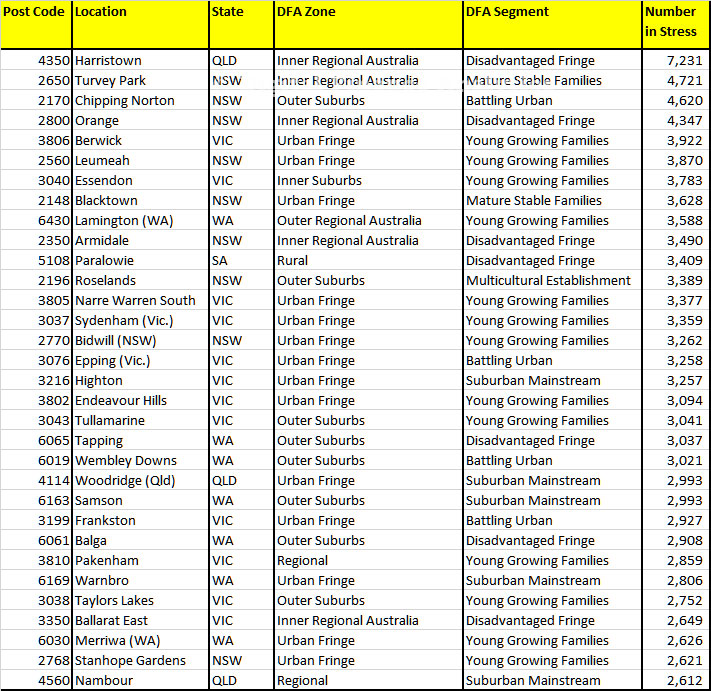
Stress-Aug-2016---Segment-PC   Finally, here is the top 30 or so, nationally. The most stressed post code in Australia at the moment is 4350, Harristown, with more than 7,000 households in difficulty.  Note too that those at the top of the list are not necessarily as expected. Some older and more affluent segments are also being hit.

Stress-Aug-2016Next time we will look in more detail at some of the states, and discuss the underlying causes of mortgage stress. But for now, it is clear that mortgage stress is still a very significant economic factor.


The Ongoing Allure of Investment Property

We continue the results from the latest Digital Finance Analytics household surveys, by looking at property investors, who now make up around 35% of all residential property borrowers. This is much higher than in any other similar economy (e.g. UK 17%). The appetite for investment property is still strong, and despite some tightening of lending criteria and slowing capital growth momentum, investors still wish to transact. Bank lending to investors in June 2016 rose by 0.1% or $0.6 billion.

As a reminder, we showed that investors (either those with one or two properties – solo investors, or those with a portfolio of properties – portfolio investors) were the most likely to purchase, even compared with those seeking to refinance.

DFA-Survey-Jul-2016---TransactThe driver to transact relate firstly to the tax effectiveness of the investment (37%) and capital gains from appreciating property values (25%). Low finance rates are helping, and investment property is perceived as offering better returns than bank deposits or stocks. We know that many in the eastern states will not make positive pre-tax returns, but taking tax breaks into account, they are still ahead, and will remain so unless there is a significant fall in home prices.

DFA-Survey-Jul-2016---All-InvThere are some barriers which investors have to negotiate, the most obvious is they have already bought (40%), potential changes to regulation (25%), and inability to get financing (15%). Risks relating to budget changes have dissipated, and some are concerned about static or falling rents (bundled in the other category at around 5%).

DFA-Survey-Jul-2016---Inv-BarriersSolo investors have similar drivers with a focus on tax efficiency and potential capital gains, supported by low finance rates. We note that they have lower expectations of future gains than other investors (portfolio and those investing via SMSF).

DFA-Survey-Jul-2016---Solo-InvLooking in detail at SMSF property investment, tax effectiveness, leverage and potential capital gains all drive the decisions. We did note some concerns about changes to superannuation regulation, especially around the caps, but this has not deterred prospective purchasers.

DFA-Survey-Jul-2016---Super-InvThere are about four percent of SMSF’s holding residential property, and typically it comprises just a proportion of the total fund. A further three percent are actively considering adding in property to their SMSF.

DFA-Survey-Jul-2016---SMSF-ShareIt is also worth noting that mortgage brokers are becoming more influential in providing advice to trustees seeking SMSF advice, alongside accountants. Internet forums and web sites still play a significant role in providing advice to trustees. 17% say they know enough, and rely on their own knowledge and experience.

DFA-Survey-Jul-2016---Trustee-Advice Finally, we highlight the “honeypot effect”, where interstate investors prefer to buy in the more buoyant states of NSW and VIC, than in their home states. We discussed this in detail in a previous post.  And of course some first time buyers are going direct to the investment sector.

So, investors will continue to sustain the market, and should the RBA cut rates again tomorrow, we should expect additional momentum, thanks to lower funding costs and paltry returns from bank deposits. Property investors are making logical decisions, given past performance, but at some point the tide just has to turn. But at the moment, returns from property simply outperforms other investment classes, and are perceived to be “as safe as houses”.

Next time we will round out the survey results by looking at some of the other property active segments.

First Time Buyers Still Determined But Under The Gun

Continuing our series on the latest Digital Finance Analytics household survey results, today we turn to those wishing to enter the property market for the first time.

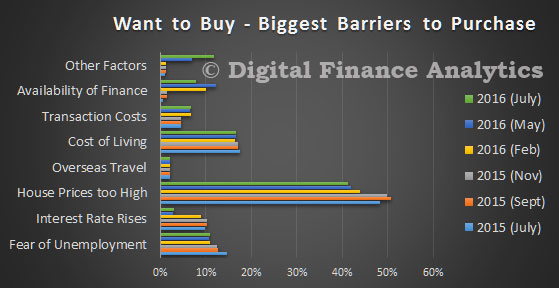
Looking briefly at those wanting to buy, but are not able to at the moment (about 1.1 million households, down from 1.3 million last year), whilst fear of unemployment and interest rate rises continue to dissipate, home prices are just too high relative to their income, to consider market entry. This is also influenced by their costs of living, and an inability to get finance. We also note a rise in “other factors”, which include needing to get finance help from family or friends.

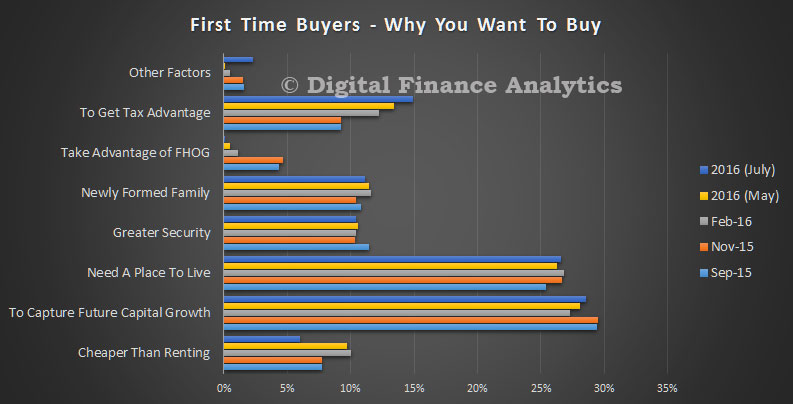
DFA-Survey-Jul-2016---WTB-BarriersTurning to those actively seeking to enter the market in the next year for the first time (about 312,000 households), we see that more are motivated by potential future capital growth than needing a place to live. In addition, tax advantage was cited by around 15 per cent of first time buyers as a key driver, whilst access to the first home owner grant has become ever less important.

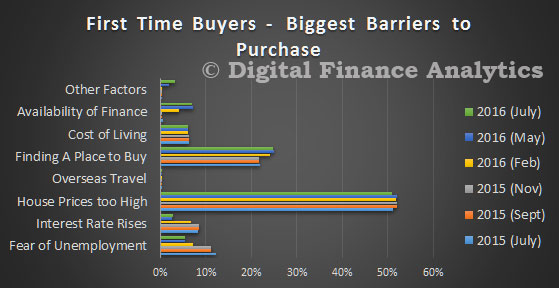
DFA-Survey-Jul-2016---FTB-MotivationsLooking at the barriers to purchase, first time buyers say that high home prices remains the most significant barrier, and as a result just finding a place to purchase is a challenge. Whilst fear of unemployment and the impact of rising interest rates have reduced, more are saying that availability of finance is an issue now as lending criteria are tightened.

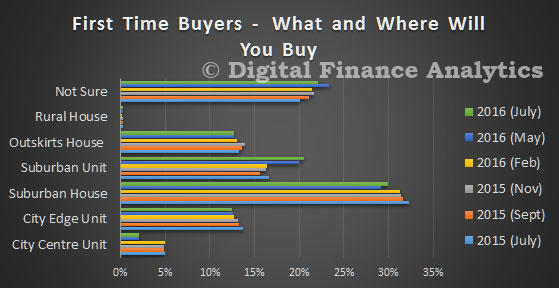
DFA-Survey-Jul-2016---FTB-BarriersWell over 20 per cent of first time buyers are not sure what, or where they will buy. More are likely to buy a unit than a year ago, and less likely to buy a house.

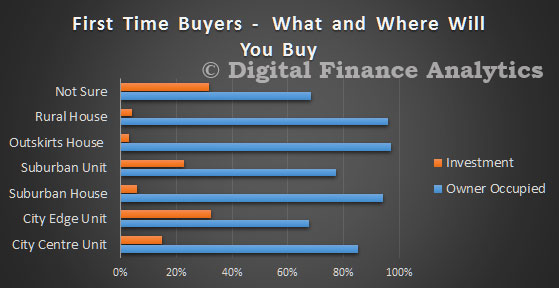
DFA-Survey-Jul-2016---FTB-WhatWe also continue to see a proportion considering buying an investment property, perhaps a cheaper property in an area they do not want to live in, as a way to enter the market, and participate in potential capital growth. This may be the key to an owner occupied purchase later.

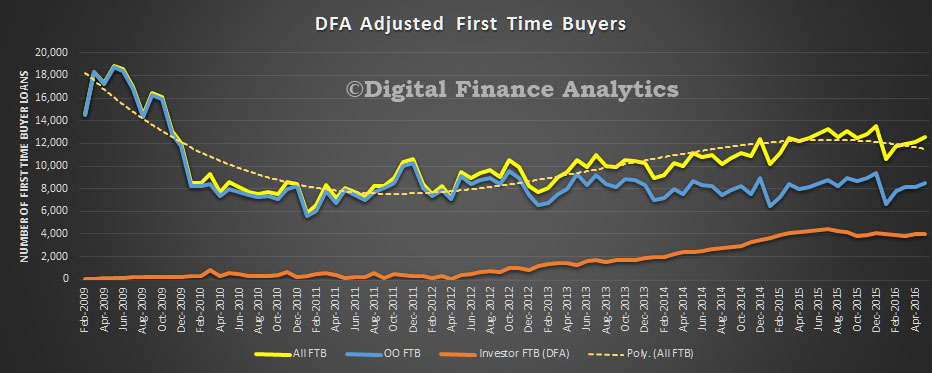
DFA-Survey-Jul-2016---FTB-TypeWe publish monthly data on the number of first time buyers who go direct to the investment sector from our surveys and overlay this on the ABS data. Around 4,000 are buying each month. The ABS data also shows the number of first time buyers is rising, to May 2016, though still well below the peak.

May-2016-FTBNext time we will do a deep dive on the investment property sector.