A Quick Recap For Those Who Missed Them

We had a technical issue with the DFA Blog this morning, thanks to a faulty WordPress update. As a result our recent posts were not syndicated through the normal channels. Having fixed the problem, here is a quick summary of what you may have missed.

Majority of brokers expect more out-of-cycle rate hikes

A recent survey has revealed that 85 per cent of brokers believe there are more out-of-cycle rate hikes in the pipeline, which will create challenges for existing mortgage holders.

APRA Looking At Capital Ratios For Mortgages Wayne Byres speech “Fortis Fortuna Adiuvat: Fortune Favours the strong”, as Chairman of APRA, at the AFR Banking & Wealth Summit, makes two significant points.

First, there are elevated risks in the residential lending sector (even after the recent tactical announcements on interest only loans). Banks remain  highly leveraged businesses.

Second, despite the delays from Basel, APRA will consult this year on potential changes to the capital ratios, reflecting the Australian Banks’ focus on mortgage lending and the need to be “unquestionably strong”.

CUA will temporarily pause accepting investor lending applications

Credit Union Australia (CUA) has said it will temporarily pause accepting investor lending applications until further notice, including applicants refinancing from other financial institutions.

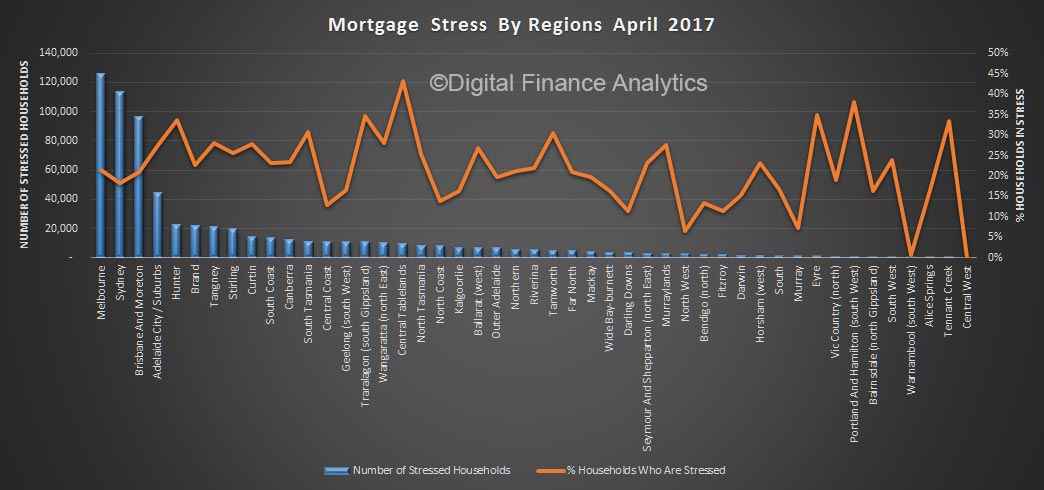
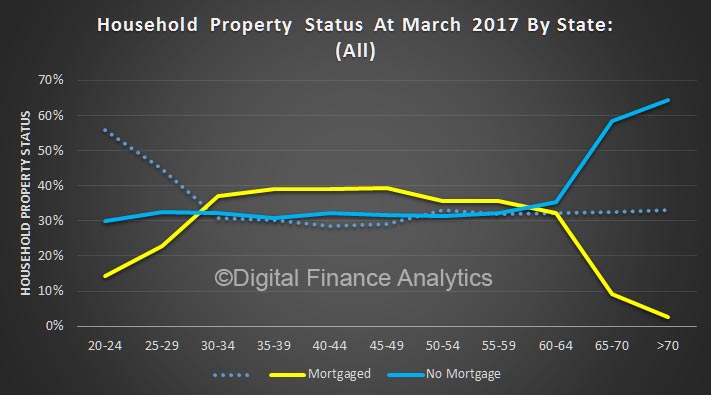
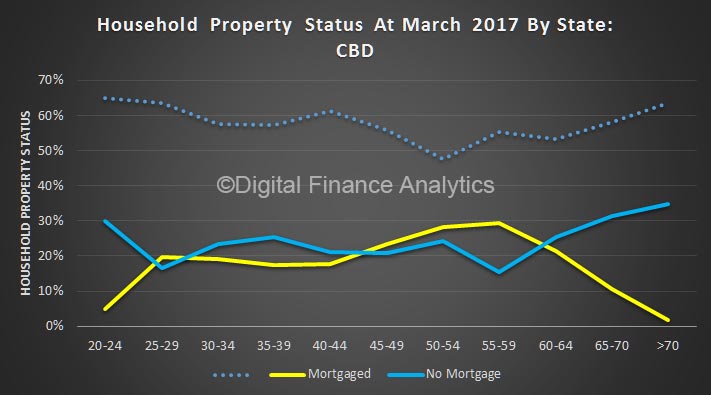
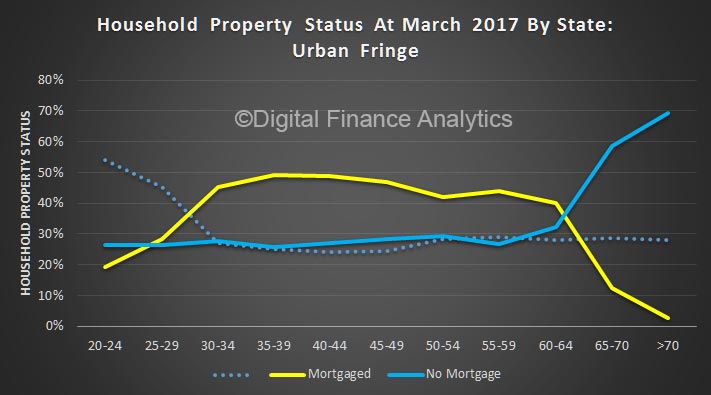
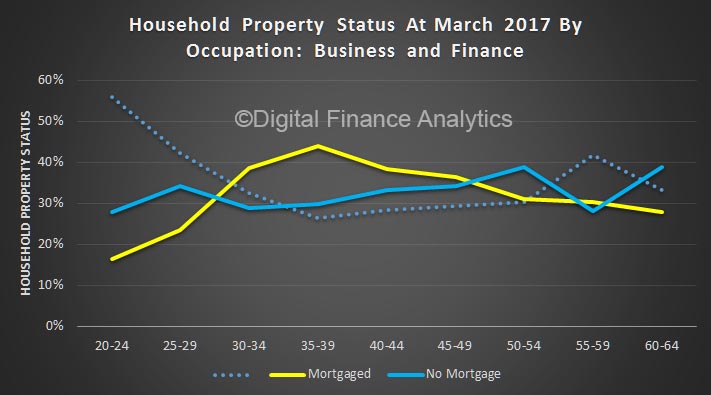
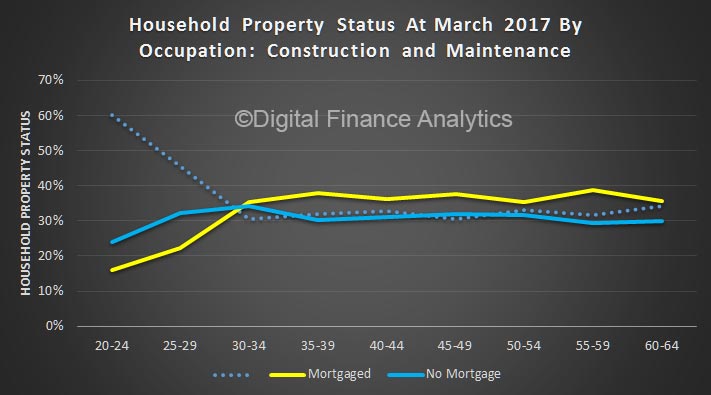
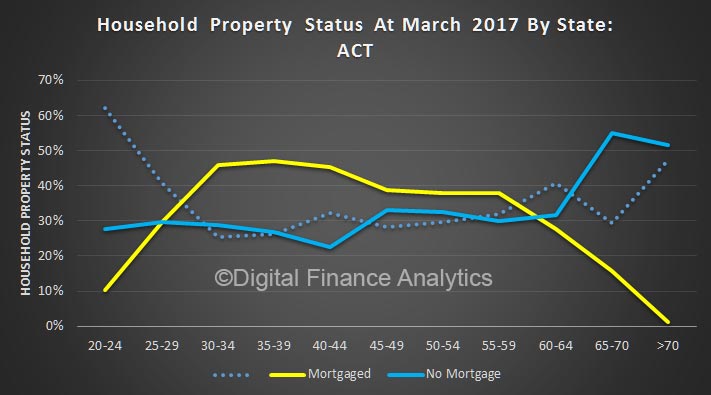
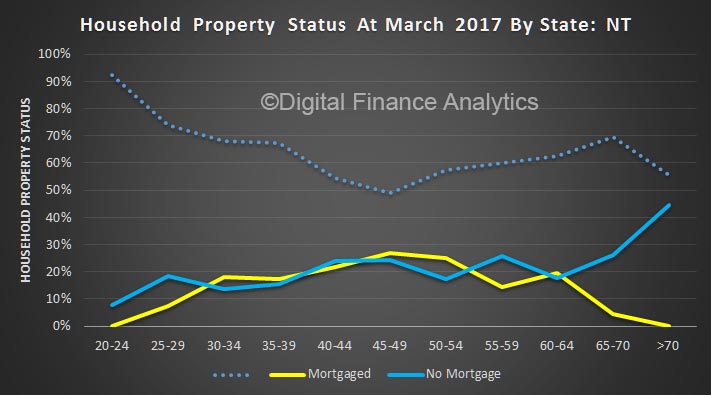
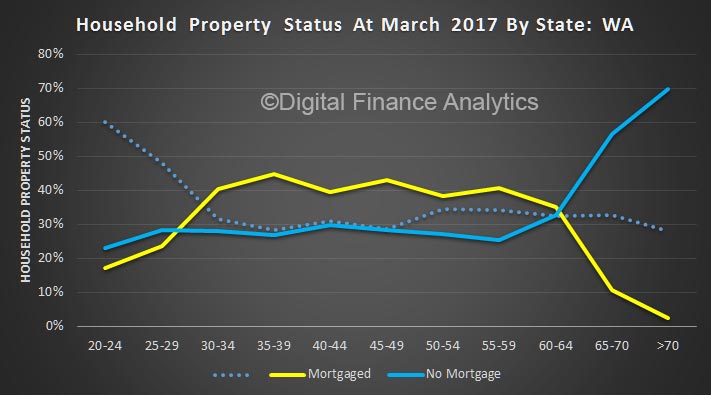
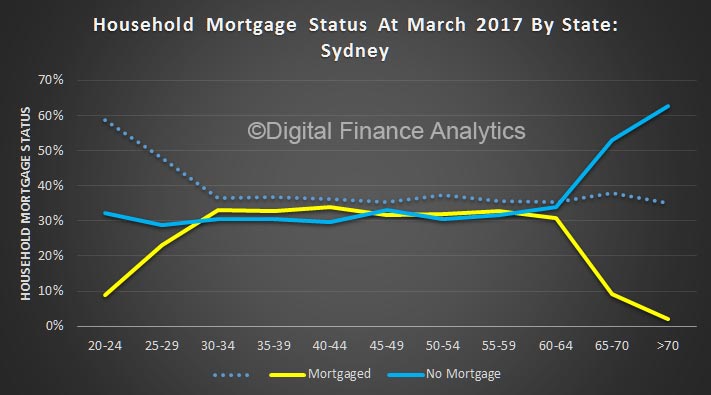
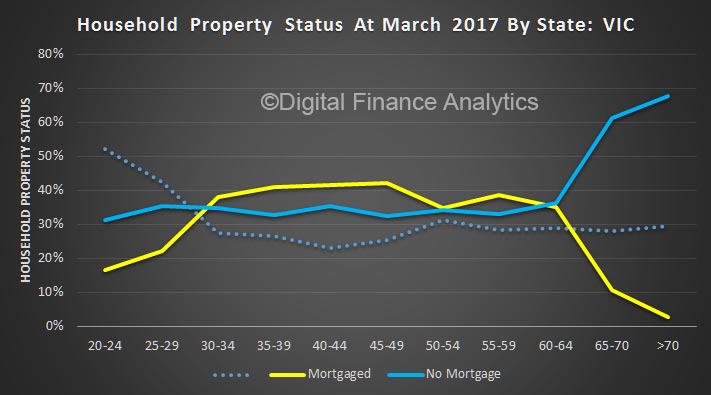
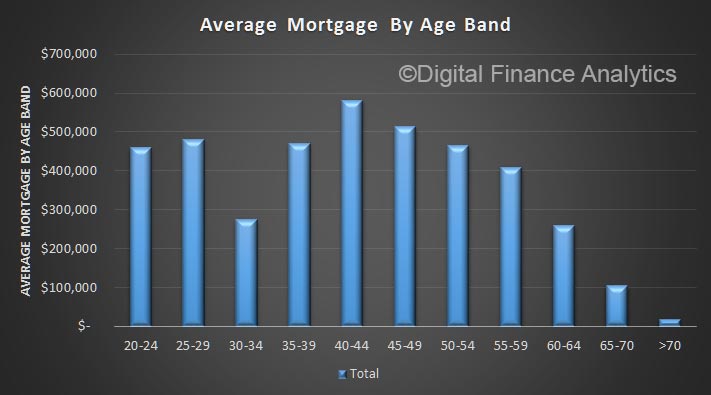
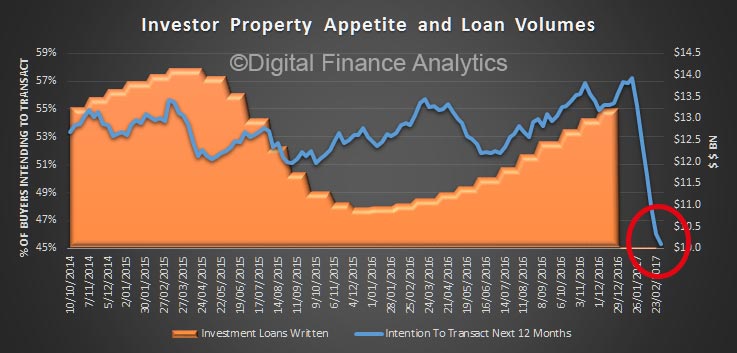
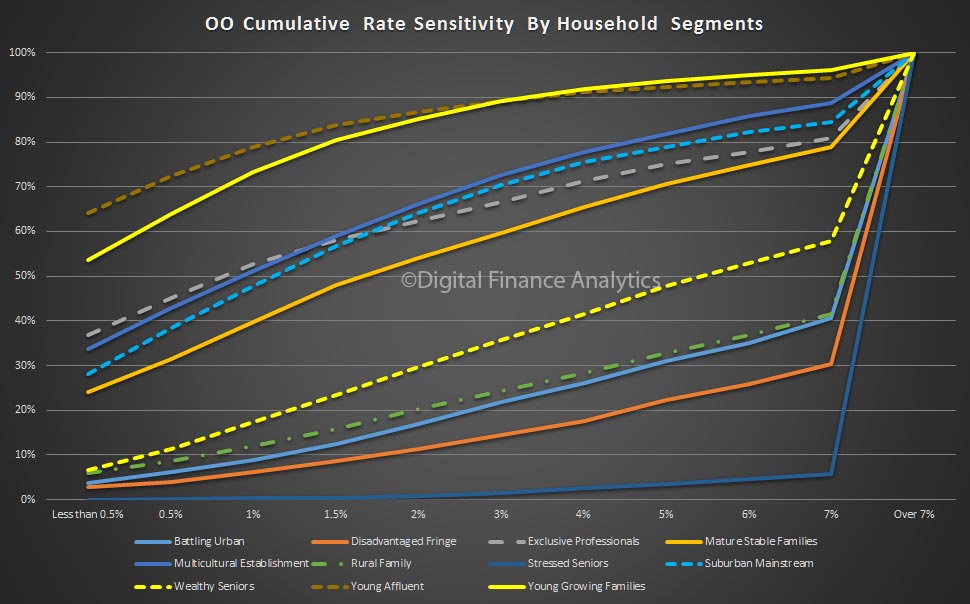
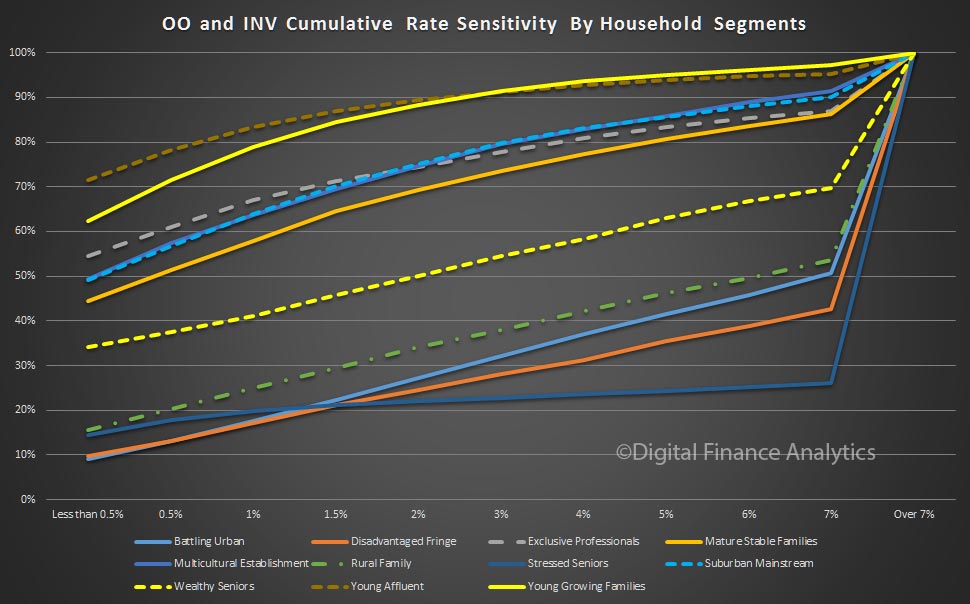
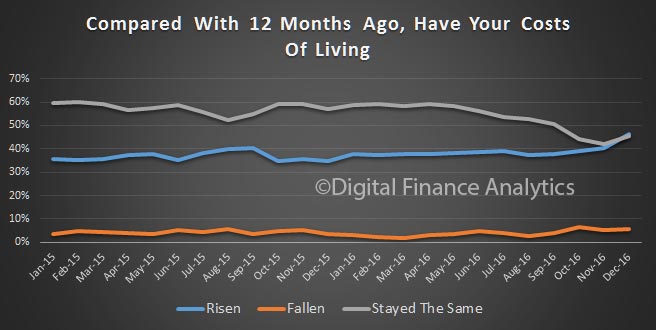
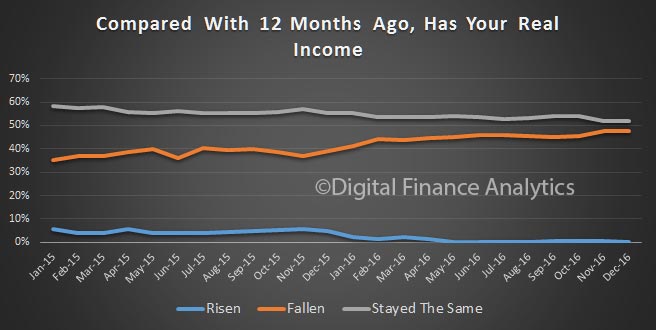
Property And Household Financial Footprints

Data from the Digital Finance Analytics Core Market Model tells an interesting story when we look at households dependence on wealth from property.

To illustrate the point, here are three charts, looking at different household groups.

We believe normal service has now resumed.


Mortgage Stress Rises Again

The latest results from the Digital Finance Analytics mortgage stress modelling, released today, reveals another rise in the number of households experiencing mortgage stress.

Martin North, Principal of Digital Finance Analytics said “of the 3.1 million mortgaged households, latest results from the DFA surveys of 52,000 households reveals an estimated 669,000 are now experiencing mortgage stress. This is a 1.5% rise from the previous month and maintains the trends we have observed in the past 12 months. The rise can be traced to continued static incomes, rising costs of living, and more underemployment; whilst mortgage interest rates have risen thanks to out-of-cycle adjustments by the banks and bigger mortgages thanks to rising home prices. With the latest housing debt to income ratio at a record 188.7*, households will remain under pressure”.

Within the 669,000 households, which represents 21.8% of borrowing households, 20.8% are in mild stress, meaning they are managing to make their mortgage repayments by cutting back on other expenditure, putting more on credit cards and generally hunkering down. However, the remaining 1% of households are in severe stress, meaning they are behind with their repayments, are trying to refinance, or sell their property or seeking hardship assistance.  Households are “stressed” when income does not cover ongoing costs, rather than identifying a set proportion of income, (such as 30%) going on the mortgage.

Regional analysis showed that 193,000 households are from NSW, 175,000 from VIC, 122,000 from QLD and 85,000 from WA.  However, the largest relative proportion of households in stress are found in the smaller states of SA and TAS, where the impact of sustained low wage growth and underemployment is strongly felt.

Looking ahead, the probability of 30-day mortgage default has also risen to 1.64%, with the highest risks residing in WA where it is more than 3% in the mining belts.  “We expect mortgage stress rates to climb through 2017 as mortgage rate rise, whilst slow wage growth, and underemployment will continue to bite” concluded Martin North.

Detailed analysis shows mortgage stress continues to touch some more affluent households, who are highly leveraged, as well as the more traditional “battler” groups in the urban fringe. Younger families and recent first time buyers are under the most pressure.

*RBA E2 Household Finances – Selected Ratios Dec 2016

The Rule of Thirds

On average, according to our surveys, one third of households are living in rented accommodation, one third own their property outright, and one third have a mortgage. Actually the trend in recent years has been to take a mortgage later and hold it longer, and given the current insipid income growth trends this will continue to be the case. Essentially, more households than ever are confined to rental property, and more who do own a property will have a larger mortgage for longer.

Now, if we overlay age bands, we see that “peak mortgage” is around 40% from late 30’s onward, until it declines in later age groups. The dotted line is the rental segment, which attracts high numbers of younger households, and then remains relatively static.

But the mix varies though the age bands, and across locations. For example, in the CBD of our major cities, most people rent. Those who do own property will have a mortgage for longer and later in life.

Compare this with households on the urban fringe. Here more are mortgaged, earlier, less renting, and mortgage free ownership is higher in later life.

Different occupations have rather different profile. For example those employed in business and finance reach a peak mortgage 35-39 years, and then it falls away (thanks to relatively large incomes).

Compare this with those working in construction and maintenance.

Finally, across the states, the profiles vary. In the ACT more households get a mortgage between 30-34, thanks to predictable public sector wages.

Renting is much more likely for households in NT.

WA has a high penetration of mortgages among younger households (reflecting the demography there).

Most of the other states follow the trend in NSW, with the rule of thirds clearly visible.

Victoria, for example, has a higher penetration of mortgages, and smaller proportions of those renting.

We find these trends important, because it highlights local variations, as well as the tendency for mortgages to persist further in the journey to retirement. This explains why, as we highlighted yesterday, some older households still have a high loan to income ratio as they approach retirement. To underscore this, here is average mortgage outstanding by age bands.


New Report On Mortgage Industry With JP Morgan Released

The report, released today highlights that property investors will be hit hard as banks re-price their mortgages.

Volume 24 of the mortgage report, a collaboration between J.P. Morgan and Digital Finance Analytics (DFA), explores how to practically define the term ‘materially dependent on property cash flows’ and looks to translate that into potential incremental capital requirements for the Australian major banks. The report also considers different re-pricing strategies and competitive dynamics, particularly around the issue of dynamic Loan-to-Value Ratios (LVR).

Significant changes are afoot for investor loans defined as being ‘materially dependent on property cash flows’ to repay the loan. Amidst the transition to Basel 4, these mortgages will see the most extreme effects on their capital intensity and pricing – with capital levels somewhere between 3x and 5x current requirements, which could have a significant impact on pricing of investor loans down the track.

The report draws heavily on modelling completed by Digital Finance Analytics from our household surveys, as presented in the recently published The Property Imperative 8, available here. Our survey is based on a rolling sample of 52,000 households and is the largest currently available. It includes data to end February 2017.

“The dispersion of impacts across the portfolio highlights the fact that assessing the mortgage by Probability of Default band or LVR band isn’t necessarily ‘good enough’. Although banks may have access to significant pools of data, the new regulatory regime is forcing them to become ever-more granular in their analysis – top-down portfolio analytics just won’t cut it anymore,” said Martin North, principal, DFA.

“Rather than managing the portfolio with ‘macro-prudential’ drivers, banks need to move to the other end of the analysis spectrum and become ‘micro-prudential’,” Mr North concluded.

Unfortunately because of compliance issues, the JPM report itself is only available direct from them, and not via DFA.

DFA is not authorized nor regulated by ASIC and as such is not providing investment advice. DFA contributors are not research analysts and are neither ASIC nor FINRA regulated. DFA contributors have only contributed their analytic and modeling expertise and insights. DFA has not authored any part of this report.

This Week The Investor Intention Indicator Is Down Again

We just got the results back from this week’s household surveys, and yes, we went straight to the investor intention to transact series. It is down again, now for the fourth straight week, and continues the trend we reported last week. Whilst “a swallow does not make a summer”, it could be a leading indicator of trouble ahead.

If the data is correct, the current home sales momentum is likely to slow in coming months.

The Property Imperative 8 Now Available

The latest and updated edition of our flagship report “The Property Imperative” is now available with data to end February 2017. This eighth edition updates the current state of the market by looking at the activities of different household groups using our recent primary research, and other available data. It features recent work from the DFA Blog and also contains new original research.

In this edition, we look at mortgage stress and defaults across both owner occupied and investment loans, housing affordability and the updated impact of “The Bank of Mum and Dad” on first time buyers.

We also examine the latest dynamics in the property investment sector including a review of portfolio investors, and discuss recent leading indicators which may suggest a future downturn.

The overall level of household debt continues to rise and investment loans are back in favour at the moment, though this may change. Here is the table of contents.

1       Introduction. 
2       The Property Imperative – Winners and Losers. 
2.1         An Overview of the Australian Residential Property Market.
2.2         Home Price Trends. 
2.3         The Lending Environment. 
2.4         Bank Portfolio Analysis. 
2.5         Broker Shares And Commissions. 
2.6         Market Aggregate Demand.
3       Segmentation Analysis. 
3.1         Want-to-Buys. 
3.2         First Timers.
3.3         Refinancers.
3.4         Holders. 
3.5         Up-Traders.
3.6         Down-Traders. 
3.7         Solo Investors. 
3.8         Portfolio Investors.
3.9         Super Investment Property. 
4       Mortgage Stress and Default.
4.1         State And Regional Analysis. 
4.2         Stress By Household Profile. 
4.3         Stress By Property Segments.
4.4         Stress By Household Segments. 
4.5         Post Code Level Analysis.
4.6         Top 100 Post Codes And Geo-mapping. 
5       Interest Rate Sensitivity. 
5.1         Owner Occupied Borrowers. 
5.1.1          Sensitivity by Loan Value. 
5.2         Cumulative Sensitivity. 
5.2.1          Owner Occupied Borrowers. 
5.2.2          Investment Loan Borrowers. 
5.2.3          Owner Occupied AND Investment Loan Borrowers. 
6       Housing Affordability And Hot Air.

Request the free report [61 pages] using the form below. You should get confirmation your message was sent immediately and you will receive an email with the report attached after a short delay.

Note this will NOT automatically send you our ongoing research updates, for that register here.

[contact-form to=’mnorth@digitalfinanceanalytics.com’ subject=’Request for The Property Imperative Report 8′][contact-field label=’Name’ type=’name’ required=’1’/][contact-field label=’Email’ type=’email’ required=’1’/][contact-field label=’Email Me The Report’ type=’radio’ options=’Yes Please’ required=’1′ /][contact-field label=’Comment If You Like’ type=’textarea’/][/contact-form]

Housing affordability on governments’ agenda

From The Real Estate Conversation.

Gladys Berejiklian and Malcolm Turnbull’s governments are seeking solutions to the housing affordability problem.

Both new New South Wales premier Gladys Berejiklian and prime minister Malcolm Turnbull have put housing affordability firmly on their agenda.

With Domain’s latest price report showing the national median house price soared 7.7% to $781,000 in the year to December 2016, and apartments prices soared 3.4% to $546,000, housing affordability has been flung back into the spotlight.

Though the picture varies across the country – Darwin house prices fell 10.5% in the year to December, and Perth prices were down 2.3% according to the Domain report – there are pockets of Australia where it is now well beyond the reach of average wage earners to buy their own home

Berejiklian told ABC News last night, when asked if she would consider abolishing stamp duty, “We’re certainly looking at all options.” She emphasised that supply had already increased under the current NSW government.

She said, “I want to make sure the average person doesn’t feel owning their own home is out of their reach,” saying she wanted to make is easy for residents to buy their first home.

Malcolm Turnbull has also turned his attention to housing affordability, with treasurer Scott Morrison in London to look at how Britain has enabled more people to buy their own home. Turnbull also last week appointed Victorian MP Michael Sukkar as Assistant Minister to the Treasurer with the main responsibility of addressing housing affordability.

The Definitive Guide To Our Latest Mortgage Stress Research

We have had an avalanche of requests for further information about our monthly mortgage stress research which is published as a series of blog posts plus coverage in the media, including Four Corners. Here is the timeline of recent posts, which together provides a comprehensive view of the work.

Check out our media coverage.

A Cumulative View Of Mortgage Rate Sensitivity

We had significant interest in our recent posts on mortgage rate sensitivity in a rising market. One recurring request was for a cumulative view of rate sensitivity. So today we post these views on a segmented basis, using our master household segmentation.

A quick recap, we updated our analysis of how sensitive households with an owner occupied mortgage are to an interest rate rise, using data from our household surveys. This is important because we now expect mortgage rates to rise over the next few months, as higher funding costs and competitive dynamics come into pay, and as regulators bear down on lending standards.

To complete this analysis we examine how much headroom households have to rising rates, taking account of their income, size of mortgage, whether they have paid ahead, and other financial commitments. We then run scenarios across the data, until they trip the mortgage stress threshold.

At this level, they will be in difficulty.  The chart shows the relative distribution of borrowing households, by number. So, around 20% would have difficulty with even a rise of less than 0.5%, whilst an additional 4% would be troubled by a rise between 0.5% and 1%, and so on. Around 35% could cope with even a full 7% rise.

The chart below shows a segment view of this sensitivity. We add the score for each interest rate band. Young Affluent households are most sensitive to rate rises, thanks to large mortgages and static incomes. Young Growing Families are not far behind, but their household budgets are quite different. Other segments are more resilient, though a proportion of Exclusive Professionals are also highly leveraged. This first view takes account only of the owner occupied mortgages.

We can also overlay investment mortgages, and this changes the picture somewhat, when combined with owner occupied statistics. We see that the extra commitments have lifted the rate sensitivity, for example moving Exclusive Professionals from 36% to 54% exposed to a small rate increase.

Overall we see that some households really have very little headroom to cope with rising rates, a symptom of high household indebtedness.  Others are well protected and are also paying ahead.

Positive Property News Supports Household Finance Confidence

The latest Digital Finance Analytics Household Finance Confidence Index, to end December is released today. Overall household confidence is buoyant, and above the neutral setting. Sitting at 103.2, it is up from 100.02 in November.

The property “fairy” has been generous in that property is the key to the index at the moment, with positive news on home price rises, and the effect of the low interest rates following the last RBA cash rate cut flowing through. Home owners with an investment property have now overtaken the confidence score of owner occupied property holders, but both are higher. Those households who are not property active however continue to languish.

We see significant state variations, with those in NSW and VIC most confident, whilst those in WA, although slightly higher, is significantly off the pace.  The impact of changes to the first owner grant there will not flow through into the results for some time to come.

The impact of positive property news has swamped a couple of the negative indicators. For example, more households are saying their costs of living have risen in the past 12 months.

In addition, real incomes, after adjusting for inflation are static or falling. Very few have had any pay rises above inflation, and many none at all.

So, it seems the future of household confidence is joined at the hip with the future of property. In the light of our recent mortgage default modelling, in a rising interest rate market, this may be a concern as we progress through 2017. But at the moment, households are having a party!

By way of background, these results are derived from our household surveys, averaged across Australia. We have 26,000 households in our sample at any one time. We include detailed questions covering various aspects of a household’s financial footprint. The index measures how households are feeling about their financial health. To calculate the index we ask questions which cover a number of different dimensions. We start by asking households how confident they are feeling about their job security, whether their real income has risen or fallen in the past year, their view on their costs of living over the same period, whether they have increased their loans and other outstanding debts including credit cards and whether they are saving more than last year. Finally we ask about their overall change in net worth over the past 12 months – by net worth we mean net assets less outstanding debts.