Household Financial Security Takes Another Hit In November

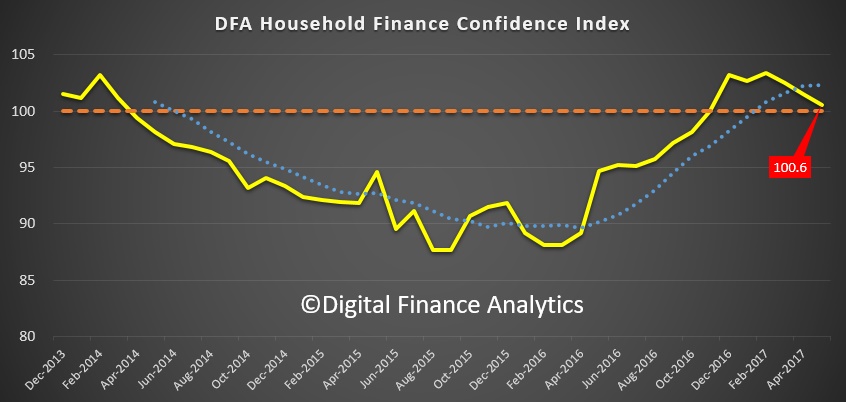
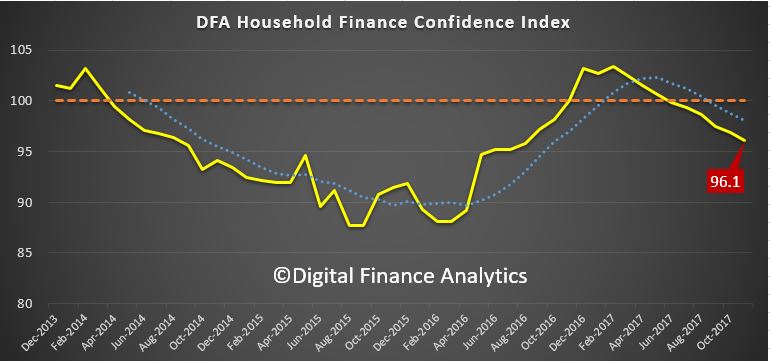
Digital Finance Analytics has released the November 2017 results from our Household Financial Security Index. The index uses data from our household surveys to assess households level of financial comfort.

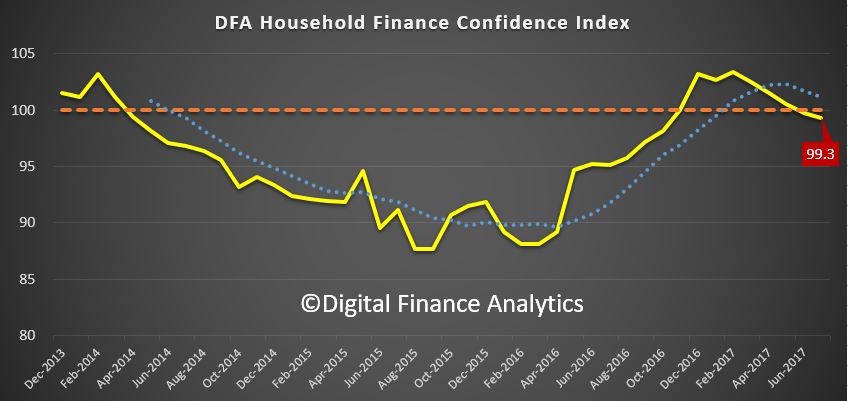
The index fell to 96.1, which is below the 100 neutral metric, down from 96.9 in October 2017. This is the sixth month in succession the index has been below the neutral point.

Watch the video or read the transcript.

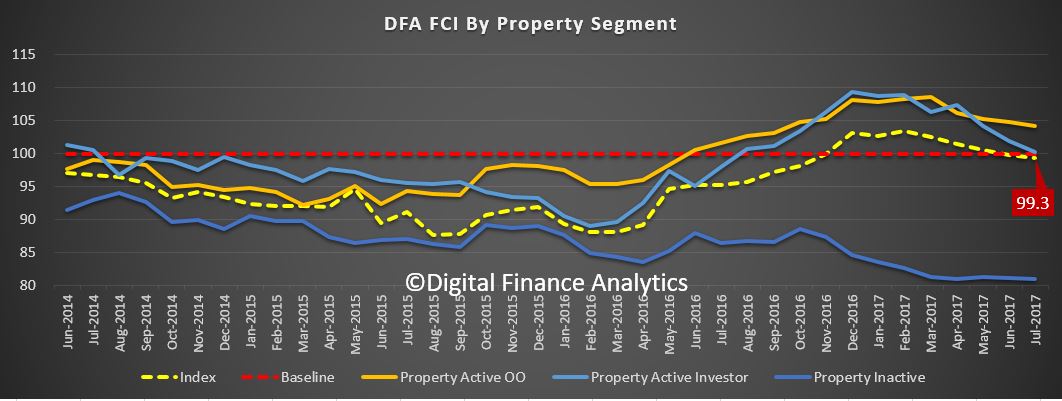
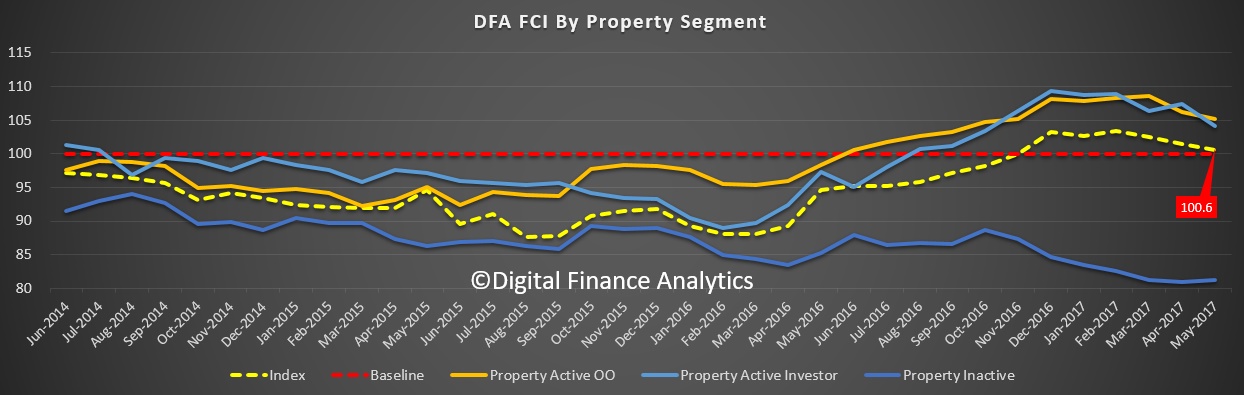
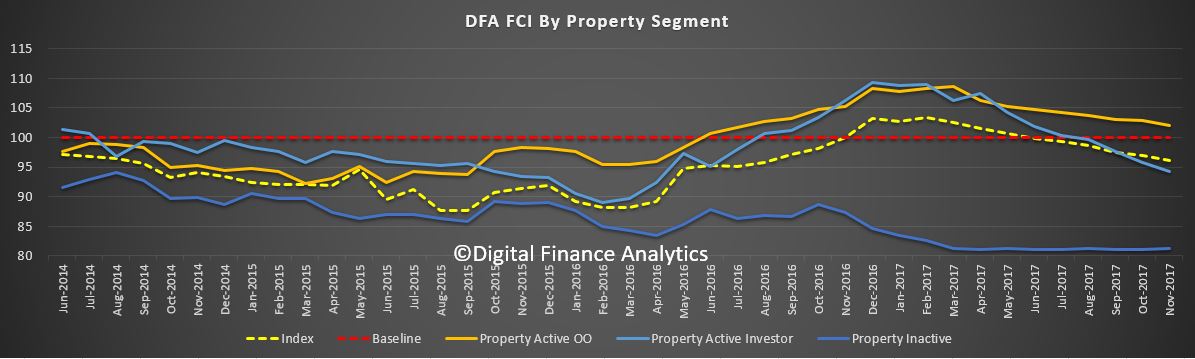
Owner Occupied households are the most positive, scoring 102, whilst those with investment property are at 94.3, as they react to higher mortgage repayments (rate rises and switching from interest only mortgages), while rental yields fall, and capital growth is stalling, especially in Sydney).  Households who are not holding property – our Property Inactive segment – will be renting or living with friends or family, and they scored 81.2. So those with property are still more positive overall.

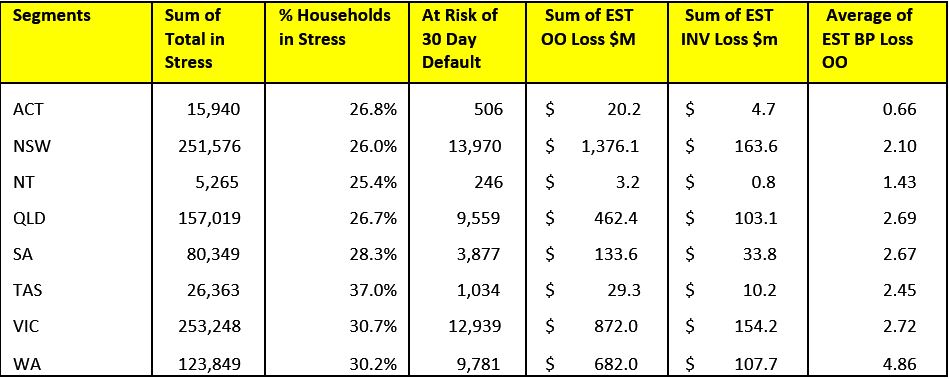
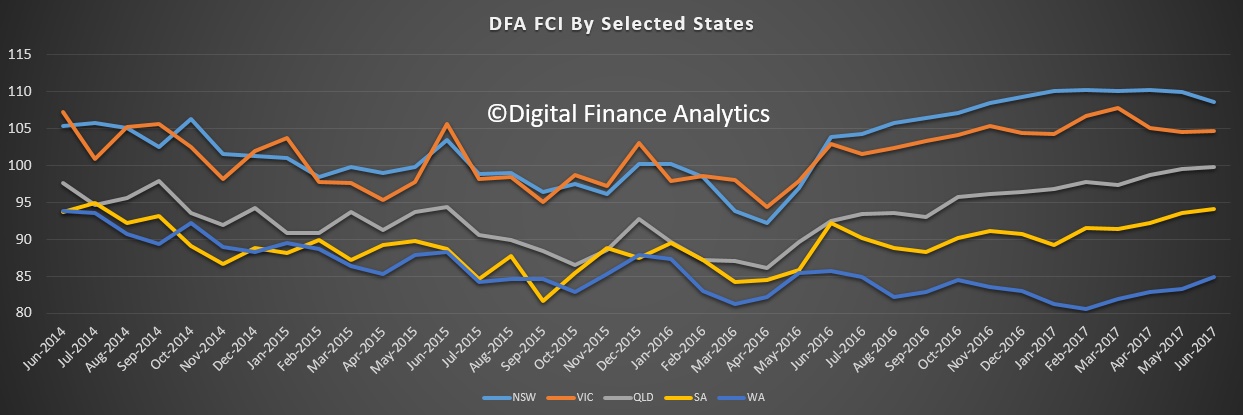
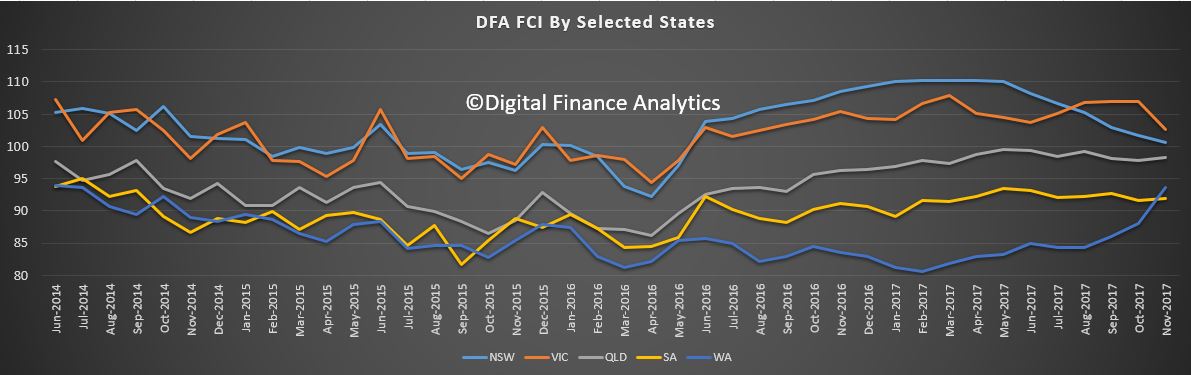
Looking across the states, households in NSW and VIC are just above the neutral setting, but continue to slipping lower. Households in QLD are below the 100, but up a little, as are those in SA and WA. Western Australian households are the least positive, but somewhat improved.

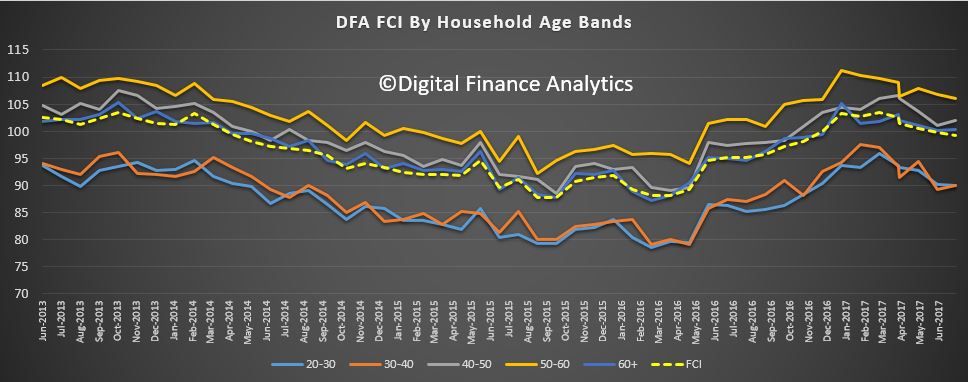
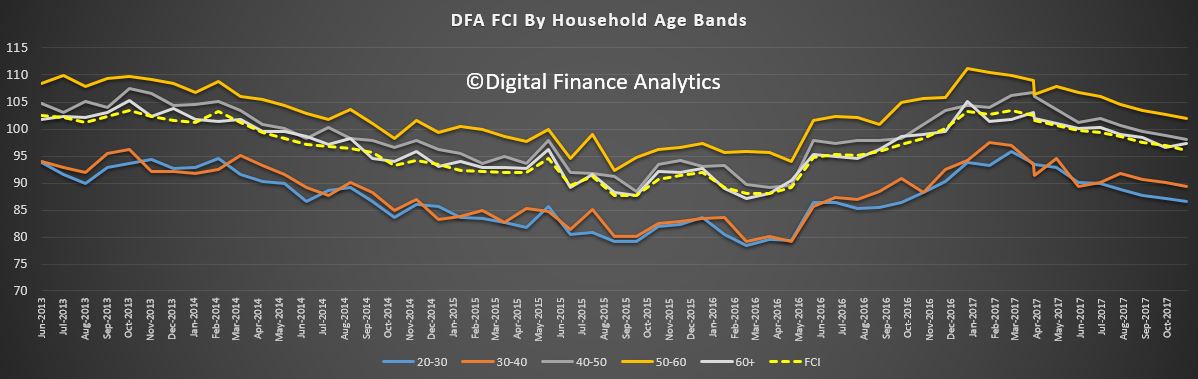
Looking across the age ranges, younger households are the least positive, and all ages banks fell, other than those over 60 years which saw a small rise.

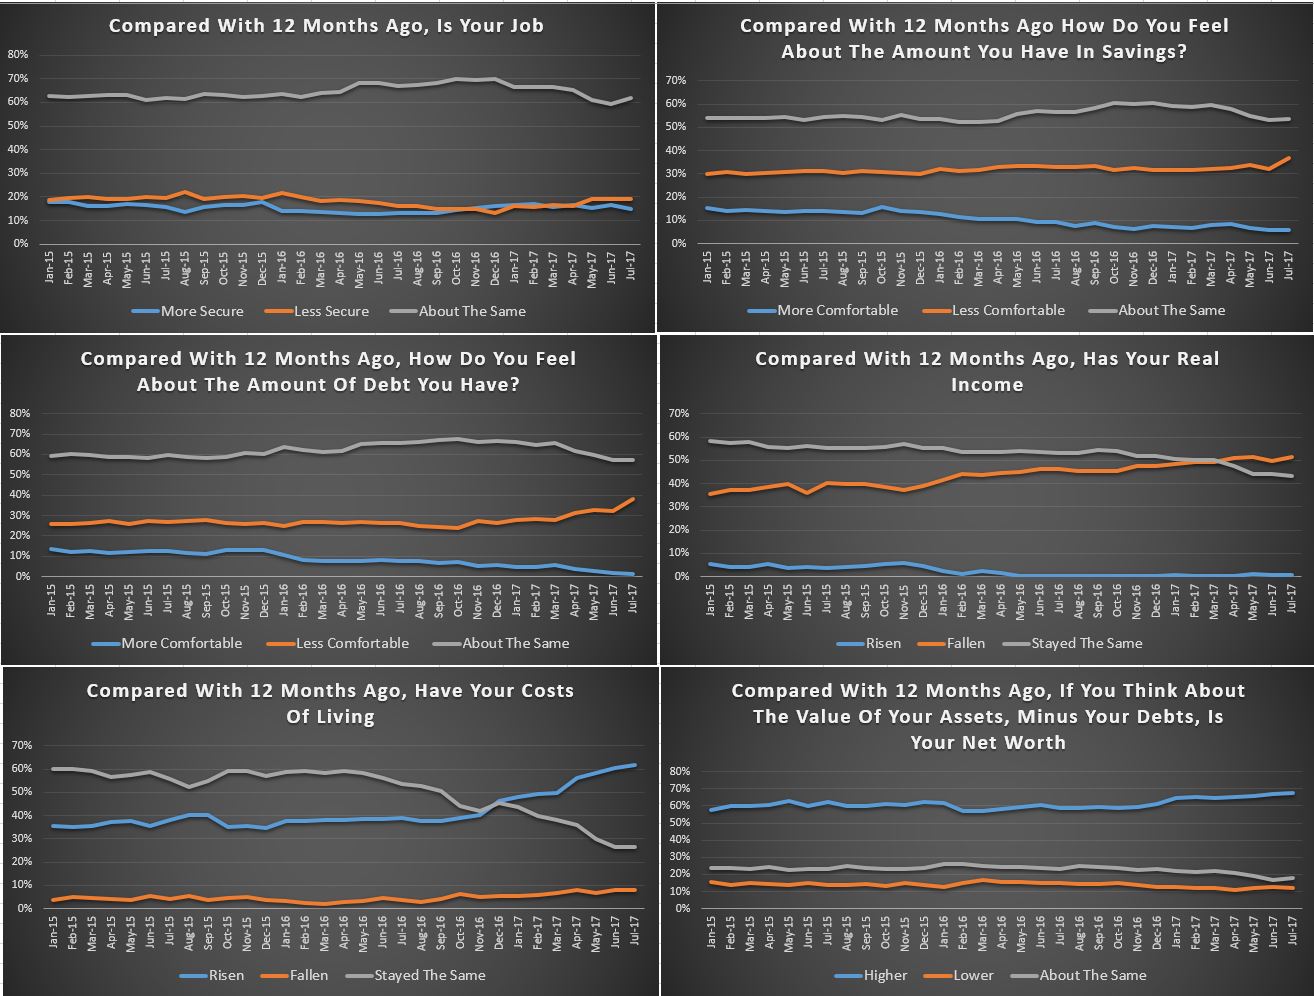
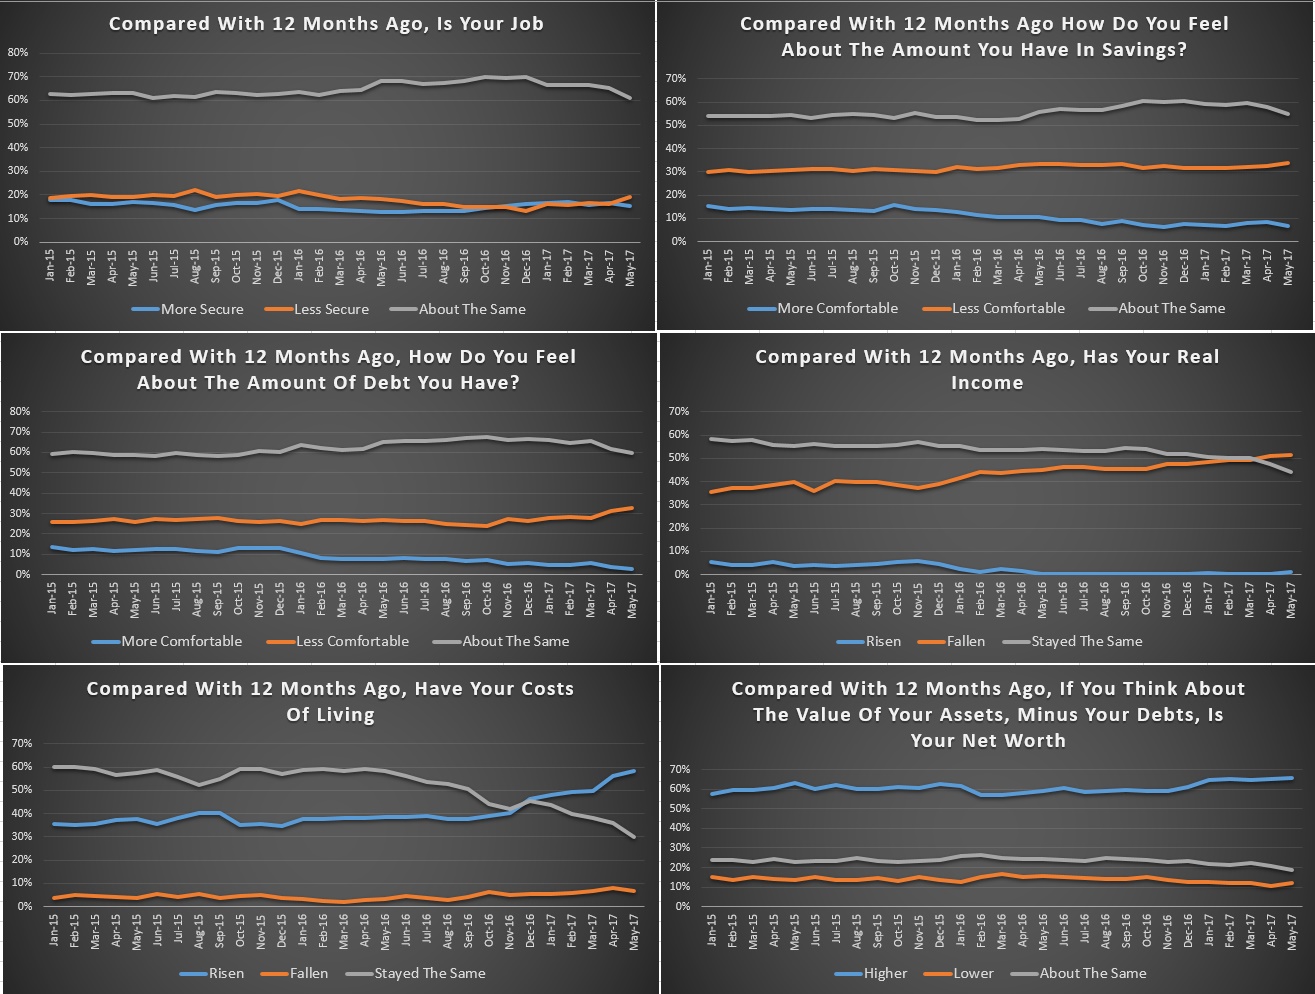
Looking at the FCI score card, job security is on the improve, reflecting rising employment participation, and the lower unemployment rate.  Around 20% of households feel less secure, especially those with multiple part time jobs.

Savings are being depleted to fill the gap between income and expenditure – as we see in the falling savings ratio. As a result, nearly 40% of households are less comfortable with the amount they are saving. This is reinforced by the lower returns on deposit accounts as banks seek to protect margins.

More households are uncomfortable with the amount of debt they hold with 40% of households concerned. The pressure of higher interest rates on loans, tighter lending conditions, and low income growth all adds to the discomfort. More households reported their real incomes had fallen in the part year, with 50% seeing a fall, while 40% see no change.  Only those on very high incomes reported real income growth.

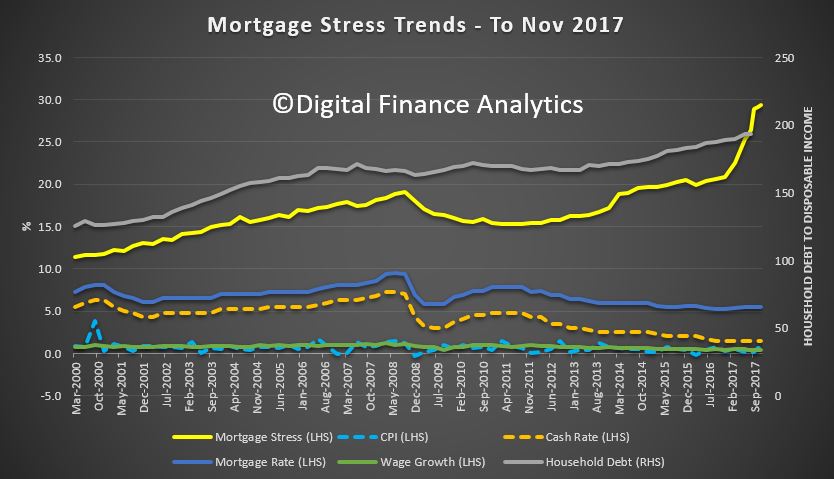
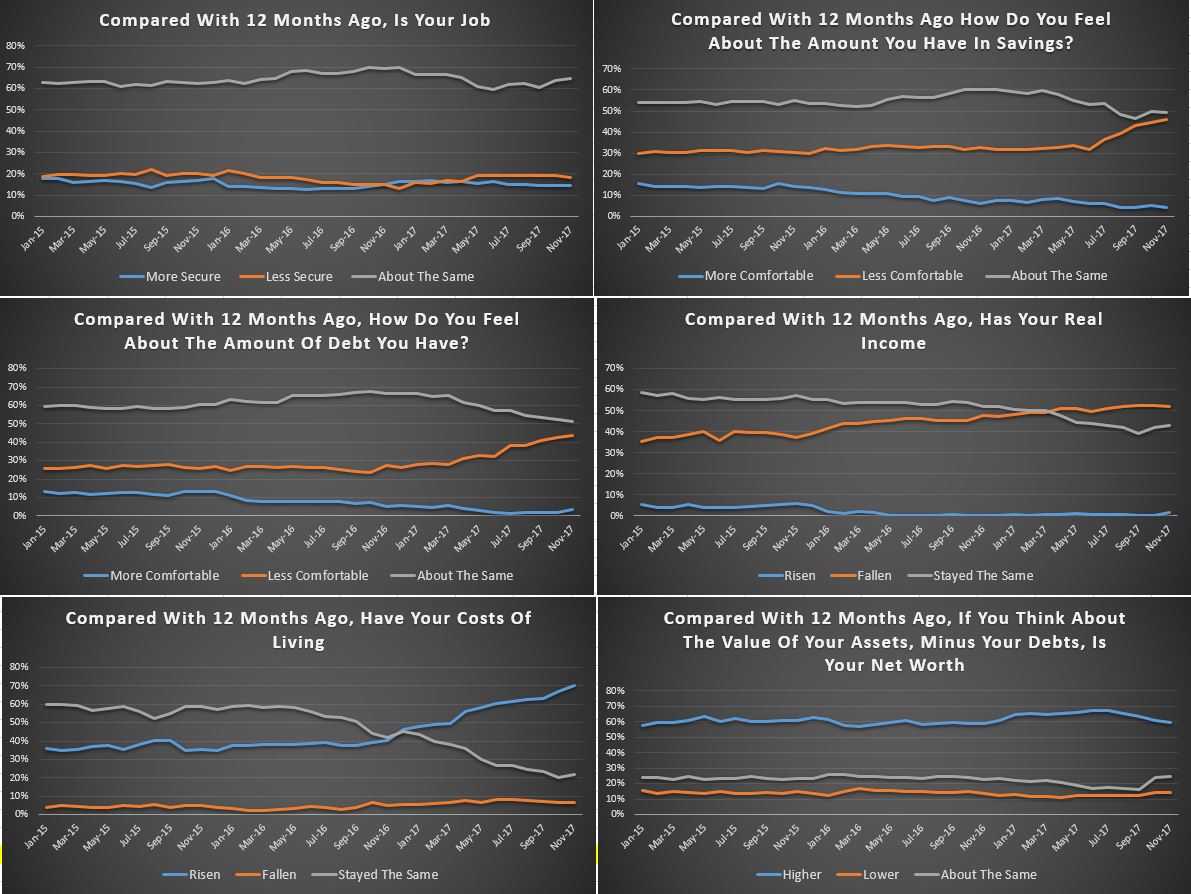
More households reported a rise in their costs of living, and this month this included higher school fees and child care costs, energy bills and fuel costs. The average cpi of around 2% appears to understate the real life experience of many households.

Finally, household net worth improved for more than 60% of households, but there is a rise in those seeing no growth, mainly as home price growth eases back. Those with share market investments have done quite well in recent months.

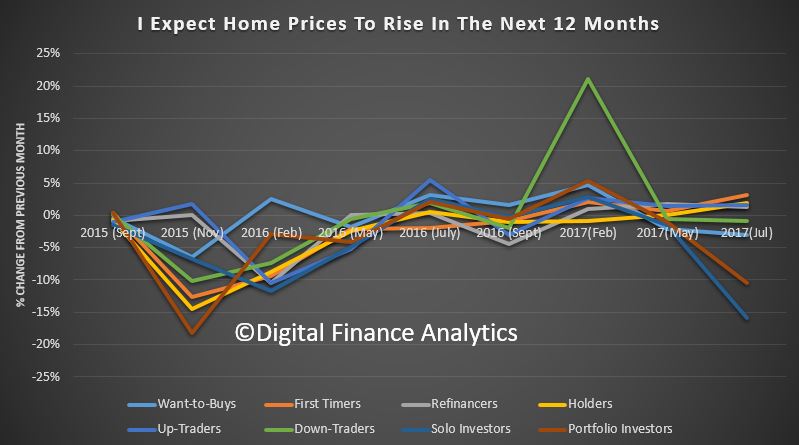
Looking ahead, we expect the overall index to trend lower, as incomes remain constrained, and costs of living grow. The property market has a big impact on households level of confidence and the leading indicators are flagging lower outcomes ahead.  However, home prices would need to fall significantly to allow many of those currently unable to afford to buy in to the market.

By way of background, these results are derived from our household surveys, averaged across Australia. We have 52,000 households in our sample at any one time. We include detailed questions covering various aspects of a household’s financial footprint. The index measures how households are feeling about their financial health. To calculate the index we ask questions which cover a number of different dimensions. We start by asking households how confident they are feeling about their job security, whether their real income has risen or fallen in the past year, their view on their costs of living over the same period, whether they have increased their loans and other outstanding debts including credit cards and whether they are saving more than last year. Finally we ask about their overall change in net worth over the past 12 months – by net worth we mean net assets less outstanding debts.

We will update the results again next month.


Mortgage Stress Continues On a High Plateau In November

Digital Finance Analytics has released the November mortgage stress and default analysis update. Across Australia, more than 913,000 households are estimated to be now in mortgage stress (last month 910,000) and more than 21,000 of these in severe stress, the same as last month. Stress is sitting on a high plateau. This equates to 29.4% of households. We see continued default pressure building in Western Australia, as well as among more affluent household, beyond the traditional mortgage belts across the country. Stress eased a little in Queensland, thanks to better employment prospects.

We estimate that more than 52,000 households risk 30-day default in the next 12 months, similar to last month. We expect bank portfolio losses to be around 2.8 basis points, though with losses in WA rising to 4.9 basis points.

We discuss the findings from our analysis and count down the top 10 post codes, to identify the most highly stressed post code currently in the country.

As continued pressure from low wage growth and rising costs bites, those with larger mortgages are having more difficulty balancing the family budget. As a result, risks in the system continue to rise, and while recent strengthening of lending standards will help protect new borrowers, there are many households currently holding loans which would not now be approved. These stressed households are less likely to spend at the shops, which will act as a further drag anchor on future growth, one reason why retail spending is muted. The number of households impacted are economically significant, especially as household debt continues to climb to new record levels. Mortgage lending is still growing at three times income. This is not sustainable. The latest household debt to income ratio is now at a record 193.7.[1]

Our analysis uses the DFA core market model which combines information from our 52,000 household surveys, public data from the RBA, ABS and APRA; and private data from lenders and aggregators. The data is current to end November 2017. We analyse household cash flow based on real incomes, outgoings and mortgage repayments, rather than using an arbitrary 30% of income.

Households are defined as “stressed” when net income (or cash flow) does not cover ongoing costs. Households in mild stress have little leeway in their cash flows, whereas those in severe stress are unable to meet repayments from current income. In both cases, households manage this deficit by cutting back on spending, putting more on credit cards and seeking to refinance, restructure or sell their home.  Those in severe stress are more likely to be seeking hardship assistance and are often forced to sell.

The forces which are lifting mortgage stress levels remain largely the same. In cash flow terms, we see households having to cope with rising living costs whilst real incomes continue to fall and underemployment remains high. Households have larger mortgages, thanks to the strong rise in home prices, especially in the main eastern state centres. While mortgage rates remain quite low for owner occupied borrowers, those with interest only loans or investment loans have seen significant rises.  We expect some upward pressure on real mortgage rates in the next year as international funding pressures mount, a potential for local rate rises and margin pressure on the banks. We revised our expectation of potential interest rate rises, given the stronger data on the global economy and the recently announced Finance Sector  Royal Commission.

Probability of default extends our mortgage stress analysis by overlaying economic indicators such as employment, future wage growth and cpi changes.  We have also extended our Core Market Model to examine the potential of portfolio risk of loss in basis point and value terms. Losses are likely to be higher among more affluent households.

Gill North, Joint DFA Principal and Professorial Research Fellow in the law school at Deakin University, said “the numbers of households in mortgage and financial stress in Australia are at record levels and the consequential risks and likely adverse impacts are difficult to overstate. When external events and or the personal circumstances of these highly indebted households deteriorate, the number of people who cannot afford to rent or purchase a home is likely to increase exponentially, leaving many more households without adequate accommodation. In extreme instances, other households may lose the residential property they presently live in due to rental defaults or a forced sale or foreclosure.”

While there have been numerous inquiries into housing affordability and homelessness in Australia, the issues involved are complex, and real progress has been limited (at best). For policy options to make any meaningful difference to the nature and scale of housing affordability and homelessness, policy makers and others need to acknowledge the sheer magnitude of the problem, and respond accordingly.

One of the options that policy makers have considered to address affordable housing issues and to provide housing for the most vulnerable sections of the community is the use of social impact investment.  Gill North was part of a team that reviewed the potential for impact investment models to provide housing for the vulnerable and reported to the Australian Housing and Urban Research Institute (AHURI). The report on “Supporting Vulnerable Households To Achieve Their Housing Goals: The Role Of Impact Investment” is available from https://ssrn.com/author=905894. The report authors acknowledge and thank AHURI for the funding that allowed this important research”.

By the Numbers

Regional analysis shows that NSW has 251,576 households in stress (242,399 last month), VIC 253,248 (250,259 last month), QLD 157,019 (162,726 last month) and WA 123,849 (121,393 last month). The probability of default rose, with around 9,800 in WA, around 9,600 in QLD, 13,000 in VIC and 13,900 in NSW.

The largest financial losses relating to bank write-offs reside in NSW ($1.3 billion from Owner Occupied borrowers) and VIC ($870 million from Owner Occupied Borrowers, which equates to 2.1 and 2.7 basis points respectively. Losses are likely to be highest in WA at 4.9 basis points, which equates to $682 million from Owner Occupied borrowers and $108 million from Property Investors over the next 12 months.

You can request our media release. Note this will NOT automatically send you our research updates, for that register here.

[contact-form to=’mnorth@digitalfinanceanalytics.com’ subject=’Request The Nov 2017 Stress Release’][contact-field label=’Name’ type=’name’ required=’1’/][contact-field label=’Email’ type=’email’ required=’1’/][contact-field label=’Email Me The Nov 2017 Media Release’ type=’radio’ required=’1′ options=’Yes Please’/][contact-field label=”Comment If You Like” type=”textarea”/][/contact-form]

Note that the detailed results from our surveys and analysis are made available to our paying clients.

[1] RBA E2 Household Finances – Selected Ratios June 2017

Time For “Digital First” – The Quiet Revolution Report Vol 3 Released

Digital Finance Analytics has released the latest edition of our flagship channel preferences report – “The Quiet Revolution” Volume 3, now available free on request, using the form below.

This report contains the latest results from our household surveys with a focus on their use of banking channels, preferred devices and social media trends.

Our research shows that consumers have largely migrated into the digital world and have a strong expectation that existing banking services will be delivered via mobile devices and new enhanced services will be extended to them. Even “Digital Luddites”, the least willing to migrate are nevertheless finally moving into the digital domain. Now the gap between expectation and reality is larger than ever.

Looking across the transaction life cycle, from search, apply, transact and service; universally the desire by households to engage digitally is now so compelling that banks have no choice but to respond more completely.

We also identified a number of compelling new services which consumers indicated they were expecting to see, and players need to develop plans to move into these next generation banking offerings. Many centre around bots, smart agents and “Siri-Like” capabilities.

We have developed a mud-map to illustrate the journey of investment and disinvestment in banking. The DFA Banking Innovation Life Cycle, which is informed by our research, highlights the number of current assets and functions which are in the slope of decline, and those climbing the hill of innovation.  A number of current “fixtures” in the banking landscape will decline in importance, and in relatively short order.

We are now at a critical inflection point in the development of banking as digital now takes the lead.  Players must move from omni-channel towards digital first strategies, where the deployment of existing services via mobile is just the first stage in the development of new services, designed from the customers point of view and offering real value added capabilities. These must be delivered via mobile devices, and leverage the capabilities of social media, big data and advanced analytics.

This is certainly not a cost reduction exercise, although the reduction in branch footprint, which we already see as 10% of outlets have closed in the past 2 years, does offer the opportunity to reduce the running costs of the physical infrastructure. Significant investment will need to be made in new core capabilities, as well as the reengineering of existing back-end systems and processes. At the same time banks must deal with their “stranded costs”.

The biggest challenges in this migration are cultural and managerial. But the evidence is clear that customers are already way ahead of where most banks are in Australia today. This means there is early mover advantage, for those who handle the transition swiftly. It is time to get off the fence, and on the digital transformation fast track. Now, banking has to be rebuilt from the bottom up. Digitally.

Request the report [44 pages] using the form below. You should get confirmation your message was sent immediately and you will receive an email with the report attached after a short delay.

Note this will NOT automatically send you our research updates, for that register here. You can find details of our other research programmes here.

[contact-form to=’mnorth@digitalfinanceanalytics.com’ subject=’Request The Quiet Revolution Report 3 – 2018′][contact-field label=’Name’ type=’name’ required=’1’/][contact-field label=’Email’ type=’email’ required=’1’/][contact-field label=’Email Me The Report’ type=’radio’ required=’1′ options=’Yes Please’/][contact-field label=’Comment if You Like’ type=’textarea’/][/contact-form]

The first edition is still available, in which we discuss the digital branding of incumbents and challengers, using our thought experiment.

Volume 2 from 2016 is also available.

The Property Imperative Volume 9 Report Released

The latest and updated edition of our flagship report “The Property Imperative” is now available on request with data to mid October 2017.

This Property Imperative Report is a distillation of our research into the finance and property market, using data from our household surveys and other public data. Whilst we provide weekly updates via our blog, twice a year we publish this report. This is volume 9. It offers, in one place, a unique summary of the finance and property markets, from a household perspective.

Residential property, and the mortgage industry is currently under the microscope, as never before. Around two thirds of all households have interests in residential property, and about half of these have mortgages. More households are excluded completely and are forced to rent, or live with family or friends.

We believe we are at a significant inflection point and the market risks are rising. Many recent studies appear to support this view. There are a number of concerning trends. While household incomes are flat in real terms, the size of the average mortgage has grown significantly in the past few year, thanks to rising home prices (in some states), changed lending standards, and consumer appetite for debt. In fact, consumer debt has never been higher in Australia. As a result, households are getting loans later, holding mortgages for longer, even in to retirement, so household finances are being severely impacted, and more recent changes in underwriting standards are making finance less available to many.

Property Investors still make up a significant share of total borrowing, and experience around the world shows it is these households who are more fickle in a downturn. Many use interest only loans, which create risks downstream, and regulators have recently been applying pressure to lenders to curtail their growth.

Mortgage rates are now higher for Investors and those holding Interest Only loans, while low-risk customers with a Principal and Interest loan should be able to find some amazingly low rates. While mortgage underwriting standards are now tighter, there is an overhang of existing loans which would now fall outside existing underwriting standards. Interest Only loans are especially at risk, not least because rental incomes are being compressed.

We hold the view that home prices are set to ease in coming months, as already foreshadowed in Sydney. We think mortgage rates are more likely to rise than fall as we move on into 2018.

Finally, lenders have been able to repair their margins, under the umbrella of supervisory intervention, and their back book repricing has created a war chest to fund attractor offers.

We will continue to track market developments in our weekly Property Imperative weekly video blogs, and publish a further consolidated update in about six months’ time.

Here is the table of contents.

1 EXECUTIVE SUMMARY
 2 TABLE OF CONTENTS
 3. OUR RESEARCH APPROACH
 4. THE DFA SEGMENTATION MODEL
 3 PROFILING THE PROPERTY MARKET
 3.1 Current Property Prices
 4 MORTGAGE LENDING TRENDS
 4.1 Total Housing Credit Is Up
 4.2 ADI Lending Trends Are Suspect
 4.3 Housing Finance Flows
 4.4 The Rise of the Bank of Mum and Dad
 5 HOUSEHOLD FINANCES AND RISKS
 5.1 RBA Financial Stability at Risk
 5.2 IMF Warnings On Growth and Debt
 5.3 Household Ratios Under Pressure
 5.4 Housing Occupancy Costs Are High
 5.5 Households Are Spending More On Basics
 5.6 Savings Are Shrinking
 5.7 DFA Mortgage Stress Rises Again
 5.8 Top Ten Stressed Post Codes
 5.9 More Households Have No Equity
 5.10 Greater Risks from Interest Only Loans
 5.11 The Consumption Crunch
 5.12 A Fall in Household Financial Security
 5.13 Mortgage Rates Will Rise – Sometime
 5.14 Defaults Are Down a Little, But Risks Remain
 5.15 Observations
 6 HOUSEHOLDS’ DEMAND FOR PROPERTY
 6.1 Property Active and Inactive Households
 6.2 Cross Segment Comparisons
 6.3 Property Investors
 6.4 How Many Properties Do Investors Have?
 6.5 SMSF Property Investors
 6.6 First Time Buyers.
 6.7 Up Traders and Down Traders
 6.8 Auction Clearances Remain Quite Strong
 7 MORTGAGE UNDERWRITING STANDARDS
 7.1 ASIC Looks at Interest Only Loans
 7.2 APRA Lifts Capital
 7.3 APRA Lifts Underwriting Standards
 7.4 APRA to Regulate Non-Bank Lenders
 7.5 APRA Delays Mortgage Reporting Standards
 7.6 The Impact On Interest Only Loans
 7.7 Standards Are Tighter Now
 7.8 Risks Are Increasing; Standards Still Too Lose
 8 MORTGAGE PRICING
 8.1 It Pays to Haggle
 9 FINAL OBSERVATIONS
 10 ABOUT DFA
 11 COPYRIGHT AND TERMS OF USE

Request the free report [72 pages] using the form below. You should get confirmation your message was sent immediately and you will receive an email with the report attached after a short delay.

Note this will NOT automatically send you our ongoing research updates, for that register here.

[contact-form to=’mnorth@digitalfinanceanalytics.com’ subject=’Request for The Property Imperative Report 9′][contact-field label=’Name’ type=’name’ required=’1’/][contact-field label=’Email’ type=’email’ required=’1’/][contact-field label=’Email Me The Report’ type=’radio’ options=’Yes Please’ required=’1′ /][contact-field label=’Comment If You Like’ type=’textarea’/][/contact-form]

DFA’s SME Report 2017 Released

The latest results from the Digital Finance Analytics Small and Medium Business Survey, based on research from 52,000 firms over the past 12 months, is now available on request.   You can use the form below to obtain a free copy of the report.

There are around 2.2 million small and medium businesses (SME) operating in Australia, and nearly 5 million Australian households rely on income from them directly or indirectly. So a healthy SME sector is essential for the future growth of the country.

However, the latest edition of our report reveals that more than half of small business owners are not getting the financial assistance they require from lenders in Australia to grow their businesses.

Most SME’s are now digitally literate, yet the range of products and services offered to them via online channels remains below their expectations.

More SME’s are willing to embrace non-traditional lenders, via Fintech, thanks to greater penetration of digital devices, and more familiarity with these new players. In addition, many firms said they would consider switching banks, but in practice they do not.

Overall business confidence has improved a bit compared with our previous report, but the amount of “red tape” which firms have to navigate is a considerable barrier to growth.

Running a business is not easy. In some industries, more than half of newly formed businesses are likely to fail within three years. We found that banks are not offering the broader advice and assistance which could assist a newer business, so even simple concepts like cash flow management, overtrading and debtor management are not necessarily well understood. There is a significant opportunity for players to step up to assist, and in so doing they could cement and strengthen existing relationships as well as creating new ones.

We think simple “Robo-Advice” could be offered as part of a set of business services.

The sector is complex, and one-size certainly does not fit all. In this edition, we focus in particular on what we call “the voice of the customer”. In the body of the report we reveal the core market segmentation which we use for our analysis and we also explore this data at a summary level.

Here is a short video summary of the key findings.

The detailed results from the surveys are made available to our paying clients (details on request), but this report provides an overall summary of some of the main findings. We make only brief reference to our state by state findings, which are also covered in the full survey. Feel free to contact DFA if you require more information, or something specific. Our surveys can be extended to meet specific client needs.

Note this will NOT automatically send you our research updates, for that register here.

[contact-form to=’mnorth@digitalfinanceanalytics.com’ subject=’Request The 2017 DFA SME Report’][contact-field label=’Name’ type=’name’ required=’1’/][contact-field label=’Email’ type=’email’ required=’1’/][contact-field label=’Email Me The Report’ type=’radio’ required=’1′ options=’Yes Please’/][contact-field label=”Comment If You Like” type=”textarea”/][/contact-form]

Household Finance Confidence Continues To Fall

Digital Finance Analytics has released the July results from our Household Finance Confidence Index, which shows a further fall, with momentum decaying.

The average score was 99.3, down from 99.8 last month and below the neutral setting. However, the average score masks significant differences across the dimensions of the survey results. For example, younger households are considerably more negative, compared with older groups.

This is strongly linked with property owning status, with those renting well below the neutral setting (and more younger households rent these days), whilst owner occupied home owners are significantly more positive. We also see a fall in the confidence of property investors, relative to owner occupied owners.

Across the states,  we see a small decline in confidence in NSW from a strong starting point, whilst VIC households were more confident in July.

The driver scorecard shows little change in job security expectations, but lower interest rates on deposits continue to hit savings. Households are more concerned about the level of debt held, as interest rate rises bite home. The impact of flat or falling incomes registers strongly, with more households saying, in real terms they are worse off. Costs of living are rising fast, with the changes in energy prices, child care costs and council rates all hitting hard. That said, the continued rises in home prices, especially in the eastern states meant that net worth for households in these states rose again, which was not the case in WA, NT or SA.

Sentiment in the property sector is clearly a major influence on how households are feeling about their finances, but the real dampening force is falling real incomes and rising costs. As a result, we still expect to see the index fall further as we move into spring, as more price hikes come through. In addition, the raft of investor mortgage rate repricing will hit, whilst rental returns remain muted.

By way of background, these results are derived from our household surveys, averaged across Australia. We have 52,000 households in our sample at any one time. We include detailed questions covering various aspects of a household’s financial footprint. The index measures how households are feeling about their financial health. To calculate the index we ask questions which cover a number of different dimensions. We start by asking households how confident they are feeling about their job security, whether their real income has risen or fallen in the past year, their view on their costs of living over the same period, whether they have increased their loans and other outstanding debts including credit cards and whether they are saving more than last year. Finally we ask about their overall change in net worth over the past 12 months – by net worth we mean net assets less outstanding debts.


Rental Stress, The Hidden Problem

There is much discussion of mortgage stress, some of which we highlight by our ongoing research into the growing numbers of households under financial pressure. The results for July will be out soon.

But rental stress is less discussed, but in our mind is equally significant, so today we explore some of the data in our Core Market Model to July 17. In fact there are more households in rental stress than in mortgage stress according to our analysis. We know their financial confidence on average is lower.

First, we need to define rental stress. Whilst some will use a “30% of income to pay the rent” as a benchmark, we do not think it is an adequate measure – not least because we see large numbers of households renting where more than 30% of income is paid away on rent, yet they are not in financial difficulty. Others pay less away, but are in stress. 30% is too arbitrary!

So we look at net cash flow. If households, once they pay their rent, tax and other outgoings have close to nothing left, or a small deficit, at the end of the month, they fall into our mild stressed category. Those with a severe cash deficit at the end of the month, are in serve stress.

We start by looking at the causes of rental stress. Using data from our surveys, we find that costs of living, under employment and flat incomes are the main causes of rental stress.

Those renting tend to hold less financial assets, so are more exposed, especially where they are also responsible for bills (electricity, council rates etc). Those in difficulty will be more likely to hold multiple credit cards, and also access short term loans to get by. Those in the stressed categories will be less likely to spend at the shops, and so are a brake on economic activity.  One strategy some use is to move to cheaper rented accommodation, with poorer facilities to reduce outgoings. The migratory nature of renters, especially those in stress are not well understood. The current tenancy regulations in Australia are pretty weak. Much of this movement is not reported, nor recorded.

So, lets look at some of the numbers, remembering one third of households are renting, in round numbers that is 3 million households.

Looking by state, more than half of renters in NSW are in rental stress (on our definition), and the highest proportion of any state here are in severe rental stress. The proportion of households in stress fades away as we look across the other states and territories. But the three most populous states have the highest rental stress levels.

Looking across our segments, we see that older households are more under stress, and a significant proportion in severe stress.  Whilst wealthy seniors may hold some savings, stressed seniors do not. Many are reliant on Government support.

Looking across the geographic zones (a series of concentric rings around our main urban hubs) we see significant levels of stress in the urban centres, as well as on the urban fringe. The former is being created by high rents – especially in the newly constructed high-rise blocks being thrown up across the eastern states, often occupied by young affluent households; whilst in the urban fringe, it is more about depressed incomes. We see stress rolling out into the regions, but is less apparent in the more rural and remote areas.

Finally, here is list of the regions across the country. Greater Sydney and the Central Coast have the highest representation of stressed renters as a proportion of all households renting.

All this highlights the issues we have due to the combination of flat incomes, and rising costs. It is also the obverse of the picture we revealed yesterday, where we showed rental growth is very low (causing more investors to have a net cash-flow problem).

Once again we see the outworking of poor public policy over a generation. With an internationally high proportion of property investors and a high proportion of people who are likely to never own their own property, rental stress provides another important perspective of the issues we face.

We have very granular data, down to post code, but that will get too detailed for this post.


Property Demand, Rotating, Not Falling

The latest results from the Digital Finance Analytics Household Surveys, show that whilst there are segmental movements in play, overall demand for property remains intact, despite rising mortgage interest rates and concerns about stalling income growth.

Results from the latest 52,000 survey show that first time buyers are being encouraged by the more generous first home owner grants on offer in several states. On the other hand, the relative benefit of home purchase relative to renting has reduced.

The biggest changes in the barriers first time buyers are experiencing relate to the availability of finance, whilst concerns about future interest rate rises, and rising costs of living reduced a little compared with our May results. Overall first time buyer demand is up.

Turning to property investors, the barriers to purchase are changing with a rise in those concerned about rising mortgage interest rates and availability of finance.

The reasons to transact have shifted, with a significant rise in those saying they were driven by tax benefits (both negative gearing and capital gains) whilst there was a fall in those looking to appreciating property prices and low finance rates. Overall, investor demand is down a bit.

Another important group are those refinancing. After a strong swing in 2016 to get a better loan rate, there has been a rise in those seeking to reduce their monthly repayments.

So plotting the change of transaction intention over the next 12 months, we see a significant fall in both portfolio and solo property investors, but a rise in first time buyer purchasers expecting to transact.

Finally, we see that in relative terms there is a fall in the proportion of property investors expecting to see home prices rising in the next 12 months, whilst first time buyers are a little more positive, and there has been little change in expectation across our other segments.

Putting all this together, we think demand for finance, and for property will remain quite strong, and on this read, it is unlikely home prices will fall much at all in the major eastern state markets. Other states are more at risk of a fall, which once again underscores the diversity in the market across Australia.  As a result lenders will still be able to write more business, though the mix is changing.


Household Financial Confidence Waned In May

The results from the latest Digital Finance Analytics Household Finance Confidence Index to end May 2017 is released today, and shows a lower overall score of 100.6, down from 101.5 last month. This is firmly in the neutral zone, but households with mortgages are feeling the pinch and the index is set to go lower in months ahead.

Both property investors and owner occupiers are more concerned about rising mortgage interest rates, and potentially falling property prices. There was less change in households who are property inactive, which shows how the dynamics of property is directly influencing confidence, but this group has a lower level of confidence to start with.

The biggest slide was in NSW, where the overall score is still the highest across the states, but is turning lower. Talk of lower prices, is hitting confidence. WA confidence is rising a little, but from a low baseline and there were small rises in QLD and SA.

Looking at the scorecard which drives the index, we see households have become a little more concerned about future job prospects, are less comfortable with savings returns, but significantly more concerned about the debt burden they are carrying in the context of falling real incomes, whilst costs of living continue to spiral higher. This despite net worth still rising for many.

Sentiment in the property sector is clearly a major influence on how households are felling about their finances, but the real dampening force is falling real incomes. This is unlikely to correct any time soon, so we expect continued weakness in the index as we go into winter.

By way of background, these results are derived from our household surveys, averaged across Australia. We have 52,000 households in our sample at any one time. We include detailed questions covering various aspects of a household’s financial footprint. The index measures how households are feeling about their financial health. To calculate the index we ask questions which cover a number of different dimensions. We start by asking households how confident they are feeling about their job security, whether their real income has risen or fallen in the past year, their view on their costs of living over the same period, whether they have increased their loans and other outstanding debts including credit cards and whether they are saving more than last year. Finally we ask about their overall change in net worth over the past 12 months – by net worth we mean net assets less outstanding debts.

Digital Finance Analytics – Quenching The Thirst For Accurate Household Mortgage Data

Digital Finance Analytics Core Market Model is now being used by a growing number of financial services companies and agencies who want to understand the true dynamics of the current mortgage market and the broader footprint of household finances across Australia.

The DFA Approach

By combining our household survey data, with private data from industry participants as well as public data from government agencies we have created a unique statistically optimised 52,000 household x 140 field resource which portrays the current status of households and their financial footprint. Because new data is added to each week, it is the most current information available. We also estimate the extent of future mortgage defaults, thanks to the data on household mortgage stress.

Posts on the DFA blog uses data from this resource.  Momentum in our business has picked up significantly as concerns about the state of household finances grow and the thirst for knoweldge grows. We plug some of the critical gaps in the currently available public data which is in our view both limited and myopic.

A Soft Sell

The complete data-set is available purchase, either as a one-off transaction, or by way of an annual subscription which includes the full current data plus eleven subsequent monthly updates.

Other clients prefer to request custom queries which we execute on a time and materials basis.

In this video you can see an example of the core model at work. We show how data can be manipulated to get a granular (post code and segment) understanding of the state of play.  This is important when the situation is so variable across the states, and across different household groups.

We Hold Granular Data

  • Household Demographics (including age, education, structure, occupation and income, location, etc.)
  • Household Property Footprint (including residential status, type of property, current value of property, whether holding investment property, purchase intentions, etc.)
  • Household Finances (including outstanding mortgages and other loans, credit cards, transaction turnover, deposits, superannuation and SMSF, and other household spending)
  • Household Risk Assessment (including loan-to-value, debt servicing ratio, loan-to-income ratio, level of mortgage stress, probability of default, etc.)
  • Household Channel Preferences (including preferred channel, time on line, use of financial adviser, use of mortgage broker, etc.)
  • Segmentation (derived from our algorithms; for household, property, digital and others)

Request More Information

You can get more information about our services by completing the form below, where you can also request access to our Lexicon which describes in detail the data available.

You should get confirmation your message was sent immediately and you will receive an email with the information attached after a short delay.

Note this will NOT automatically send you our ongoing research updates, for that register here.

[contact-form to=’mnorth@digitalfinanceanalytics.com’ subject=’Request Details of DFA Core Market Model’][contact-field label=’Name’ type=’name’ required=’1’/][contact-field label=’Email’ type=’email’ required=’1’/][contact-field label=’Email Me The Information’ type=’radio’ options=’Yes Please’ required=’1′ /][contact-field label=’Email Me The Lexicon (option)’ type=’radio’ options=’Yes Please’ required=’0′ /][contact-field label=’Comment If You Like’ type=’textarea’/][/contact-form]