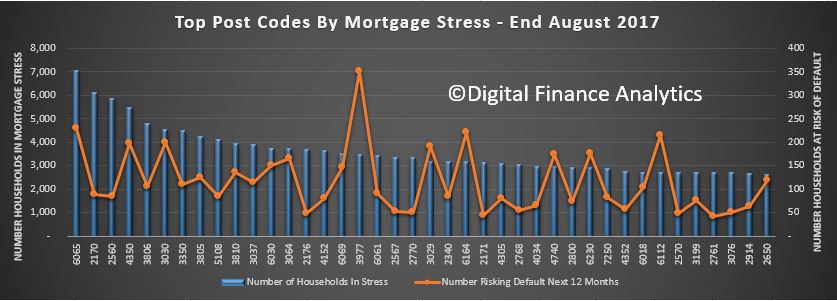
Mortgage Stress hit the headlines thanks to the ABC Four Corners programme, which used data from our household surveys. But if the tip of the iceberg is high debt, rising costs and devalued incomes, what lies beneath?
 We helped make the news this week, so in this special weekly edition of the Property Imperative to 26th August 2017, we take a deeper dive into the underlying drivers of high home prices, and the resultant massive debt burden.
The ABC Four Corners programme set out the first order issues quite well, and you can even use their interactive map to look at stress and interest rate sensitivity by post code, which is based on our data. But they did not touch on the more fundamental second order issues which need to be understood to explain how we got here. So we will discuss some of these more fundamental factors, and show why the whole housing conundrum is so complex.

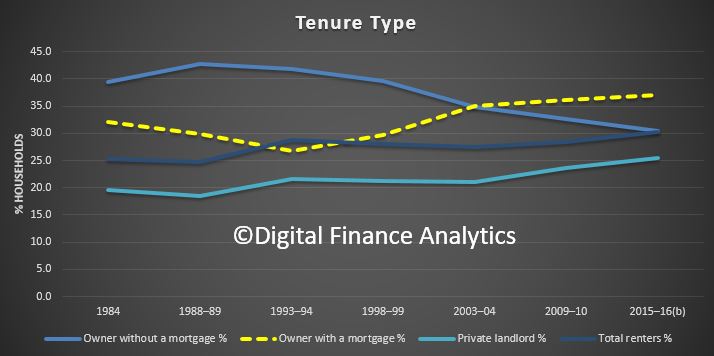
There are a number of factors which have worked together to create very high property prices here, and in other countries around the world. The root cause is the shift in attitude towards property from somewhere to live, to seeing it as an asset class ripe for investment – the financialisation of property. Given the availability of cheap finance (thanks to low interest rates and in many economies extra stimulus from quantitative easing), and the high demand from investors, globally, price rises evident in many countries, mirroring high stock prices. Many baby boomers are at the front of the queue, looking for investment opportunities. But such high home prices makes it ever harder for new purchasers to enter the market, so rates of home ownership are dropping.
We also see flows of investment capital crossing international boarders, thanks to financial deregulation. For example, in Australia, last year Chinese investors bought more than $30 billion of property, including in some post codes more than 15% of residential purchases. Around the world there is hot money looking for a home, and the stellar returns on Australian property have made it an attractive target, especially in the light of the relatively stable political environment here, and until recently the ease by which foreign purchasers could enter the market. That said, Beijing has tightened controls on outbound investment, and this move will put pressure on prices in key property markets from New York to London. The top three overseas destinations for Chinese property investors in 2016 were the United States, Hong Kong and Australia.
In Australia, demand has also been stoked by strong migration. The recent census showed that 1.3 million new migrants have come to Australia since 2011. The impact of this is much debated, with many arguing that the floods of new residents moving to Australia is one of the most significant factors in play. The “big Australia policy” which, though not planned, is based on the assumption that we need more people to drive growth and pay tax; and so the current migration settings reflect this. Yet there is little proper planning for this continued lift in numbers. Some are now questioning this approach, which is causing significant congestion in our capital cities. And migration rates seem to be climbing with the fastest net overseas migration in 4 years, according to the ABS.
About one in three Australians are employed in property related industries, from building and construction, real estate, finance and specialist services. Because of this there is strong political and economic support for high levels of ongoing investment. The HIA this week released the latest National Outlook Report which suggests the housing sector will become less of an economic driver of the Australian economy, and also underscores the various regulatory interventions from state taxes, to limiting foreign investment and investor lending.
It is also worth saying that the standard line of there being an under-supply of property is questionable when we look at the census data on number of people per residence. In fact, this metric has remained static at 2.6 since 2000. Yet most households in our surveys believe we need more construction, not less.
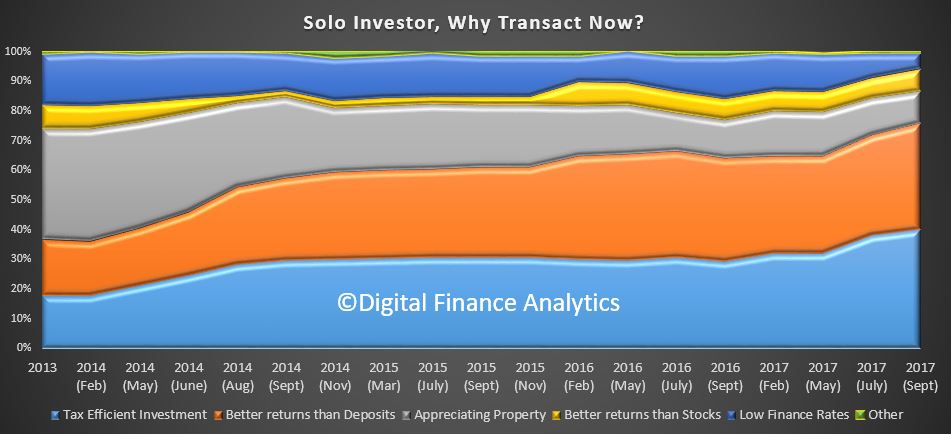
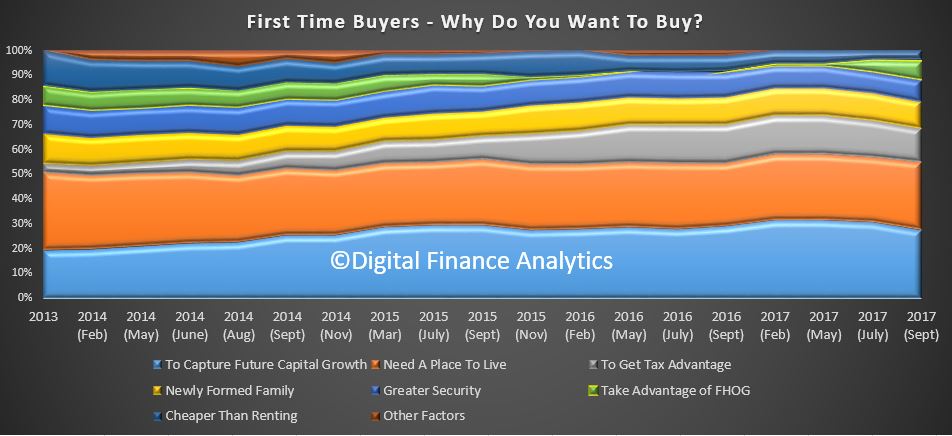
Property Investment by local residents continues apace, supported by overgenerous tax concessions, across both negative gearing and capital gains. Around 36% of mortgage lending is for investment property. Strong continued capital appreciation is driving this, and our recent surveys showed that even first time buyers were motivated by these gains. Property investment is pervasive, and as the Four Corners programme showed, some investors are geared up across multiple properties, with an appetite for more. Earlier this year the ATO released their summary data which included quite comprehensive view of the range of costs those with rental properties have offset income. They also divide rentals into those functioning at a loss, and those who make a profit.
Of the 2.9 million rentals, 1.1 million made a profit, the rest a loss (which can be offset against other categories of income). That means 60% of rentals are under water.
We also showed this week that the Bank of Mum and Dad is the 11th largest lender in Australia, and that more than half first time buyers are looking to borrow from the family many of whom drew capital from their existing property. The Bank of Mum and Dad provides an average of $88,000, and some of this goes to assist first time buyers to go direct to the investment sector.
Then there is the wealth effect which rising home prices provides. Anyone holding property will benefit, at least on paper from capital appreciation, and so do not want to see prices slide. Two thirds of households own residential property, so the political weight of numbers is on the side of keeping home prices growing. No wonder, politicians do not want to be holding the reins of power when prices go south. Neither do they want to rock the boat on negative gearing – though Labor says they would tackle it.
Talking of political power, most states are befitting significantly from the stamp duty received on home purchases. For example, NSW enjoyed more than $7bn of receipts from residential transactions last year – a sizable share of their entire revenue budget. So states and territories do not want to turn that off. In addition, many are slugging foreign investors additional taxes and charges, to further boost revenue.
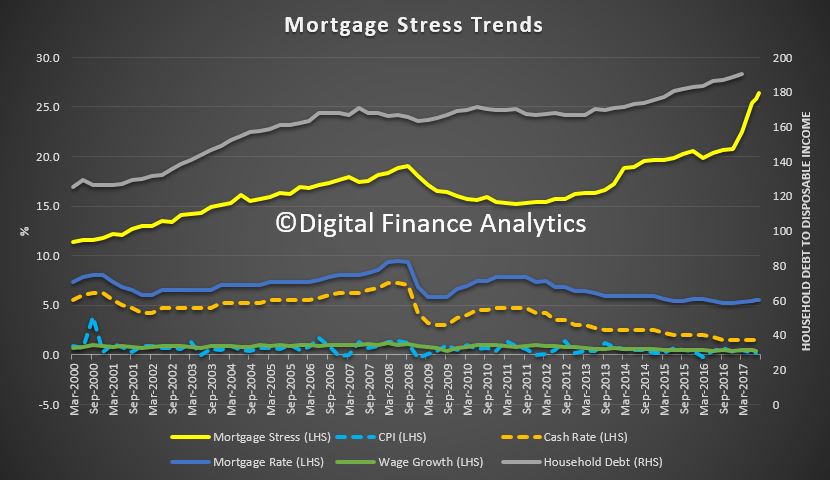
Then of course, the banks continue to grow residential lending at three times inflation or CPI, creating, as we discussed last week an amazing debt monster. This is helped by generous capital ratios which makes home lending more capital efficient than lending to business, even of the growth it generates is, well, illusory. But for lenders, mortgage lending is highly profitable, and remains their primary growth engine. They will continue to lender as hard as they can, targeting lower risk households in particular.
The profitability of the finance industry was underscored by results from two of the aggregators – these players sits between the banks and mortgage brokers. Mortgage Choice delivered a 10.2% growth in cash profit, though revenue was up just 1.1% to $199 million. They have 654 credit representatives and settlements rose to 12.3 billion.
Australian Finance Group (AFG) reported a 2017 net profit of $30.2 million an increase of 33% on FY2016. They now have around 2,900 mortgage brokers, and process on average around 10,000 loan each month with 45 lenders on their panel.
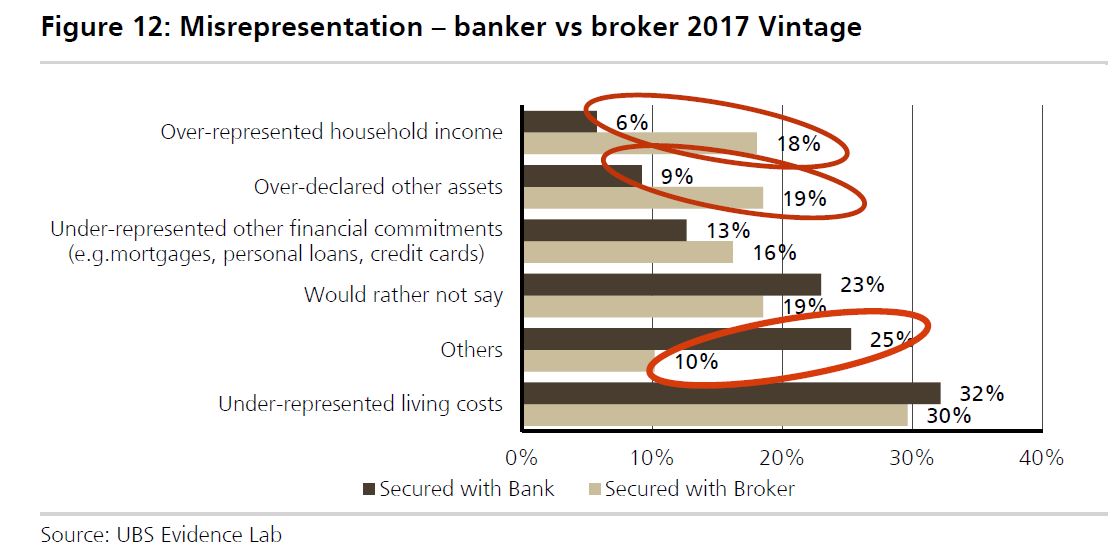
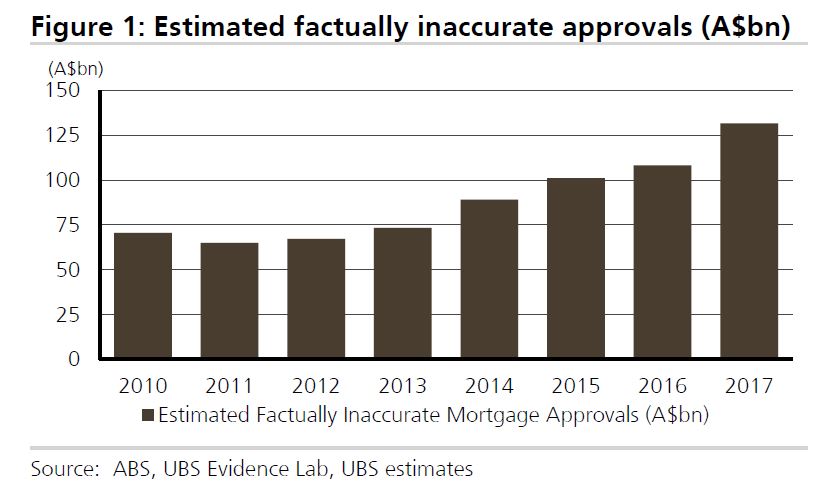
The finance sector is reliant on a buoyant home lending sector, and as Four Corners highlighted, with 60% of their assets in this business, they would be exposed in any downturn. We also saw in the programme some examples of shoddy practices in the sector, and generally we believe that underwriting standards are still too generous.
The regulatory structure in Australia, with the RBA, ASIC and APRA, collectively with Treasury in the Council of Financial Regulators, has been myopic in its focus, not wanting to rock to boat given the high economic impact of the construction sector, with high volumes of apartments coming on stream in the next year or two. They finally got around to pressing down on interest only loans – too little too late in our view, but this has given the banks ample ammunition to lift the interest rates on these loans, and as a result, they are competing for principal and interest loans, especially for owner occupied borrowers below 80%, with keen rates. Note too, lenders were forced to tighten their controls, which suggests that the risk management processes in the banks is not adequate, we think they are trading volume and profit over prudent behaviour. Overall loan growth is too strong relative to incomes, but no one wants to talk about the risks of this in a low income growth environment. The regulators are trapped because rates are too low, but they cannot raise them because of the pressures this would exert on households. They argue the systemic financial stability risks are being adequately managed, we are not so sure. Currently loan volumes continue to grow too strongly.
So in summary, if you pile up all the stakeholder groups who benefit from rising prices, ranging from existing owners, investors, lenders, the construction sector, and the political weight of numbers, no surprise that little is being done to tackle the root cause issues – of high migration, poor lending standards and too strong mortgage loan growth. This underpins the high household debt and rising mortgage stress.
The politicians may play lip service to housing affordability, and lenders still claim they are being disciplined in the current environment. But it could all too easily turn to custard.
We need a focussed policy on controlling migration, effective planning to accommodate growth, tighter lender restrictions and higher interest rates. But the likelihood is we will continue to muddle though, kick the can down the street, and hope it will turn out ok. But, hope, to quote former New York City Mayor Rudy Giuliani, is not a strategy.
And that’s the Property Imperative Weekly to 26th August. If you found this useful, do subscribe to get our latest updates, and check back again for next week’s installment.

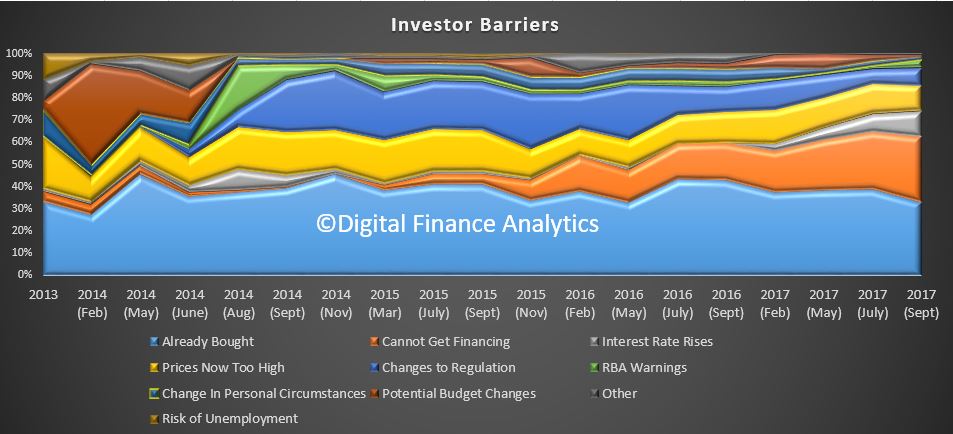
 We see more are looking to buy units, at the expense of suburban houses.
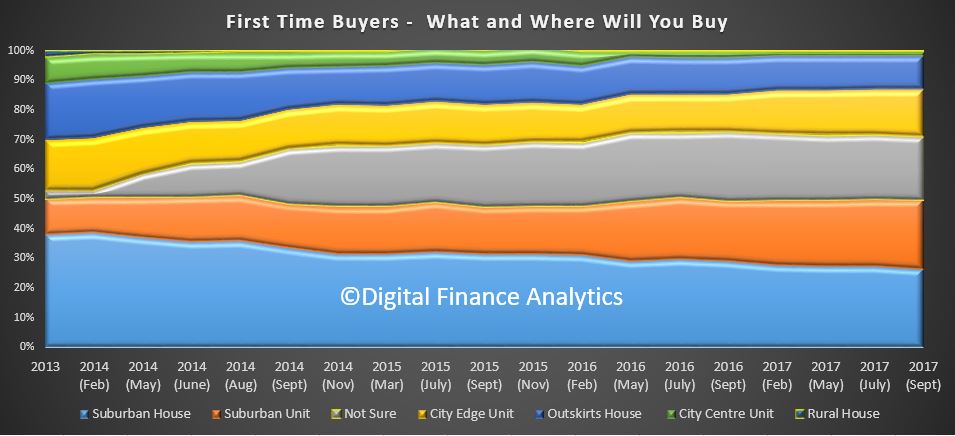 The largest barriers are high home prices (44%), availability of finance (19% – and a growing barrier thanks to tighter underwriting standards), interest rate rises (9%) and costs of living (6%). Finding a place to buy is still an issue, but slightly less so now (18%).
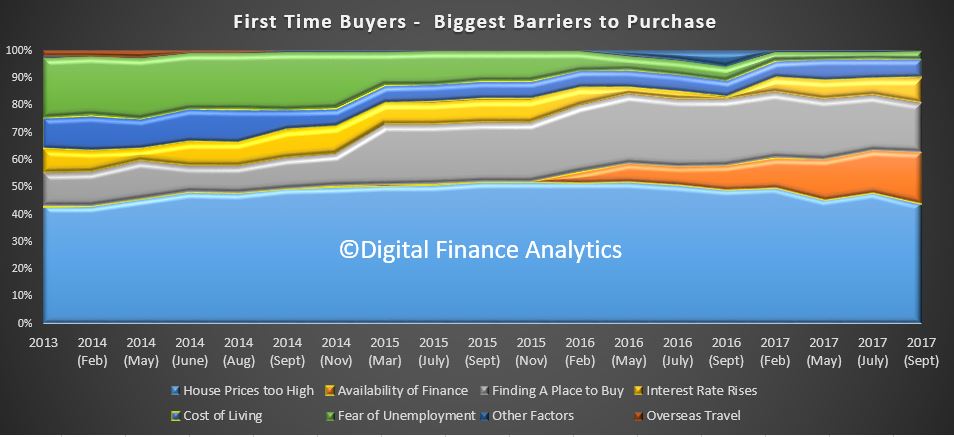 So expect to see more first time buyers active, though there are not enough of them to offset the fall in interest from investors, so expect price weakness as we go into 2018.