Greater Adelaide Mortgage Stress Mapping – Nov 2017

We continue our series featuring the results of our November Mortgage stress update. Today we look at Greater Adelaide and South Australia. In SA we estimate there are 80,530 households in mortgage stress, which equates to 28.3% of borrowing households in the state.  We estimate that 3,900 risk 30-day default in the next 12 months.

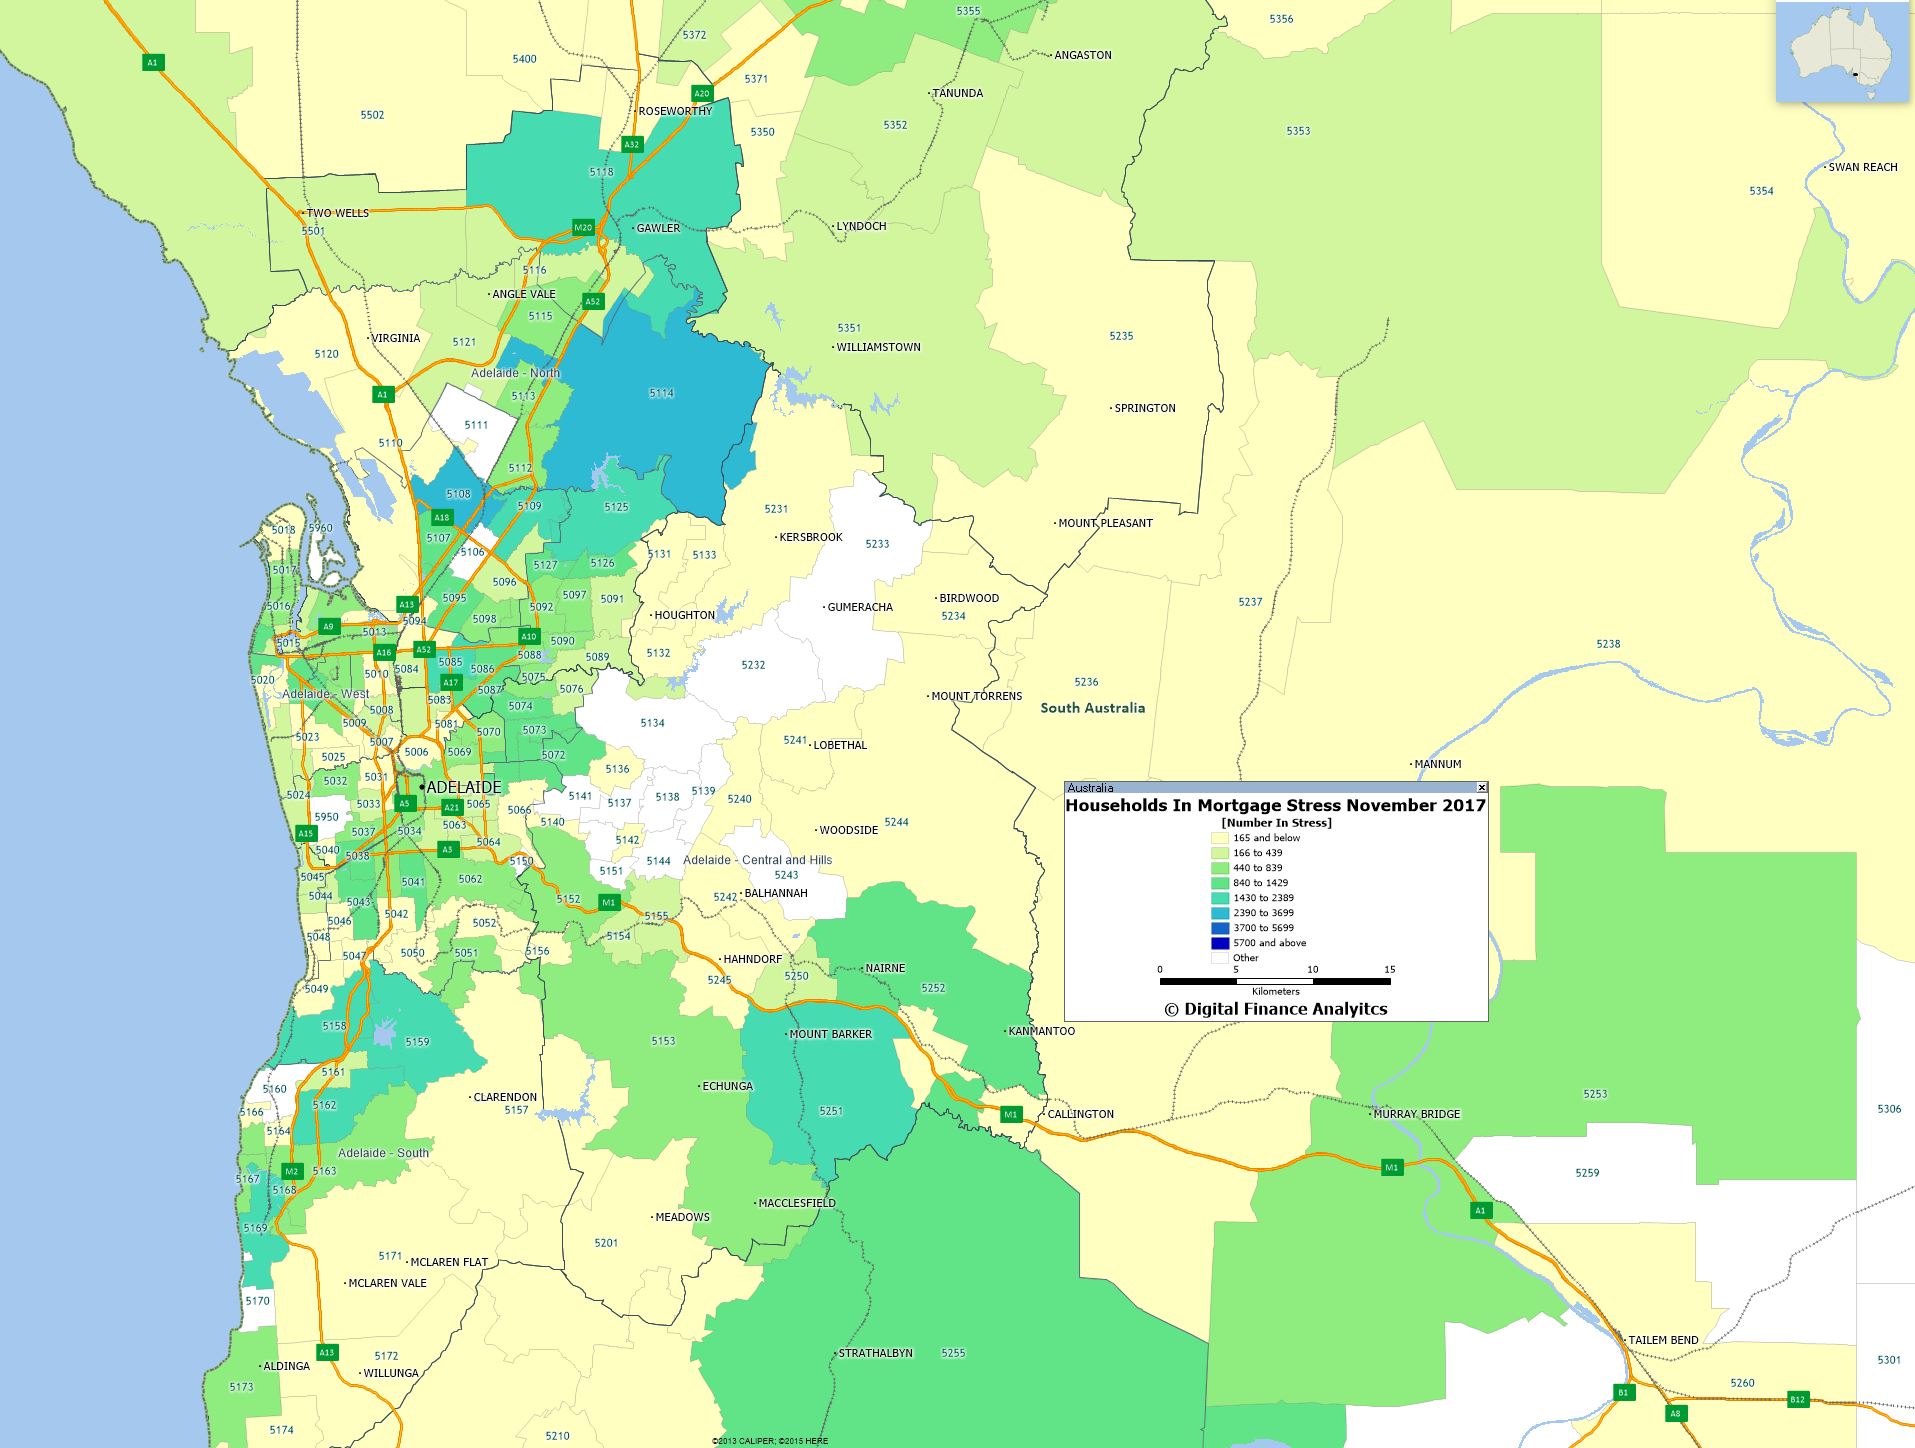
Here is the mortgage stress map for Adelaide and the surrounding area.

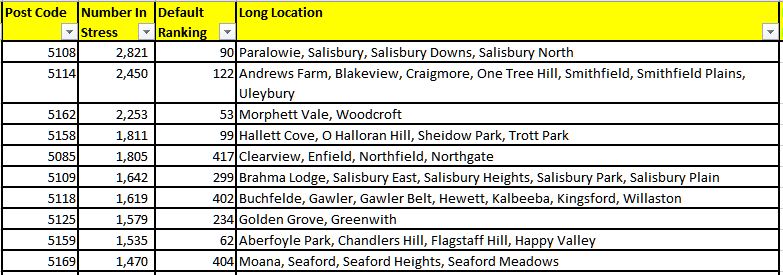
The post code with the highest number of households in stress is 5108, Paralowie and Salisbury with 2,821; a suburb of Adelaide, North & North East Suburbs about 19 kms from the CBD.  There are around 10,500 households in the area, and the average age is 34 years. The ABS Census says children aged 0 – 14 years made up 20.8% of the population and people aged 65 years and over made up 12.3% of the population.

80% of households here live in separate houses. Around 40% have property with a mortgage. The average mortgage repayment is $1,300 a month. The average monthly household income is around $4,440 giving an average loan to income ratio of 29.1%.  The SA income average is higher at $5,250.  In 2010, the average home price was around $210,000 compared with 285,000 today, reflecting average annual growth of around $12,000, well below the national average.

5108 is ranked 90 on our national default ranking.

Next time we look at Perth and WA


Being middle class depends on where you live

From The Conversation.

Politicians are fond of pitching to the “average Australian” but judging by the income of Australians, whether you are middle class depends on where you live. And where we live tells a rich story of who we are as a nation – socially, culturally and economically.

Income is at the heart of access to services and opportunities, which are differing and unequal based on where you live.


Our ability to afford housing that meets our needs largely determines where we live. In turn, where we live influences access to other important features of our lives which shape lifelong and intergenerational opportunities. For example, student performance is associated with everything from where a student lives to their parent’s occupation.

Household incomes in capital cities are typically among the highest, with incomes declining the further you live from major cities. So it’s understandable why Australians living outside or on the fringes of cities might feel somewhat left behind.

The Australian Bureau of Statistics presents “average” income as a range based on where you live. This range is marked by a lower number (30% of incomes) at the beginning and the higher number (80% of incomes) at the top.

This “average” income varies substantially between different rural areas from A$78,548 – A$163,265 in Forrest (ACT) to A$10,507 – A$26,431 in Thamarrurr (NT). This is actually an equivalised household income which factors in the economic resources like the number of people and their characteristics, between households.


The difference between the top and bottom of this range of “average” household income also shows greater inequality within areas.

Even within the greater Sydney metropolitan area, there’s significant differences in household income between areas. The average household equivalised income in Lavender Bay is around A$40,000 – A$95,000 higher than it is in Marayong.

The difference in income is marked, and there are other differences too. People in Marayong are on average younger than Lavendar Bay. Family size is smaller in Lavendar Bay. Over half of the Lavendar Bay residents hold university degrees, compared to a more skill-based workforce in Marayong.

Why there is no one “average” Australian

Cities offer access to myriad employment options. Industries associated with relatively high incomes are typically concentrated in cities to take advantage of global connections.

Sydney, Melbourne and Canberra are notable standouts based on household income. So if you live close to these major cities you’d be getting the most opportunities in terms of employment and income, given the you’re the right candidate.

But not everyone wants to live in the centre of cities. Housing, lifestyle and neighbourhood preferences also play a role in where we live, but are still influenced by income and proximity to such things as employment and family and friends.

Also, infrastructure which supports social and economic wellbeing is essential in communities, regardless of where we live.

What politicians should be talking about instead

Improving the different and unequal access across areas requires better internet connectivity and advances in the way we work. Policies around housing and family-friendly workplaces go some way to supporting Australians in work.

Any measures to redress inequalities require understanding the needs and wants of communities. Proposed planning to reconfigure the greater city of Sydney around population and socioeconomic infrastructure offers an example of a data-driven approach to planning. Whether the proposed reconfiguration of Sydney leads to improvements or greater segmentation will be revealed in practice.

Politicians rarely reflect the characteristics of the people they represent, particularly when we consider the remuneration, entitlements and perks of political office. The longer politicians are in office, and somewhat removed from the people they represent, the further they potentially become from gauging their electorate.

Yet politicians profess to know what the average Australians they represent needs and wants. They apply this to a range of things from service delivery to representation on political matters. And this is within reason.

But without current experience we struggle to see things from perspectives other than our own. Take for example the way some have come to label themselves outsiders from the social and political elite to advance their credibility with average Australians.

Bringing politicians in touch with the diversity of needs and wants of Australians starts with a self-check and recognition of individual bias (conscious or unconscious). This is the first step toward really understanding and connecting with Australians – be it in the “average” or otherwise.

Author: Liz Allen, Demographer, ANU Centre for Social Research and Methods, Australian National University

First Time Buyers Keep The Property Market Afloat – The Property Imperative Weekly – 9th Dec 2017

First Time Buyers are keeping the property ship afloat for now, but what are the consequences?

Welcome to the Property Imperative weekly to 9th December 2017. Watch the video, or read the transcript.

In our weekly digest of property and finance news, we start this week with the latest housing lending finance from the ABS. The monthly flows show that owner occupied lending fell $23m compared with the previous month, down 0.15%, while investment lending flows fell 0.5%, down $60m in trend terms. Refinanced loans slipped 0.13% down $7.5 million. The proportion of loans excluding refinanced loans for investment purposes slipped from a recent high of 53.4% in January 2015, down to 44.6% (so investment property lending is far from dead!)

While overall lending was pretty flat, first time buyers lifted in response to the increased incentives in some states, by 4.5% in original terms to 10,061 new loans nationally. At a state level, FTB’s accounted for a 19% per cent share in Victoria and 13.7% in New South Wales, where in both states, a more favourable stamp duty regime and enhanced grants were introduced this year. But, other states showed a higher FTB share, with NT at 24.8%, WA at 24.6%, ACT at 20.1% and QLD 19.7%. SA stood at 13% and TAS at 13.3%. There was an upward shift in the relative numbers of first time buyers compared with other buyers (17.6% compared with 17.4% last month), still small beer compared with the record 31.4% in 2009. These are original numbers, so they move around each month. The number of first time buyer property investors slipped a little, using data from our household surveys, down 0.8% this past month. Together with the OO lift, total first time buyer participation has helped support the market.

The APRA Quarterly data to September 2017 shows that bank profitability rose 29.5% on 2016 and the return on equity was 12.3% compared with 9.9% last year. Loans grew 4.1%, thanks to mortgage growth, provisions were down although past due items were $14.3 billion as at 30 September 2017. This is an increase of $1.5 billion (11.8 per cent) on 30 September 2016. The major banks remain highly leveraged.

The property statistics showed that third party origination rose with origination to foreign banks sitting at 70% of new loans, mutuals around 20% and other banks around the 50% mark. Investment loan volumes have fallen, though major banks still have the largest relative share, above 30%.  Mutuals are sitting around 10%.  Interest only loans have fallen from around 40% in total value to 35%, but this represents a fall from around 30% of the loan count, to 27%. This reflects the higher average loan values for IO borrowers. The average loan balance for interest only loans currently stands at $347,000 against the average balance of $264,000.  No surprise of course, as these loans do not contain any capital repayments (hence the inherent risks involved, especially in a falling market).

But there has been a spike in loans being approved outside serviceability, with major banks reporting 5% or so in September. This may well reflect a tightening of standard serviceability criteria and the wish to continue to grow their loan books. We discussed this on Perth 6PR Radio.  So overall, we see the impact of regulatory intervention. The net impact is to slow lending momentum. As lenders tighten their lending standards, new borrowers will find their ability to access larger loans will diminish. But the loose standards we have had for several years will take up to a decade to work through, and with low income growth, high living costs and the risk of an interest rate rise, the risks in the system remain.

On the economic front, GDP from the ABS National Accounts was 0.6%. This was below the 0.7% expected. This gives an annual read of 2.3%, in trend terms, well short of the hoped for 3%+. Seasonally adjusted, growth was 2.8%. Business investment apart, this is a weak and concerning result.  The terms of trade fell. GDP per capita and net disposable income per capita both fell, which highlights the basic problem the economy faces.  The dollar fell on the news. Households savings also fell. No surprise then that according to the ABS, retail turnover remained stagnant in October. The trend estimate for Australian retail turnover fell 0.1 per cent in October 2017 following a relatively unchanged estimate (0.0 per cent) in September 2017. Compared to October 2016 the trend estimate rose 1.8 per cent. Trend estimates smooth the statistical noise.

So no surprise the RBA held the cash rate once again for the 16th month in a row.

The latest BIS data on Debt Servicing ratios shows Australia is second highest after the Netherlands. We are above Norway and Denmark, and the trajectory continues higher. Further evidence that current regulatory settings in Australia are not correct. As the BIS said, such high debt is a significant structural risk to future prosperity. They published a special feature on household debt, in the December 2017 Quarterly Review. They call out the risks from high mortgage lending, high debt servicing ratios, and the risks to financial stability and economic growth.  All themes we have already explored on the DFA Blog, but it is a well-argued summary. Also note Australia figures as a higher risk case study.  They say Central banks are increasingly concerned that high household debt may pose a threat to macroeconomic and financial stability and highlighted some of the mechanisms through which household debt may threaten both. Australia is put in the “high and rising” category.  The debt ratio now exceeds 120% in both Australia and Switzerland.  Mortgages make up the lion’s share of debt.  In Australia mortgage debt has risen from 86% of household debt in 2007 to 92% in 2017.

Basel III was finally agreed this week by the Central Bankers Banker – the Bank for International Settlements – many months later than expected and somewhat watered down. Banks will have to 2022 to adopt the new more complex framework, though APRA said that in Australia, they will be releasing a paper in the new year, and banks here should be planning to become “unquestionably strong” by 1 January 2020.  We note that banks using standard capital weights will need to add different risk weights for loans depending on their loan to value ratio, advanced banks will have some floors raised, and investor category mortgages (now redefined as loans secured again income generating property) will need higher weights. Net, net, there will be two effects. Overall capital will probably lift a little, and the gap between banks on the standard and internal methods narrowed. Those caught transitioning from standard to advanced will need to think carefully about the impact. This if anything will put some upwards pressure on mortgage rates.

The Treasury issues a report “Analysis of Wages Growth” which paints a gloomy story. Wage growth, they say, is low, across all regions and sectors of the economy, subdued wage growth has been experienced by the majority of employees, regardless of income or occupation, and this mirrors similar developments in other developed western economies. Whilst the underlying causes are far from clear, it looks like a set of structural issues are driving this outcome, which means we probably cannot expect a return to “more normal” conditions anytime some. This despite Treasury forecasts of higher wage growth later (in line with many other countries). We think this has profound implications for economic growth, tax take, household finances and even mortgage underwriting standards, which all need to be adjusted to this low income growth world.

Mortgage Underwriting standards are very much in focus, and rightly, given flat income growth.  There was a good piece on this from Sam Richardson at Mortgage Professional Australia which featured DFA. He said that over four days in late September two major banks added extra checks to an already-extensive application process. ANZ introduced a Customer Interview Guide requiring brokers to ask questions about everything from a customer’s Netflix subscription to whether they were planning to start a family. Three days later CBA introduced a simulator that would show interest-only borrowers how their repayments would change and affect their lifestyle. Customers would be required to fill in an ‘acknowledgement form’ to proceed with an interest-only application.

Getting good information from customers is hard work, not least because as we point out, only half of households have formal budgeting. So, when complete the mortgage application, households may be stating their financial position to the best of their ability, or they may be elaborating to help get the loan. It is hard to know. Certainly banks are looking for more evidence now, which is a good thing, but this may make the loan underwriting processes longer and harder. Improvements in technology could improve underwriting standards for banks while pre-populating interactive application forms for consumers and offering time-saving solutions to brokers and Open Banking may help, but while Applications can be made easier, this does not necessarily mean shorter.

More data this week on households, with a survey showing Australians have become more cautious of interest only loans with online panel research revealing that 46 per cent of Australians are Adamant Decliners of interest-only home loans according to research from the  Gateway Credit Union. In addition, a further quarter of respondents are Resistant Approvers, acknowledging the benefits of interest-only loans yet choosing not to utilise them. Of the generations, Baby Boomers are most likely to be Adamant Decliners and therefore, less likely to use interest-only products. While Gen Y are most likely to be Enthusiastic Users.

Banks continue to offer attractive rates for new home loans, seeking to pull borrows from competitors. Westpac for example, announced a series of mortgage rate cuts to attract new borrowers, as it seeks to continue to grow its portfolio, leveraging lower funding costs, and the war chest it accumulated earlier in the year from back book repricing, following APRA’s tightening of underwriting standards and restrictions on interest only loans. Rates for both new fixed rate loans and variable rate loans were reduced.  For example, the bank has also increased the two-year offer discount on its flexi first option home for principal and interest repayments from 0.84% p.a. to 1.00% p.a. putting the current two-year introductory rate at 3.59% p.a.

The RBA released their latest Bulletin  and it contained an interesting section on Housing Accessibility For First Time Buyers.  They suggest that in many centers, new buyers are able to access the market, thanks to the current low interest rates. But the barriers are significantly higher in Melbourne, Sydney and Perth. They also highlight that FHBs (generally being the most financially constrained buyers) are not always able to increase their loan size in response to lower interest rates because of lenders’ policies. Indeed, the average FHB loan size has been little changed over recent years while the gap between repeat buyers and FHBs’ average loan sizes has widened. They also showed that in aggregate, rents have grown broadly in line with household incomes, although rent-to-income ratios suggest housing costs for lower-income households have increased over the past decade.

Housing affordability has improved somewhat  across all states and territories, allowing for a large increase in the number of loans to first-home buyers, according to the September quarter edition of the Adelaide Bank/REIA Housing Affordability Report. The report showed the proportion of median family income required to meet average loan repayments decreased by 1.2 percentage points over the quarter to 30.3 per cent. The result was decrease of 0.6 percentage points compared with the same quarter in 2016. However, Housing affordability is still a major issue in Sydney and Melbourne they said.  In addition, over the quarter, the proportion of median family income required to meet rent payments increased by 0.3 percentage points to 24.6 per cent.

Our own Financial Confidence Index for November fell to 96.1, which is below the 100 neutral metric, down from 96.9 in October 2017. This is the sixth month in succession the index has been below the neutral point. Owner Occupied households are the most positive, scoring 102, whilst those with investment property are at 94.3, as they react to higher mortgage repayments (rate rises and switching from interest only mortgages), while rental yields fall, and capital growth is stalling – especially in Sydney.  Households who are not holding property – our Property Inactive segment – will be renting or living with friends or family, and they scored 81.2. So those with property are still more positive overall. Looking at the FCI score card, job security is on the improve, reflecting rising employment participation, and the lower unemployment rate.  Around 20% of households feel less secure, especially those with multiple part time jobs. Savings are being depleted to fill the gap between income and expenditure – as we see in the falling savings ratio. As a result, nearly 40% of households are less comfortable with the amount they are saving. This is reinforced by the lower returns on deposit accounts as banks seek to protect margins. More households are uncomfortable with the amount of debt they hold with 40% of households concerned. The pressure of higher interest rates on loans, tighter lending conditions, and low income growth all adds to the discomfort. More households reported their real incomes had fallen in the past year, with 50% seeing a fall, while 40% see no change.  Only those on very high incomes reported real income growth.

Finally, we also released the November mortgage stress and default analysis update. You can watch our video counting down the most stressed postcodes in the country. But in summary, across Australia, more than 913,000 households are estimated to be now in mortgage stress (last month 910,000) and more than 21,000 of these in severe stress, the same as last month. Stress is sitting on a high plateau. This equates to 29.4% of households. We see continued default pressure building in Western Australia, as well as among more affluent household, beyond the traditional mortgage belts across the country. Stress eased a little in Queensland, thanks to better employment prospects. We estimate that more than 52,000 households risk 30-day default in the next 12 months, similar to last month. We expect bank portfolio losses to be around 2.8 basis points, though with losses in WA rising to 4.9 basis points.

So, the housing market is being supported by first time buyers seeking to gain a foothold in the market, but despite record low interest rates, and special offer attractor rates, many will be committing a large share of their income to repay the mortgage, at a time when income growth looks like it will remain static, costs of living are rising, and mortgage rates will rise at some point. All the recent data suggests that underwriting standards are still pretty loose, and household debt overall is still climbing. This still looks like a high risk recipe, and we think households should do their own financial assessments if they are considering buying at the moment – for home prices are likely to slide, and the affordability equation may well be worse than expected. Just because a lender is willing to offer a large mortgage, do not take this a confirmation of your ability to repay. The reality is much more complex than that. Getting mortgage underwriting standards calibrated right has perhaps never been more important than in the current environment!

And that’s the Property Imperative to 9th December 2017. If you found this useful, do leave a comment, sign up to receive future research and check back next week for the latest update. Many thanks for taking the time to watch.
Aussies lose interest in interest-only home loans

Despite a crackdown by regulators and a continuing low-interest rate environment, it appears Australians are naturally cautious when it comes to interest-only home loans. Research from Gateway Credit Union (Gateway), reveals 46 per cent of Australians are Adamant Decliners of interest-only home loans.

The findings, from Gateway’s Mortgage Holders Sentiment Report 2017, shows:

  • Adamant Decliners (46 per cent) would not consider using interest-only loans due to the perception that they increase debt.
  • A further quarter of respondents (25 per cent) are Resistant Approvers, acknowledging the benefits of interest-only loans yet choosing not to utilise them.
  • While around one in ten (11 per cent) consider themselves Hesitant Compliers, viewing interest only home loans as bad but still utilising them regardless.
  • With almost one in five (18 per cent) associating themselves as Enthusiastic Users, indicating they have used an interest-only home loan because they increase cash flow.

Gateway CEO, Paul Thomas, says the results suggest we are becoming more astute when it comes to our mortgages.

“It’s encouraging to see so many Australians are wary of the dangers around interest-only home loans. While they do serve a purpose for some borrowers, the reality is for many the interest-only home loan can create a precarious situation. Especially if borrowers enter the loan without considering if they can service it once the interest-only period ends.

“With the regulatory limits placed on banking institutions earlier in the year to restrict interest-only loan growth to below 30 per cent, it will become more difficult for borrowers to obtain an interest-only loan. This may be problematic for refinancers in particular, who are looking to refinance to interest-only again and haven’t factored in principal and interest repayments,” said Mr Thomas.

Of the generations, Baby Boomers are most likely to be Adamant Decliners and therefore, less likely to use interest-only products. While Gen Y are most likely to be Enthusiastic Users.

“When it comes to the different generations, it makes sense that younger cohorts are more accepting of interest-only home loans. Many younger Australians are finding it difficult to break into the property market or are at a stage of life – such as starting a family – when they need more cash flow. An interest-only home loan would afford them more flexibility with their finances, suggesting their acceptance may be a result of necessity,” commented Mr Thomas.

Since 2015, the number of Adamant Decliners among mortgage holders has risen by 5 per cent, while Enthusiastic Users among mortgage holders has declined by 4 per cent. Resistant Approvers and Hesitant Compliers remain similar, proportionally.

“Taking out an interest-only home loan may seem like an attractive option, particularly in a low interest rate environment. However, we urge borrowers to use this opportunity to pay down their home loan as much as possible, especially before the RBA begins to raise the cash rate, which many experts predict will happen in the next few months.

“Borrowers might be drawn to the lower repayments during the interest-only period, but they must remember if they aren’t making principal and interest repayments, they effectively are not reducing their debt. If you’re thinking about taking an interest-only home loan, we can’t stress the importance of making sure you can service the loan when it jumps to principal and interest repayments,” concluded Mr Thomas.

About the research

The Gateway Credit Union Mortgage Holder Sentiment Report 2017 is the collation of data gained through a quantitative survey conducted through an online panel. The survey was in field from 12th September to 18th September 2017, obtaining 1,030 completes. The survey sample was nationally representative of Australians over the age of 18 across age, gender and states in Australia.

Greater Brisbane Mortgage Stress Mapping – Nov 2017

Continuing our series on mortgage stress, we feature the results for Brisbane and QLD today. Overall, in the state, stress has fallen a little thanks to brighter employment prospects, especially in the south east. However, some regional areas are under severe pressure.

We estimate there are 157,019 households across the state, down from 162,726 last month. However, around 9,600 in QLD risk default over the next 12 months.

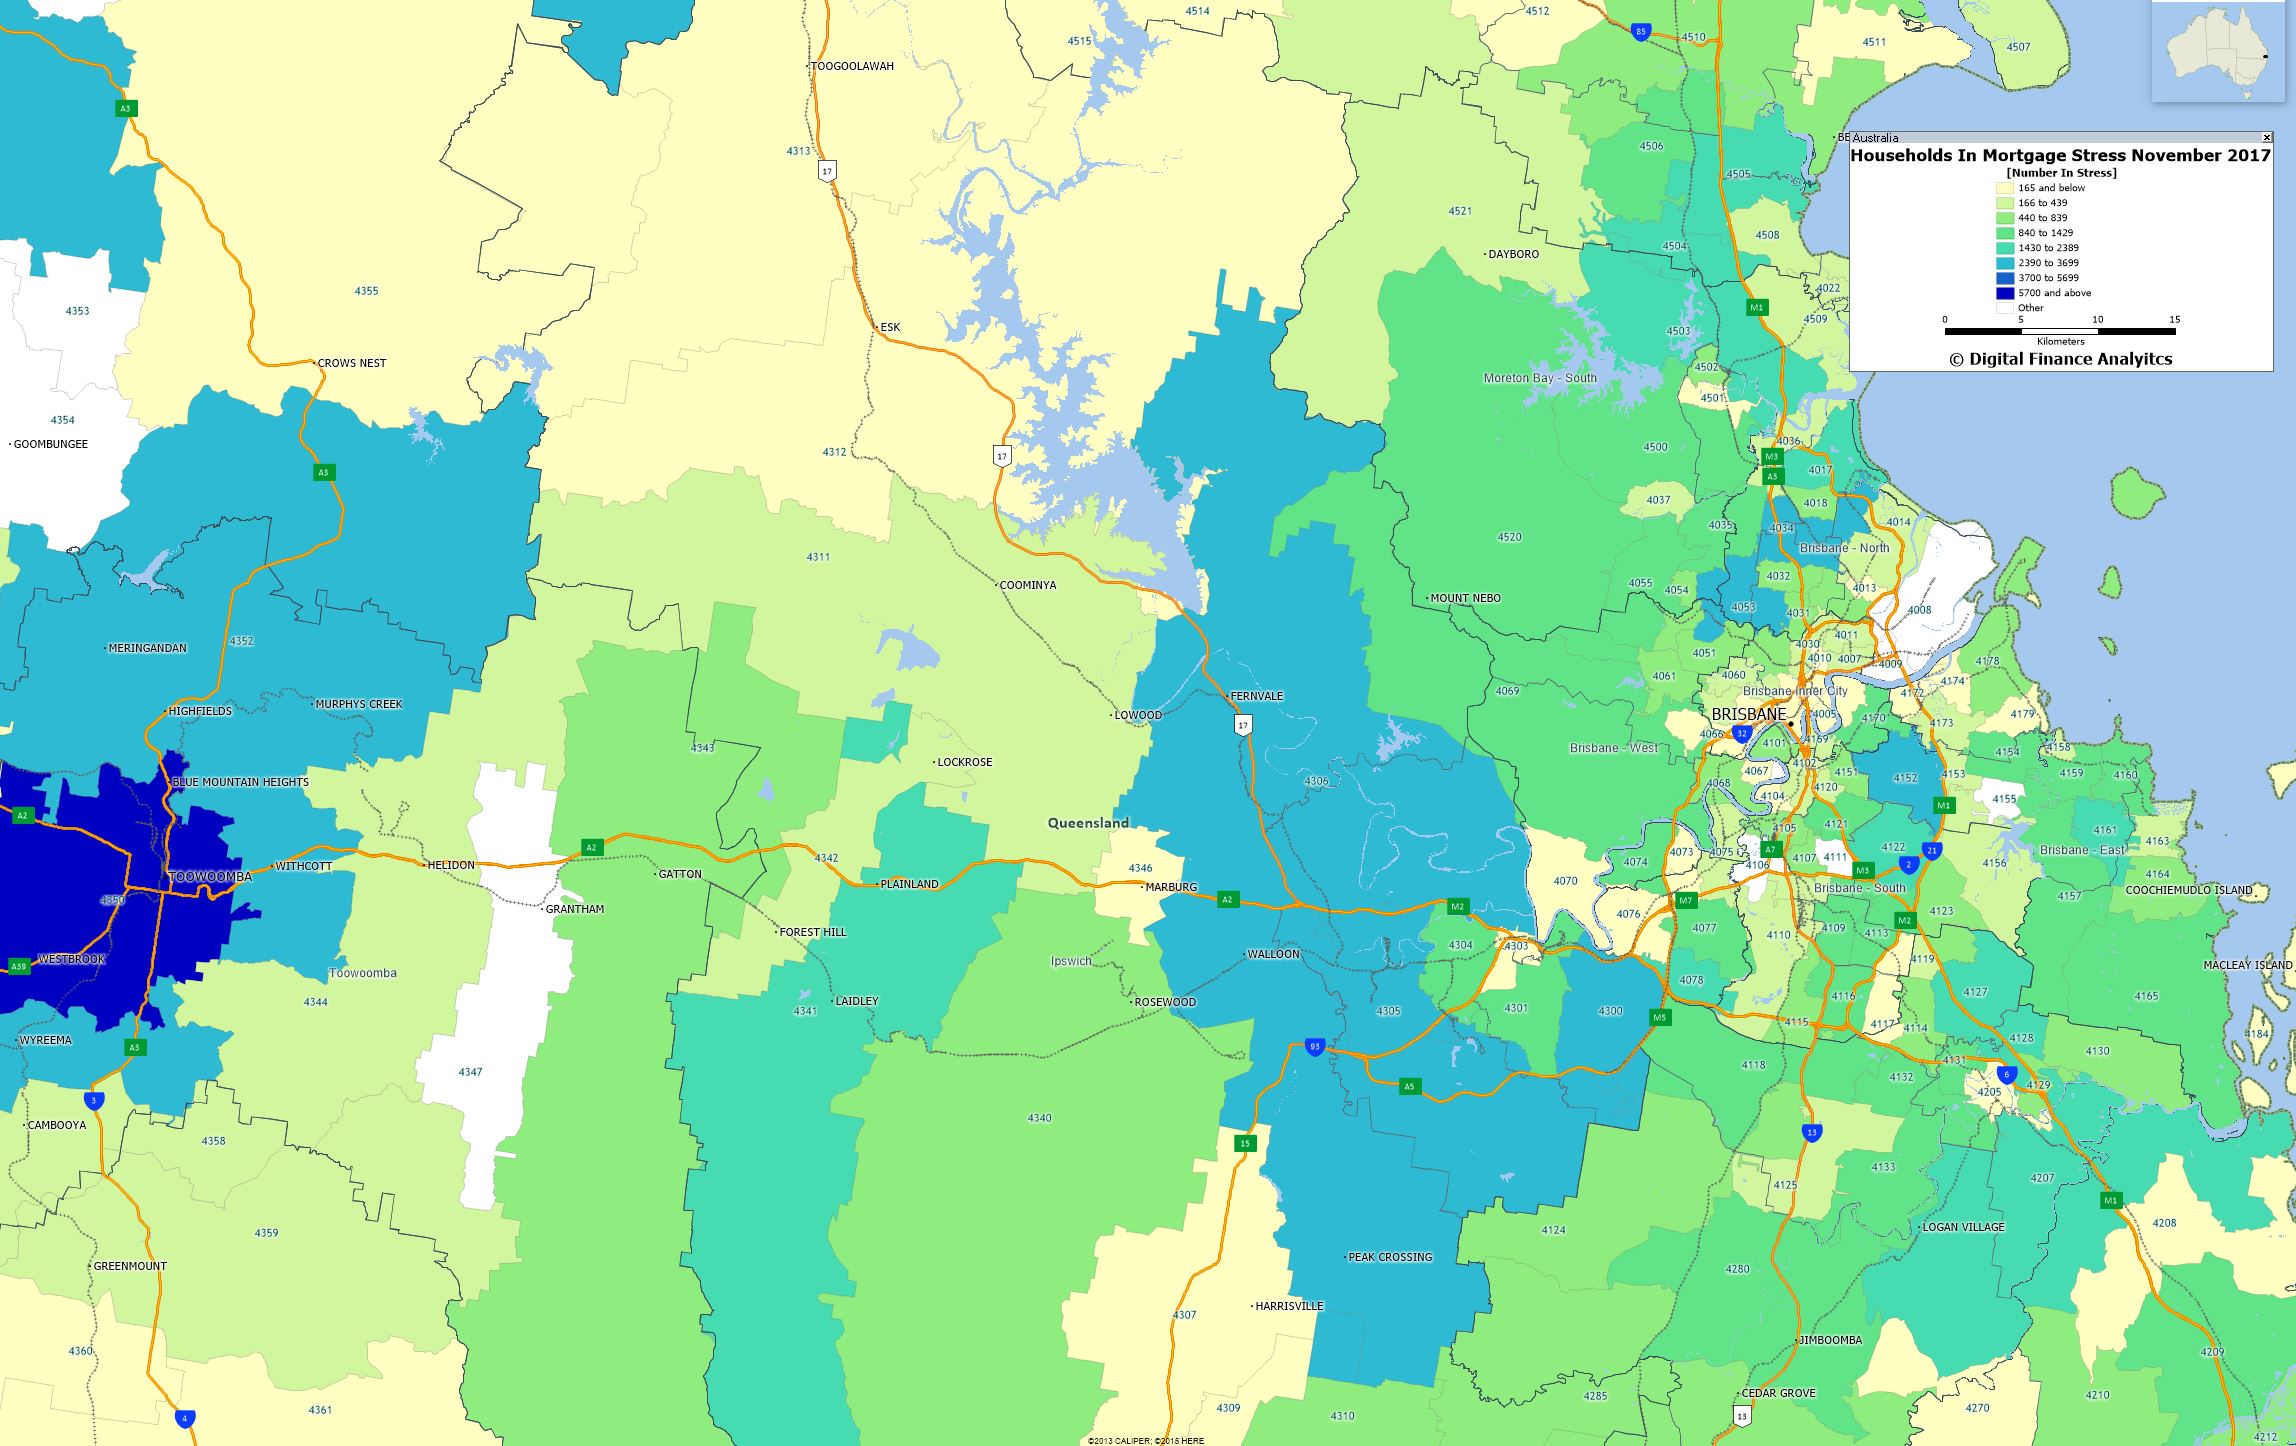
Here is the stress mapping for Greater Brisbane to November 2017.

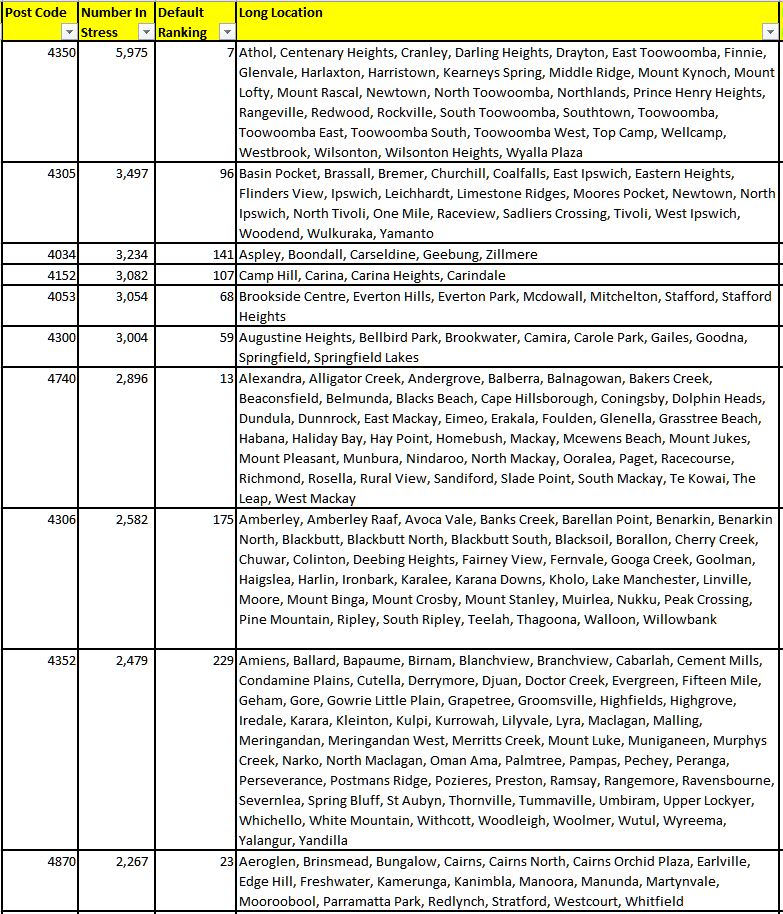
The post code with the highest stress count is 4350, around Drayton and Toowoomba, about 100 kilometres from Brisbane. We estimate 5,975 households are in mortgage stress. The average home price is $490,000, compared with $382,000 in 2010. There are about 27,000 households in the region and the average age is 37. The average income is $5,300 a month. Around 30% have a mortgage and the average mortgage repayment is $1,510.

Here is the top 10 listing across the state, together with the national default ranking.

Next time we look at South Australia.


Household Financial Security Takes Another Hit In November

Digital Finance Analytics has released the November 2017 results from our Household Financial Security Index. The index uses data from our household surveys to assess households level of financial comfort.

The index fell to 96.1, which is below the 100 neutral metric, down from 96.9 in October 2017. This is the sixth month in succession the index has been below the neutral point.

Watch the video or read the transcript.

Owner Occupied households are the most positive, scoring 102, whilst those with investment property are at 94.3, as they react to higher mortgage repayments (rate rises and switching from interest only mortgages), while rental yields fall, and capital growth is stalling, especially in Sydney).  Households who are not holding property – our Property Inactive segment – will be renting or living with friends or family, and they scored 81.2. So those with property are still more positive overall.

Looking across the states, households in NSW and VIC are just above the neutral setting, but continue to slipping lower. Households in QLD are below the 100, but up a little, as are those in SA and WA. Western Australian households are the least positive, but somewhat improved.

Looking across the age ranges, younger households are the least positive, and all ages banks fell, other than those over 60 years which saw a small rise.

Looking at the FCI score card, job security is on the improve, reflecting rising employment participation, and the lower unemployment rate.  Around 20% of households feel less secure, especially those with multiple part time jobs.

Savings are being depleted to fill the gap between income and expenditure – as we see in the falling savings ratio. As a result, nearly 40% of households are less comfortable with the amount they are saving. This is reinforced by the lower returns on deposit accounts as banks seek to protect margins.

More households are uncomfortable with the amount of debt they hold with 40% of households concerned. The pressure of higher interest rates on loans, tighter lending conditions, and low income growth all adds to the discomfort. More households reported their real incomes had fallen in the part year, with 50% seeing a fall, while 40% see no change.  Only those on very high incomes reported real income growth.

More households reported a rise in their costs of living, and this month this included higher school fees and child care costs, energy bills and fuel costs. The average cpi of around 2% appears to understate the real life experience of many households.

Finally, household net worth improved for more than 60% of households, but there is a rise in those seeing no growth, mainly as home price growth eases back. Those with share market investments have done quite well in recent months.

Looking ahead, we expect the overall index to trend lower, as incomes remain constrained, and costs of living grow. The property market has a big impact on households level of confidence and the leading indicators are flagging lower outcomes ahead.  However, home prices would need to fall significantly to allow many of those currently unable to afford to buy in to the market.

By way of background, these results are derived from our household surveys, averaged across Australia. We have 52,000 households in our sample at any one time. We include detailed questions covering various aspects of a household’s financial footprint. The index measures how households are feeling about their financial health. To calculate the index we ask questions which cover a number of different dimensions. We start by asking households how confident they are feeling about their job security, whether their real income has risen or fallen in the past year, their view on their costs of living over the same period, whether they have increased their loans and other outstanding debts including credit cards and whether they are saving more than last year. Finally we ask about their overall change in net worth over the past 12 months – by net worth we mean net assets less outstanding debts.

We will update the results again next month.


Greater Melbourne Mortgage Stress Mapping – Nov 2017 – Pressure Is Mounting

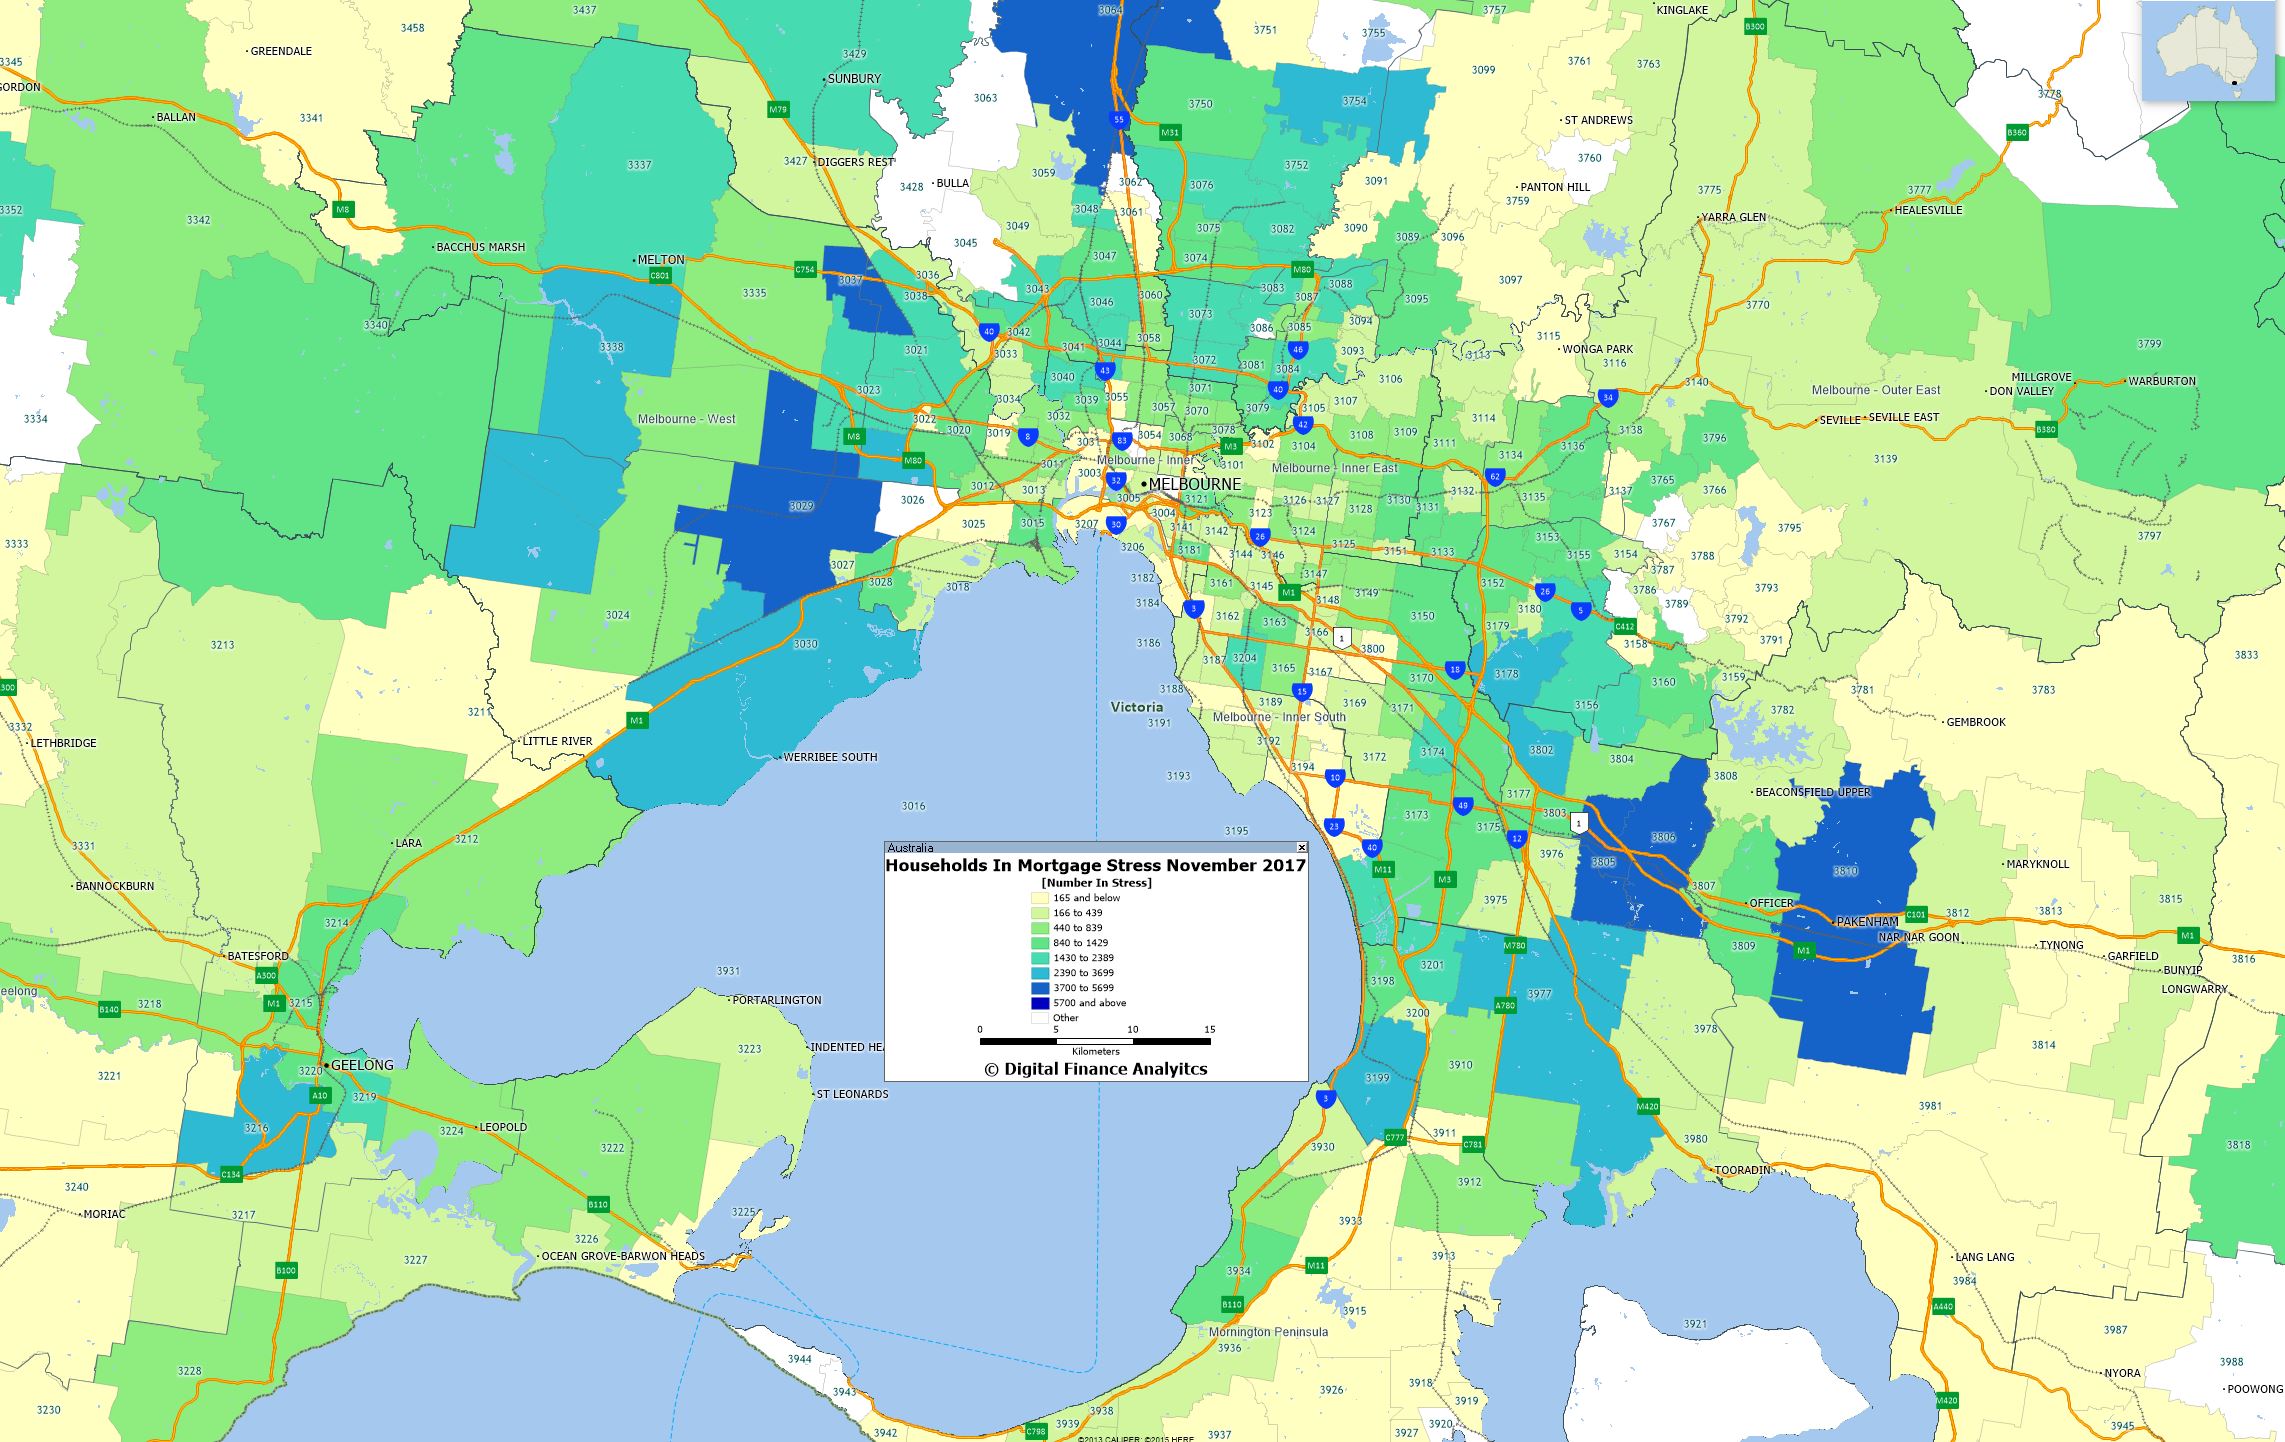
Continuing our series on mortgage stress, we feature the results for Melbourne and VIC today. In fact more than half the post codes nationally in the top 10 are in VIC, so risks are rising fast here (and prices are still rising too!).

In November another 3,000 households in VIC slipped into stress, reaching a new high of 253,000. 13,000 of these risk default in the next 12 months.

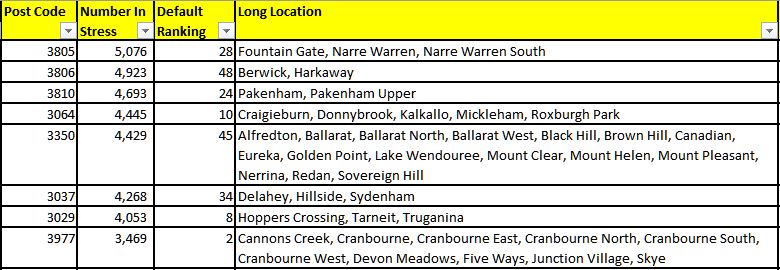
Next, here is the overall listing of the top 10 most stressed post codes across VIC as at the end of November 2017. We also show the relative default risk ranking across the country. Cranbourne has the 2nd highest default ranking nationally this month.

The most stressed post code in the state is 3805, which includes Narre Warren and Fountain Gate. This area is around 38 kilometers south east of Melbourne. Here 5,076 households are in mortgage stress. The average home price is $545,000 compared with $366,000 in 2010.  There are more than 15,000 families in the area, and the average age is 34 years. The average household income is just over $7,000 a month, which is higher than the national average. 54% of homes are mortgaged and the average monthly repayment is $1,700 slightly below the national average of $1,755.

Next is 3806, Berwick and Harkaway which is around 40 kilometers south east of Melbourne, with 4,923 households in mortgage stress. The average home price is $625,000 compared with $451,000 in 2010. There are around 13,000 families in the area, with an average age of 36. More than 47% of households here have a mortgage and the average repayment is $1,850 compared with the average income of $7,600.

Next is 3810, Packenham, with 4,693 households now in mortgage stress and in the same position as last month. It is around 54 kms south east of Melbourne. The average home price is around $435,000 compared with $290,000 in 2010. According to the latest census the average age is 32 years and there are more than 12,600 families in the district. The average monthly household income is $5,900, below the average in the state as well as nationally. 46% of homes have a mortgage, compared with the VIC average of 35%. The average monthly mortgage repayment is $1,700.

Then comes 3064 Craigieburn, Mickleham and Roxburgh Park.  It is about 24 kms North from Melbourne. Around 4,445 households in the area are in mortgage stress. There are about 19,300 households in the area and the average age is 30. The average home prices in 2010 was $335,500 and is now worth $489,400. The average income is around $6,400, which is slightly above the Victorian and Australian averages.  88% of properties in the area are separate houses, and most have three or more bedrooms. More than 56% of homes here are mortgaged and the average repayment each month is $1,733, which is close to the average in Victoria, but lower than the Australian average.

Next is post code 3350, which includes Ballarat and the surrounding area, It’s about 100 kilometres from Melbourne and is down one place from last month. In this region there are 4,429 households in mortgage stress. The average property value is $335,000, compared with $281,000 in 2010. There are more than 14,500 families in the area and the average age is 37, line ball with the average across the state. The average monthly income is $5,300, well below the national and state averages. Around 33% of households have a mortgage and the average repayment is $1,408 a month.

Finally is post code 3037, which includes areas around Delahey, Hillside and Sydenham; around 20 kms north west of Melbourne.  Here around 4,268 households are in mortgage stress. Of the 13,000 households in the district, more than half have a mortgage and the average age is 33. The average home price is around $530,000, up from $365,000 in 2010. The average monthly income is around $7,200 and the average mortgage repayment is $1,730.

We continue to see mortgage stress still strongly associated with fast growing suburbs, where households have bought property relatively recently, often on the urban fringe. The ranges of incomes and property prices vary, but note that it is not necessarily those on the lowest incomes who are most stretched. Banks have been more willing to lend to these perceived lower risk households but the leverage effect of larger mortgages has a significant impact and the risks are underestimated.

Next time we will look at Brisbane.


Greater Sydney Mortgage Stress Mapping – Nov 2017

Having released our November Mortgage Stress analysis, we now look across the states in more detail. Today we look at NSW and Greater Sydney.

NSW has 251,576 households in stress, up 9,000 from last month, and we estimated there are around 13,900 households at risk of default over the next 12 month in the state.

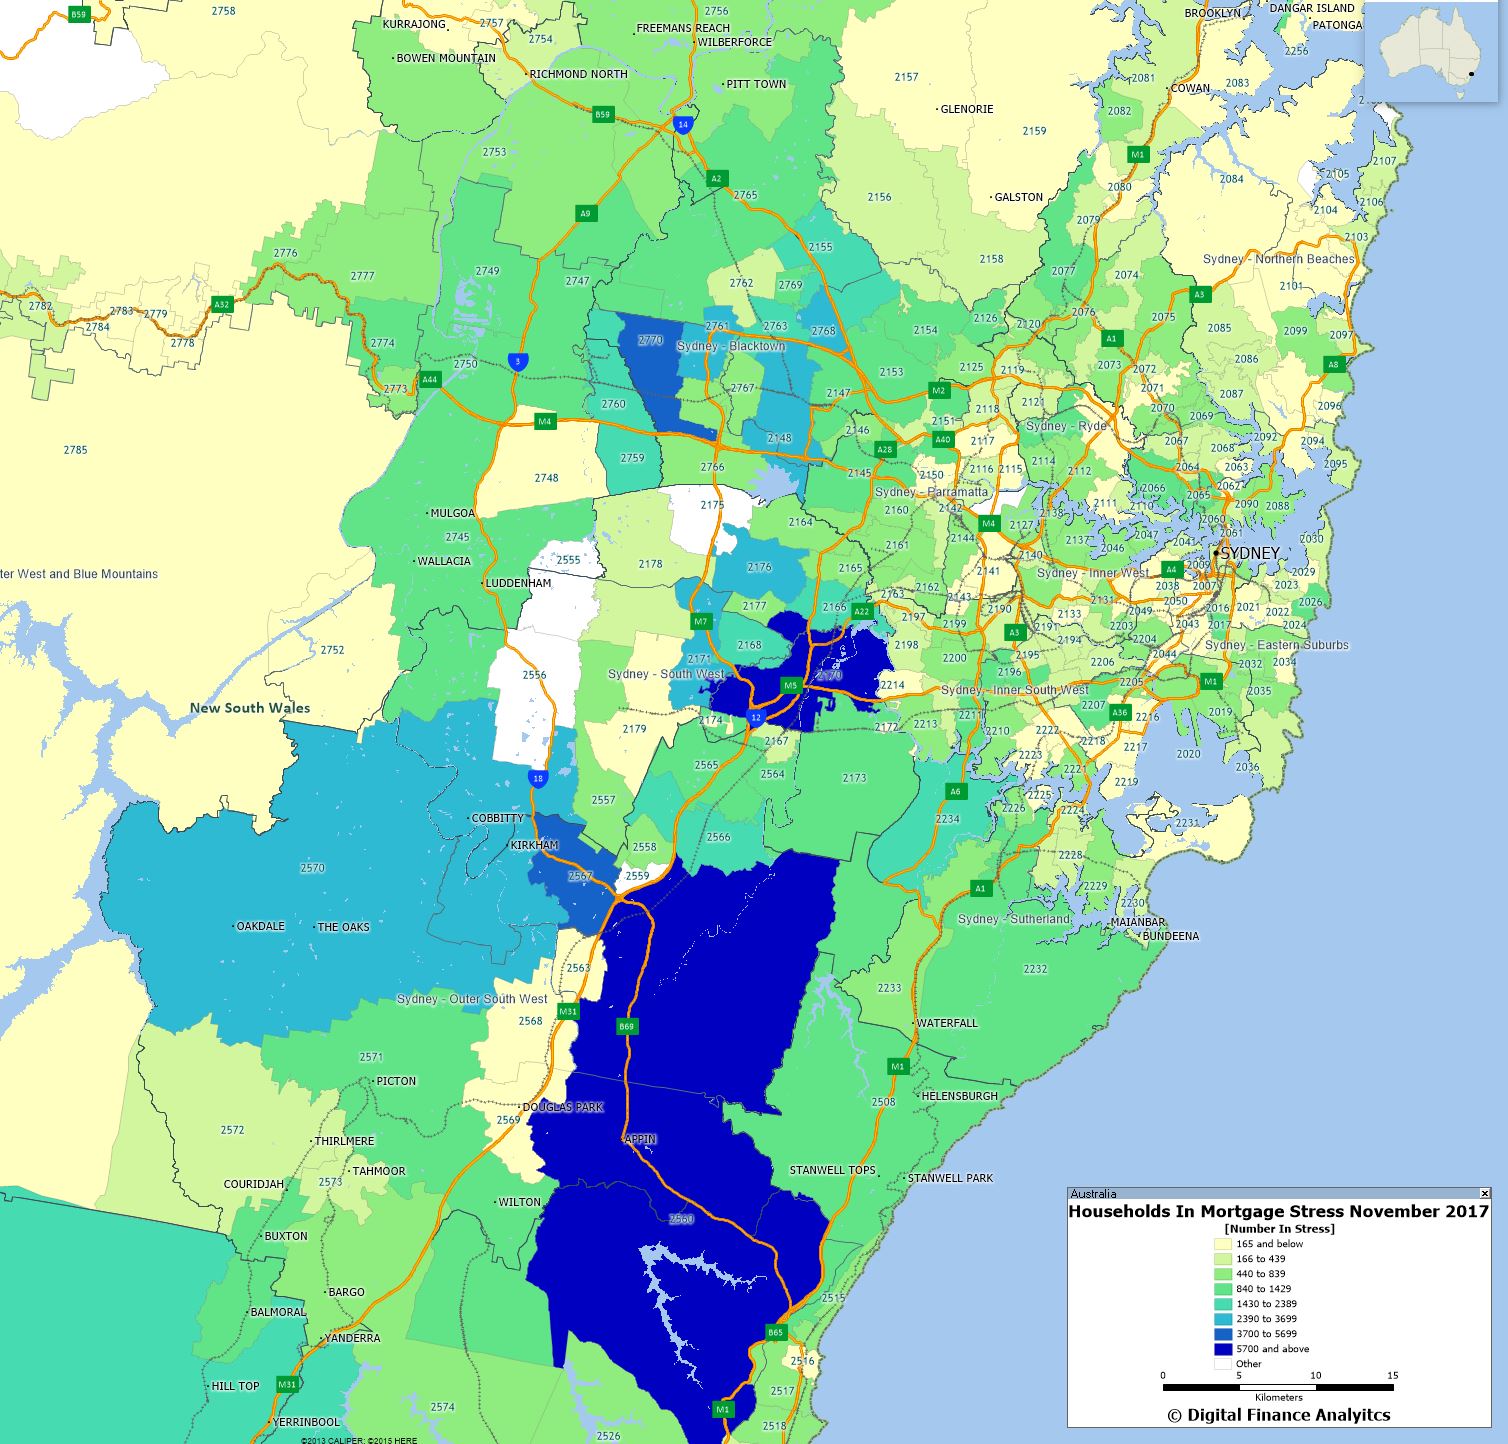
Here is the stress mapping around Great Sydney of the count of households in difficulty. We see a swathe of issues across Western Sydney.

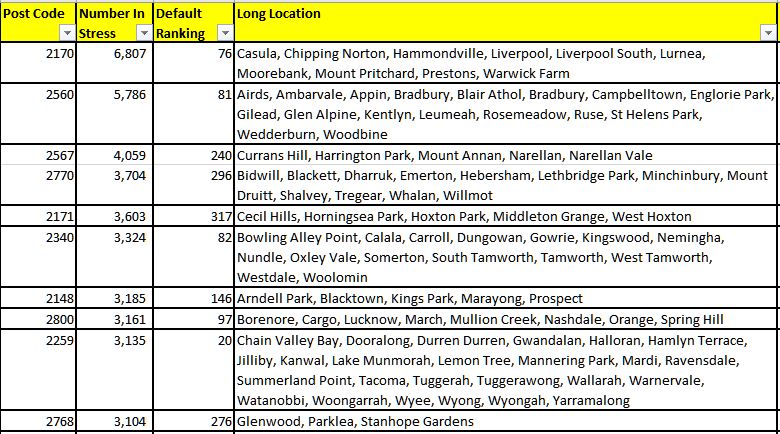
The post code with the highest count of stressed household is 2170, the area around Liverpool, Warwick Farm and Chipping Norton, which is around 27 kilometers west of Sydney. There are 6,807 households in mortgage stress here. The average home price is $803,000 compared with $385,000 in 2010. There are around 27,000 families in the area, with an average age of 34. The average income is $5,950. 36% have a mortgage and the average repayment is about $2,000 each month.

Next is the area around Campbelltown, 2560, which is around 43 kilometers inland from Sydney. Here 5,786 households are in mortgage stress. The average home price is $625,000, up from $320,000 in 2010. Around 20,000 households live in the area with an average age of 34 years. The average income is $6,100 a month. 37% have a mortgage and the average repayment is higher than the national average at $1,800.

We continue to see mortgage stress still strongly associated with fast growing suburbs, where households have bought property relatively recently, often on the urban fringe. The ranges of incomes and property prices vary, but note that it is not necessarily those on the lowest incomes who are most stretched. Banks have been more willing to lend to these perceived lower risk households but the leverage effect of larger mortgages has a significant impact and the risks are underestimated.

Next, here is the overall listing of the top 10 most stressed post codes across New South Wales as at the end of November 2017. We also show the relative default risk ranking across the country. We will explore risk of default further in a later post, not least because we get different distributions depending on whether we look at the number of defaults, or the absolute value at risk.

Meanwhile, in our next stress-related post, we will look at Victoria.

The Other Side of Digital

A report, commissioned by TSA Limited (TSA), a not-for-profit industry funded organisation developing sales and marketing campaigns to promote the paper and print industries, makes some interesting comments on the down side to digital.

According to The Australian Bureau of Statistics, 87% of Australians access the internet daily with an average of 10 hours a day spent on an internet connected device. With many of our daily tasks now being carried out digitally, consumers are becoming increasingly aware of how much time they are staring at screens.

Findings from a 2017 Toluna survey, a study into Australian consumer preferences, trust and attitudes towards print and paper in a digital world, indicate that Aussies do know when enough is enough with many choosing to disconnect from the online world and get back in touch with print to reduce the digital overload.

Specifically, the findings showed that 48% agree they spend too much time on electronic devices, with 34% saying they are suffering from digital overload. In addition to this, 52% are concerned the overuse of electronic devices could be damaging to their health, including symptoms of eyestrain, sleep deprivation and headaches.

The report highlights the differences between consumer segments, and their preferences.

When the data was broken down into age demographics by channel, reading preference remains relatively the same across all channels for each age group. For example, Generation X recorded a consistent preference for print across newspapers/news (41%), magazines (42%), books (43%) and product catalogues (42%) showing only a 2% difference across all four of the channels. At the same time, analysis of the data shows there are large preference discrepancies between age groups. For example, Millennials represent 60% of the 11% of those who prefer to read their newspaper/news on mobile, whereas Baby Boomers only represent 7% of them.

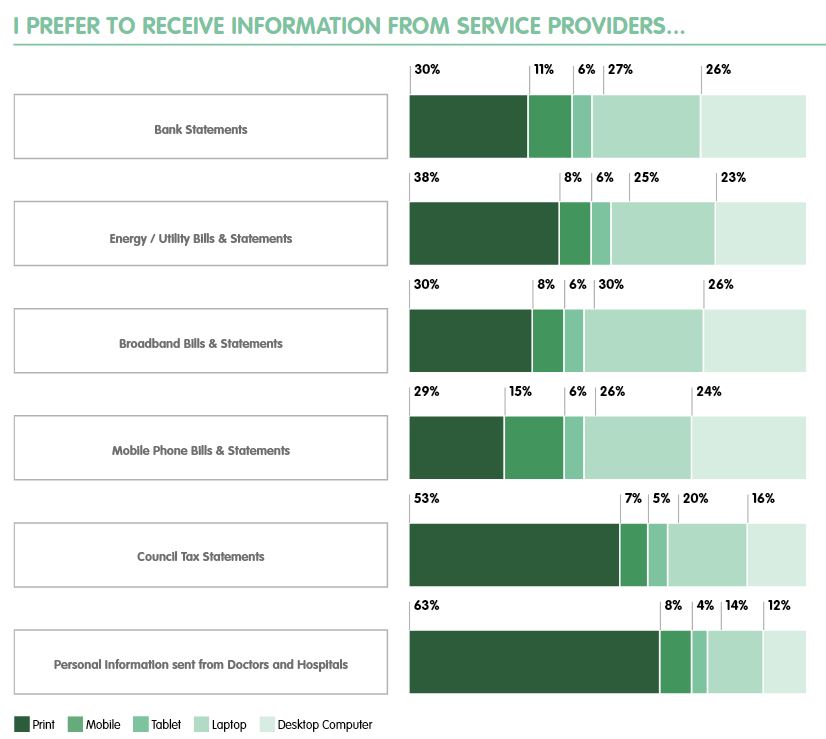
When looking at how consumers prefer to receive information from service providers, results indicate consumers prefer to receive information in print, with the highest being from council or doctors. However, if we combine the two computer channels (laptop/desktop) a preference trend line can be drawn in favour of digital for utility and telecommunications. Tablets are the least preferred for receiving information from service providers.

Interestingly, preference for mobile phone bills and statements via mobile sees the highest preference at 15% for mobile compared to other service providers. Mobile service providers are evidently utilising their channel well, as otherwise, mobile sits second lowest in preference next to tablets.

The advancements of digital technologies enabling everything from communicating globally to fighting disease are irreplaceable – however, our desire to engage with them 24/7 seems to be waining.

The Toluna study found that consumers prefer print for leisure and for consuming news media, reporting that 72% prefer to read books and magazines in print, and 56% prefer to read newspapers in print. To combat digital overload, and align with consumer’s preferences for paper and print, it seems analogue methods are making a comeback.

Similar to the resurgence of vinyl and old school photography, stationary and physical daily planners are flying out the door and companies like kikki.K and Typo among others, are reaping the benefits. What was accused of being dead is coming back and we are seeing more and more consumers turning to print and other analogue channels with 66% believing it is important to “switch off”.