New results from Roy Morgan show that customer satisfaction with banks in the six months to February 2018 was 81.0%, down marginally from 81.2% in January. This level still represents a positive result when seen in the context of the long term monthly average of 73.8% calculated since 2001.
ING, St George and Westpac show improved satisfaction
Of the ten largest consumer banks, ING showed the biggest improvement in satisfaction over the last month, up 1.1% points to 86.3%, followed by St George up 0.6% points (to 83.9%) and Westpac up 0.2% points (to 78.1%). The remainder of the big four showed only marginal declines, with CBA down 0.1% points (to 80.0%), NAB down 0.2% points (to 78.9%) and ANZ down 0.2% points (to 78.4%). Each of the big four remain below the overall bank satisfaction level of 81.0%.
Consumer Banking Satisfaction – 10 Largest Consumer Banks1
Source: Roy Morgan Single Source (Australia). 6 months to January 2018. n= 23,945; 6 months to February 2018, n = 23,887. Base: Australians 14+. 1. Based on customer numbers. 2. Includes banks not shown.
Bendigo Bank retained the highest satisfaction rating among the ten largest banks with 87.8%, followed by ING (86.3%), St George (83.9%), Bankwest (83.7%) and Bank of Queensland (83.6%).
Satisfaction with mobile banking is well ahead of branches
The rapid increase in the use of mobile banking, with its higher satisfaction levels compared to branches, appears to have the potential to positively impact overall bank satisfaction. All four of the major bank’s customers have higher satisfaction with their mobile banking compared to those using branches. Internet banking users also have higher satisfaction than those using branches but on average remain a little below that of mobile bankers. The fact that around two thirds (65.3%) of the population now use either mobile banking or internet banking in an average four week period (and showing an upward trend) is a positive for bank satisfaction as these channels have satisfaction ratings of up to 92% compared to around 86% for branches.
Satisfaction with Banking Channel Used in the Last 4 Weeks
Source: Roy Morgan Single Source (Australia). Six months ended February 2018, n = 23,887. Base: Australians 14+.1. Using an App on a mobile phone or tablet. 2. Using an institutions website. 3. Includes Banks not shown, Building Societies and Credit Unions
The CBA has the highest satisfaction of the four majors for mobile banking with 92.9% and for internet banking (91.1%) and is a close second for branch banking with 86.0%. NAB with 90.8% and Westpac with 91.0% have their highest satisfaction ratings for mobile banking, while the ANZ scored their highest satisfaction with 89.2% for internet banking.
These latest results are from Roy Morgan’s Single Source survey of over 50,000 consumers per annum.
We continue our analysis of the latest household survey results, with a deep dive into the motivations and barriers of first time buyers, whom both industry and government hope will pick up the slack as property investors flee.
We showed there was an increase in the number of first time buyers seeking property and saving to buy, and their intention to transact is a little higher. That said, the number of first time buyers is lower, at around 150,000 than the number of investors they are replacing at 650,000, so net demand will fall at a time when more new builds are coming on stream, something like 150,000 over the next 1-2 years.
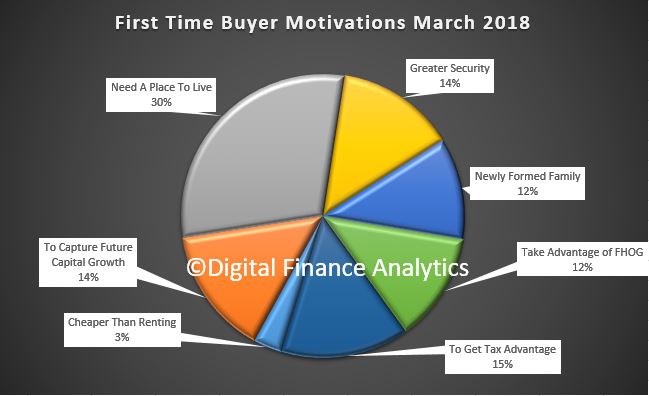
Lets look at first time buyer relative priorities and motivations. Around 30% say the reason to buy relates to finding a place to live, while 15% said it was to gain a tax advantage, 14% to gain future capital growth, and 12% to access the first home owners grants, which some states are offering. 14% said it was to gain greater security (as opposed to short term renting) and 12% said it was because of a newly formed family. Only 3% said it would be cheaper than renting. More are getting help from the Bank of Mum and Dad, as we discussed recently.
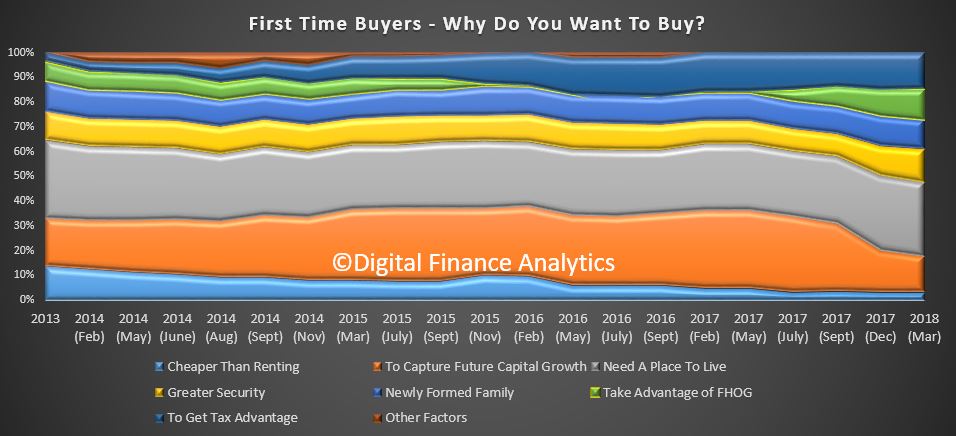
We can also look at trends over time, and the proportion who think capital growth will occur has fallen by half in the past year, while the number seeking to take advantage of the first home owner grants has started to rise (mainly thanks to new state-based initiatives). The other factors have remained pretty static, through more are seeking tax advantages and greater financial security.
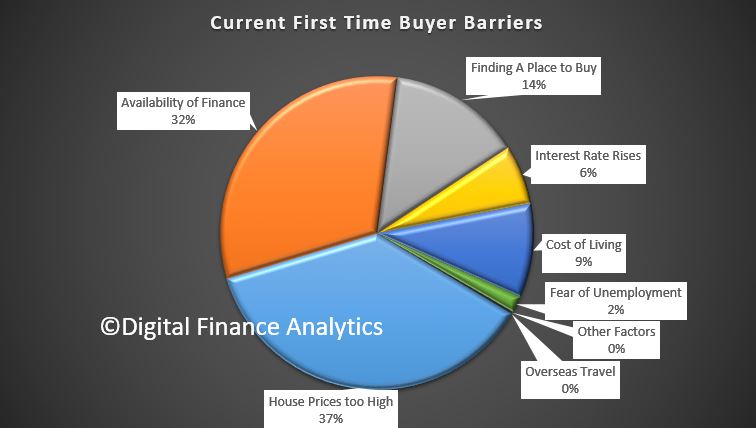
Turning to the barriers to purchase, the first and most significant stumbling block is that home prices are still too high (37%). Next is the availability of finance at 32%, followed by finding a place to buy at 14%, risks relating to interest rate rises 6% and costs of living 9%. Fear of unemployment is a low 2%, and other factors, including overseas travel hardly registered.
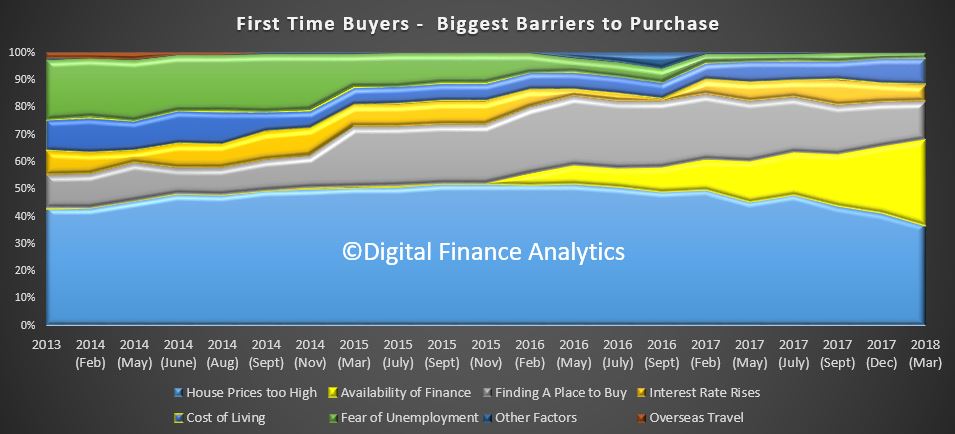
Turning to the trend data we see the most significant factor is the growing proportion who are unable to get funding to purchase. Back in 2015, this hardly registered, whereas now one third of prospective purchasers cannot get funding. This is a reflection of the ever tighter lending standards currently in play, despite low attractor interest rates.
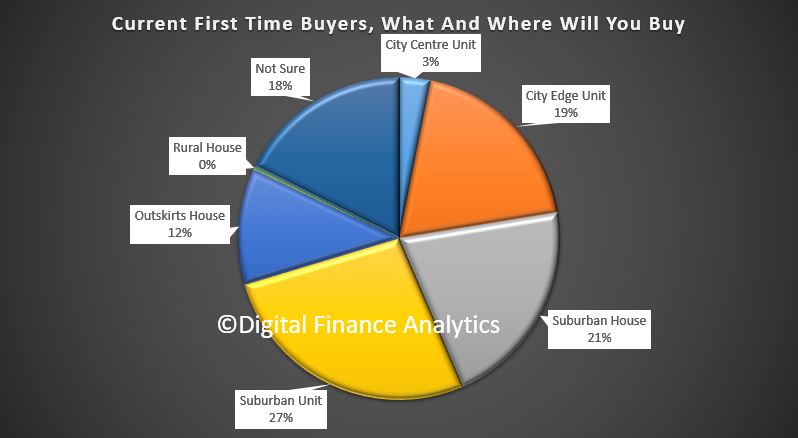
Next we turn to what type of property, and in which locations first time buyers are looking.
Around half of all first time buyers are expecting to purchase a unit or apartment, as opposed to a house. This continues the trend of recent years. 27% will be seeking a suburban unit, 19% a city edge unit and 3% a city centre unit. The proportions are higher in the main east coast states, with Sydney, Melbourne and Brisbane all registering growing demand for units, thanks to price and affordability pressure.
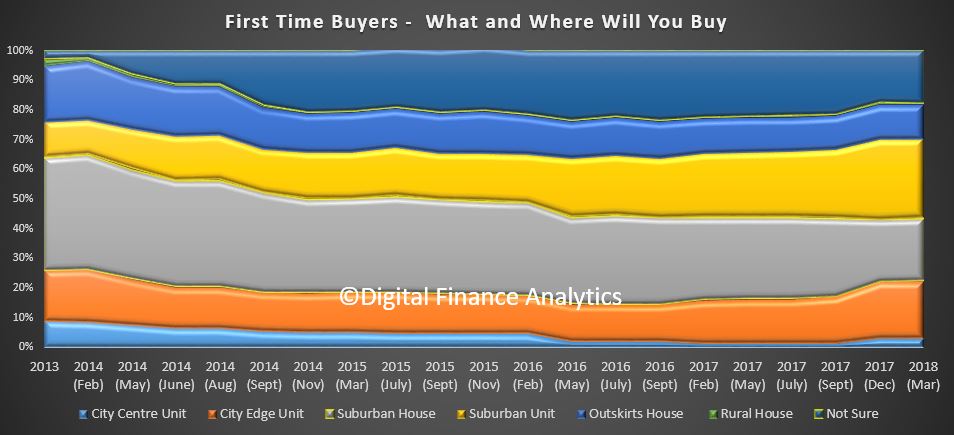
The trend data shows a steady rise in unit purchases.
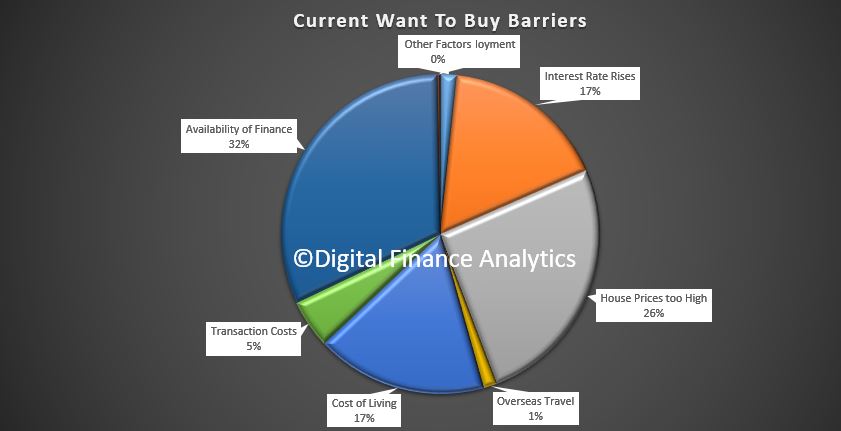
Just to round out our survey results, those wanting to buy find that availability of finance is the most significant barrier (32%), followed by high home prices (26%) and costs of living pressures (17%). Concerns about rising interest rates also came it at 17%.
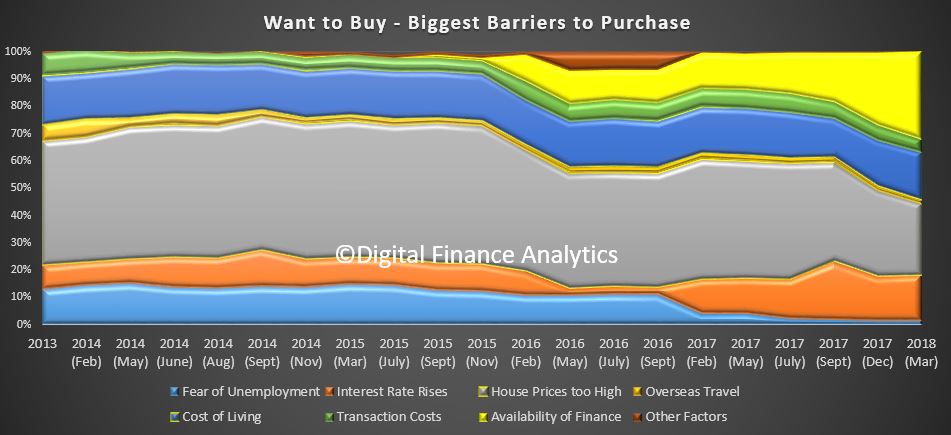
You can see in the trends how concerns relating to funding and costs of living are rising.
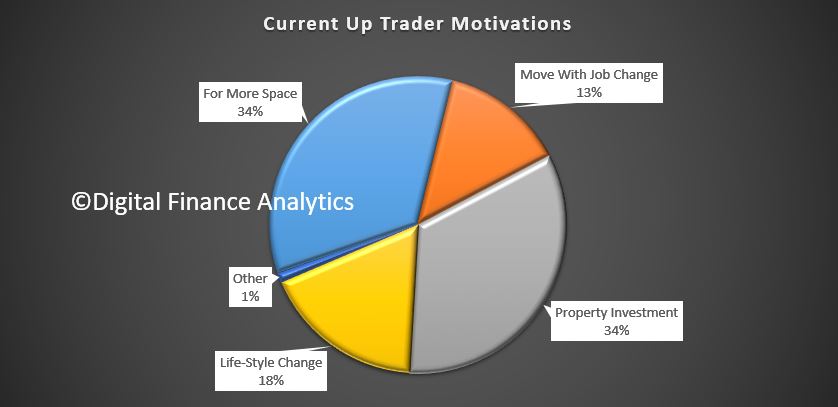
Turning to those seeking to trade up, we see a pivot from property investment (34%) and consequential capital growth to finding more space to live (34%). Life style changes at 18% and job changes also figure (13%).
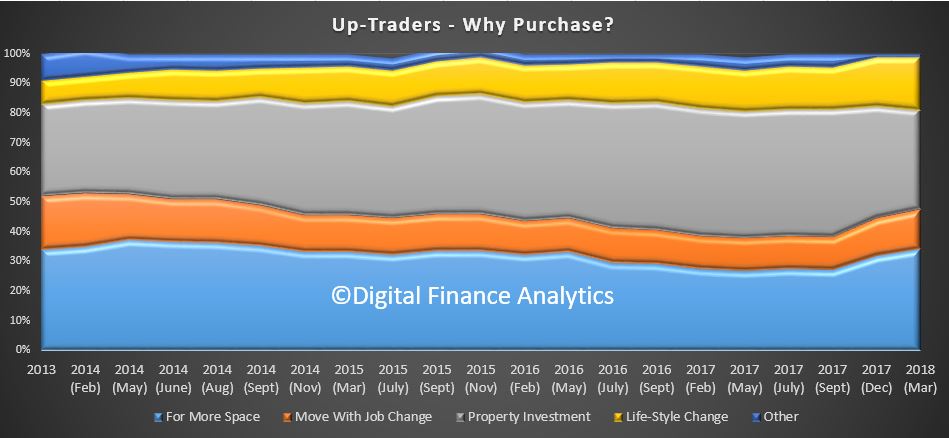
The trends are clear, it is now more about space, and less about property investment. There are a smaller number of households in this category now, at around 600,000, so they will not be able to blot up all the available property, including those previously taken by investors.
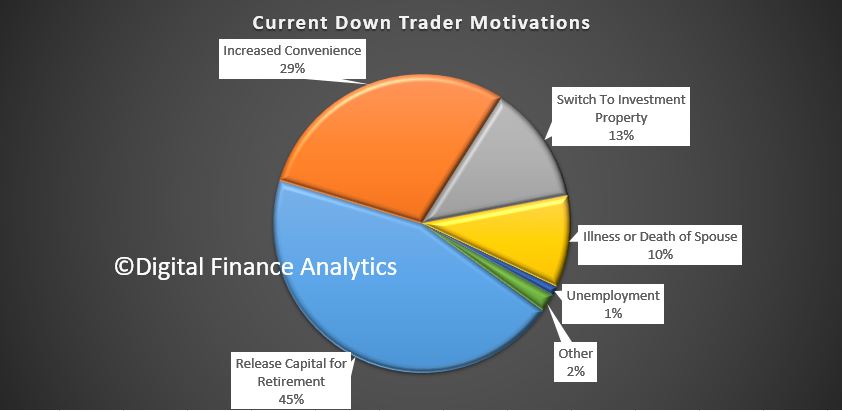
Down traders are being driven more strongly by the urge to release capital (45%), whilst the intention to switch to an investment property is now lower (13%). Indeed there is an air panic, for fear of larger price fall later. One reason why more property is coming onto the market. Increased convenience (29%) and illness or death of spouse also figure. There are more than 1.2 million households in this group, so their need to sell will help to increase the supply of properties for sale, and so drive prices lower, especially at the upper end of the market.
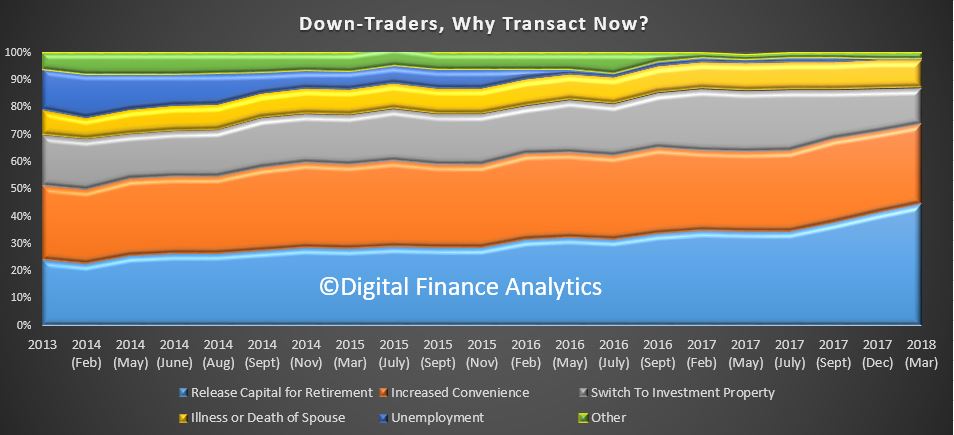
The trends are pretty clear, with a greater concern to release capital a less of a focus on investment property purchase.
Put all the data together, and we conclude that despite strong migration, net demand for property will ease in the months ahead, with a consequential fall in values in many areas.
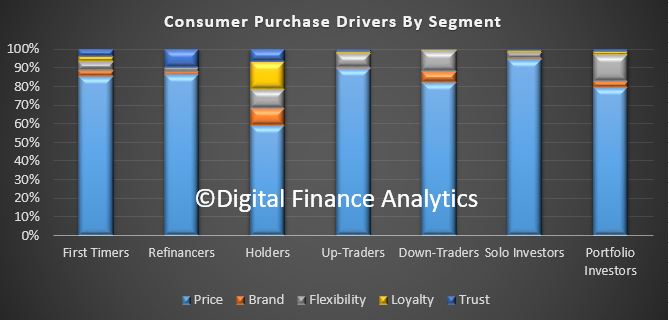
And finally, we also examined the purchase drivers across our household segments, and as you may have guessed, for many, price will be the critical determinate of purchase, whereas elements such as brand recognition, trust and flexibility were rated much lower. No surprise then that lenders are still offering amazing attractor rates to capture new business, despite pricing up their back books to maintain margin. As the Productively Commission highlighted, loyalty is not being rewarded by the industry. We happen to think this may change as the markets evolve and demand for credit slows.
We will incorporating these findings into our latest Core Market Model and the next edition of the Property Imperative report, due out in about a month.
Today we continue our analysis of the latest results from our Household Surveys by drilling down into the segment specific analysis, having in our previous post looked at the changing dynamics across our household segments.
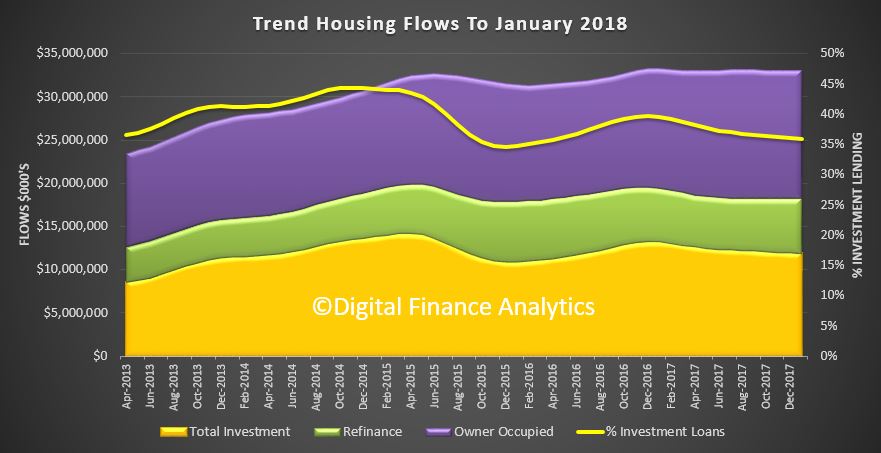
We start with the Property Investor segments, which are becoming significantly less active thanks to a tightening of lending standards, higher mortgage rates and more limited capital growth. As a reminder the latest available ABS data shows that lending flows to investors is slowing, and especially interest only loans, and the number with interest only loans who are now being forced to move to the more expensive principle and interest loans is rising.
Yesterday we showed how their buying intentions were tanking.
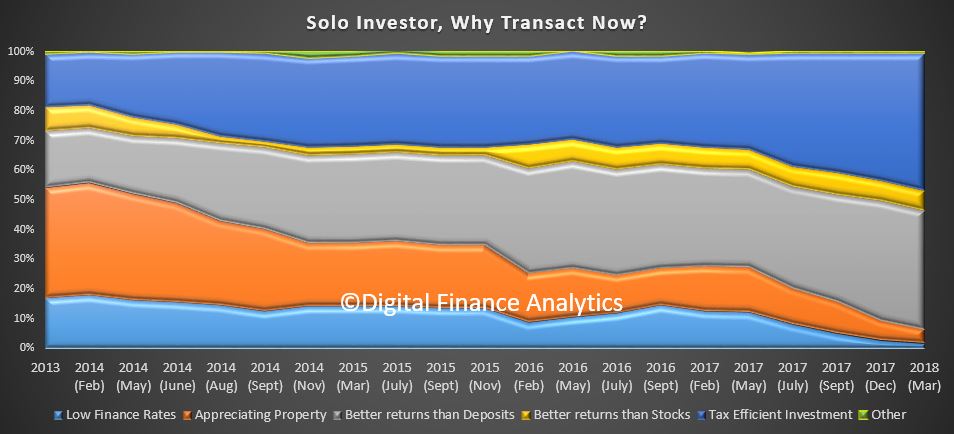
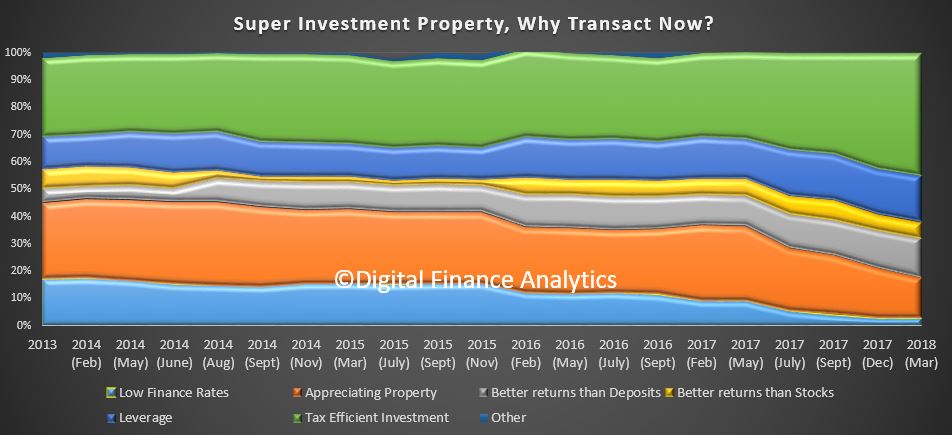
So now lets go deeper into the data, starting with solo investors – those with just one or two properties, and their motivations. The predominate reason for investors to hold property now relate to the tax benefits which can be accessed at 46%, up 3% from December 2017. This includes the ability of offset costs (including interest costs) against tax, as well as access to the very beneficial capital gains. The other driver is the perceived better returns compared with bank deposits at 39%, despite the fact that it you tot up all the various costs of an investment property, including returns from rentals, half the properties are under water! Other factors, such as access to low finance rates (1.9%) and appreciating property values (4.7%) are becoming less significant.
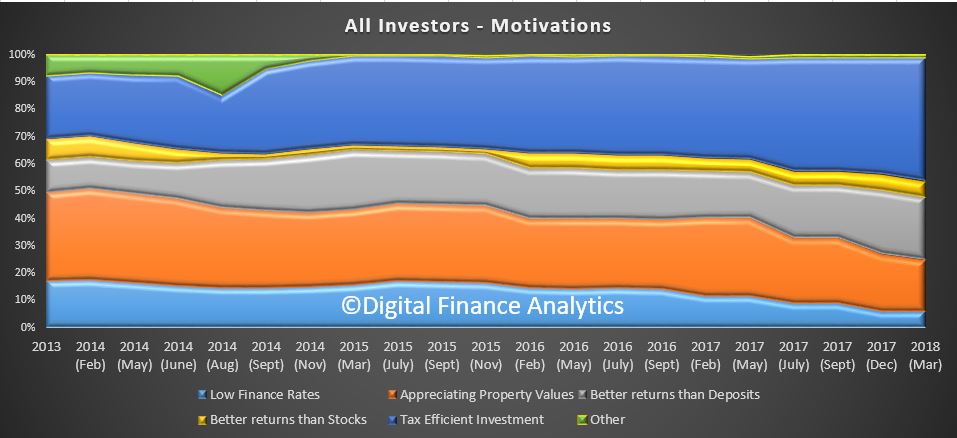
The pattern for portfolio investors is vary similar. So looking across all investors, we see a similar footprint, with the drive to gain tax efficiency (45%, up 2.4%), better returns than deposits (23%) and low finance rates down to 6.1%. Appreciating property values account for 18% of the motivation, down 2% on the previous quarter and continues to slide.
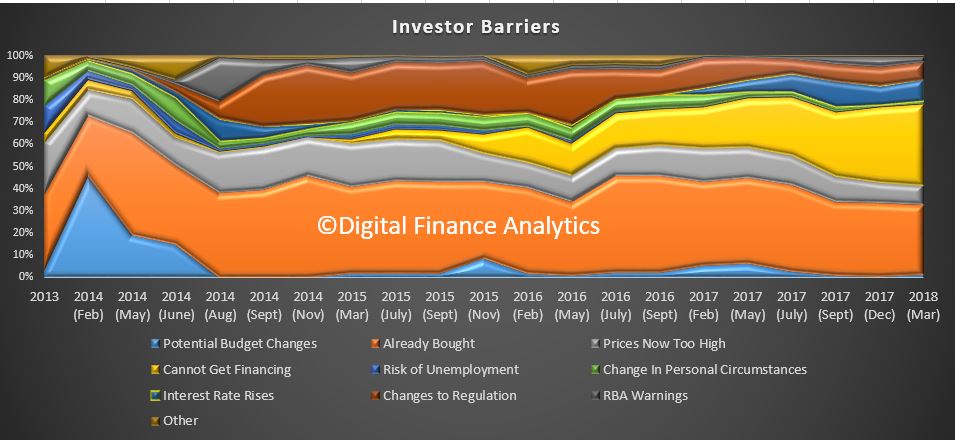
Turning to the investor barriers, we see a significant rise in the number of investors who are unable to get finance, up 3% to 36.7%, a trend which started in 2015, but is now accelerating. A further 10% see potential interest rate rises a barrier, up more than 1% from December 2017. We note that RBA warnings have only a small impact, at 2.5%, down 2% from our last surveys.
Looking across to property investment via a self- managed superannuation fund, once again tax benefits at 45%, up 2%, and better returns than deposits at 14%, plus leverage 17% account for the majority of the motivations to transact. 14.6% of SMSF property investors are still expecting further property gains, but this is down more than 2% from last time. Low finance rates accounted for only 2% of motivations.
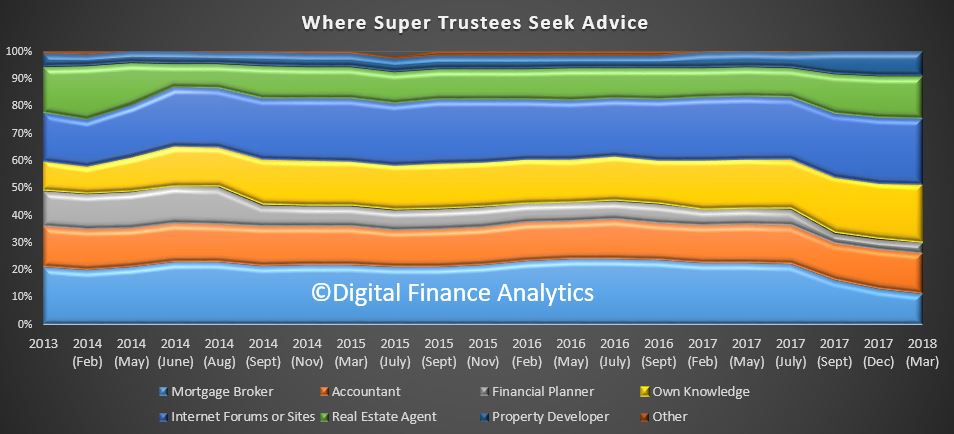
We also examine where trustees of SMSF’s obtain property investment advice. 24% obtain advice online from internet forums, 21% use their own knowledge, 15% use a real estate agent, 15% also use an accountant and 11% use a mortgage broker. We noted a 2% drop in those using a mortgage broker compared with December.
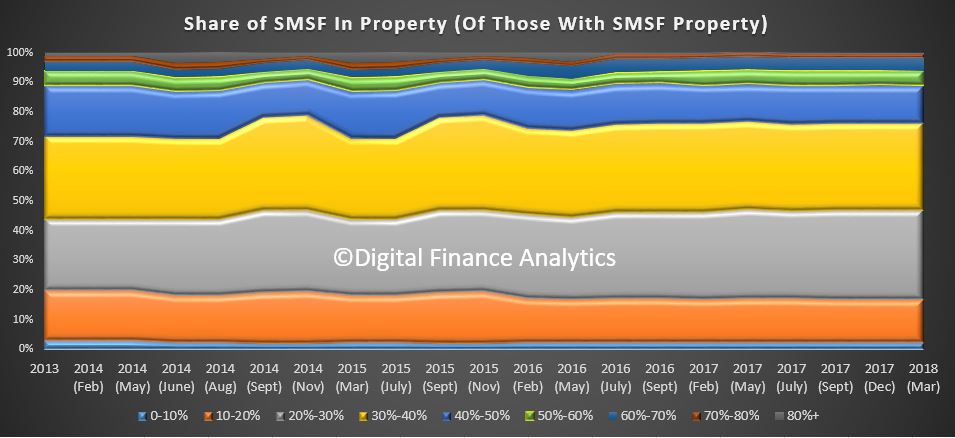
Finally, the asset allocation of a SMSF into property varies, with 30% holding 20-30% of their funds in property, 29% holding 30-40%, and more than 11% holding more than half of their SMSF assets in property. Only a very small proportion hold more than 80% of their funds in property. The mix has not really varied significantly over time, but the proportion of all super funds with property assets has risen from just over 3% to more than 5%, and rising. Such non- recourse borrowing has been identified by APRA as higher risk, so in their new guidelines, banks will need to hold higher capital against these loans. In addition of course David Murray’s Financial System Inquiry (FSI) recommended that SMSF’s should not be able to leverage into property. We support that recommendation, which the Government rejected.
So standing back, it is clear that investors are getting skittish, hence the lower demand for property, as well as difficulty in gaining access to finance. This is why we think investment property demand will continue to fall. As they account for more than one third of all loans, this will put downward pressure on property prices.
Finally, the number of first time buyer investors – those who are going direct to the investment sector continues to fall, as can be seen from our analysis of ABS and DFA datasets.
The latest release of the Digital Finance Analytics Household Survey to end March 2018, helps to explain why we think home prices are set to fall further. We discussed four housing and property scenarios in a recent video blog.
But drawing on our 52,000 sample, from across Australia, today we will walk through the top-level survey findings, before later drilling into the segment specific data in later posts. You can read about our household segmentation models here. This analysis of course then feeds into our Property Imperative Report, which we publish twice each year as a summary of our research and analysis. The last edition – volume 9 – from 2017 is still available on request.
Read the transcript. or watch the video.
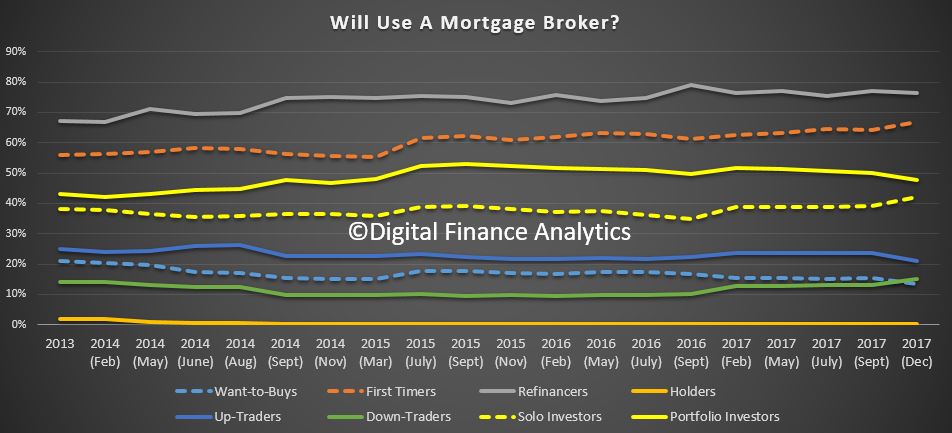
The first chart, which looks across our property segments, shows that both portfolio property investors (who hold multiple properties) and solo investors (who hold one, or perhaps two) intentions to transact are tanking, down 8% since December 2017. As we will see later, this is because credit is less available, capital growth has stalled, and in fact only the tax breaks remain as an incentive! This decline started in 2015, but is accelerating. Remember that 35% of mortgages are for investment purposes, so as this demand dissipates, the floor on prices starts to shatter.
Whilst there are offsetting rises from down traders (who are seeking to release capital before prices fall further) and first time buyers (who are being “bribed” by first owner grants) there is a significant net fall in demand. This pattern is seen across the country, but is most prevalent in our two biggest markets of Sydney and Melbourne.
Refinancing is up a little, thanks to the attractive discounts being offered by many lenders, and as we will see the prime driver is to reduce monthly repayments, as currently household finances are under pressure. We release the latest mortgage stress analysis in a few days.
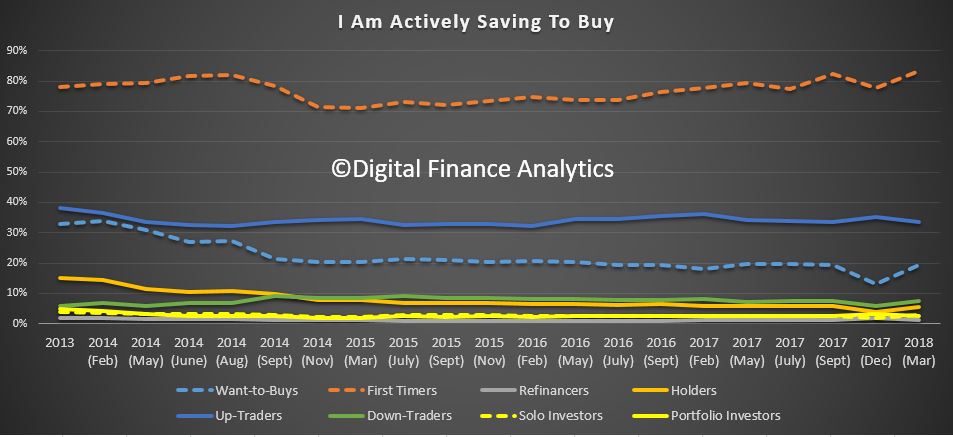
First time buyers and those wanting to buy, are saving a little more in an attempt to access the market, and those planning to trade up are also still putting some funds aside, otherwise, there is little evidence of concerted attempts to save cash for property transactions.
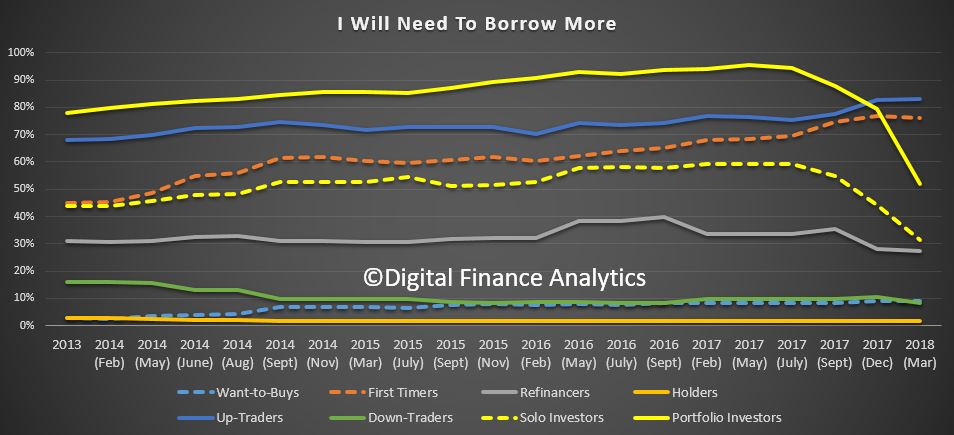
Turning for demand for credit, we see is crashing, especially in the investment segments. There was a 12% fall in the solo property investor group and an amazing 27% fall in the portfolio investor segment. One of the clearest messages from the survey is how much lending standards just got tighter, with an average 20% drop in “borrowing power” compared with a few months ago. As a result many first time buyers and investors simply cannot get credit, because they cannot meet the tighter requirements. The outfall from the Royal Commission will simply exacerbate the situation. There is a strong link between home prices and credit supply, so this will put further downward pressure on property values.
Refinancing households are tending not now to seek to release additional capital from their properties, as part of a refinance deal. We also note a rise in those being forced to refinance from interest only loans to principal and interest loans, and our latest modelling still is tracking an estimated $100 billion problem.
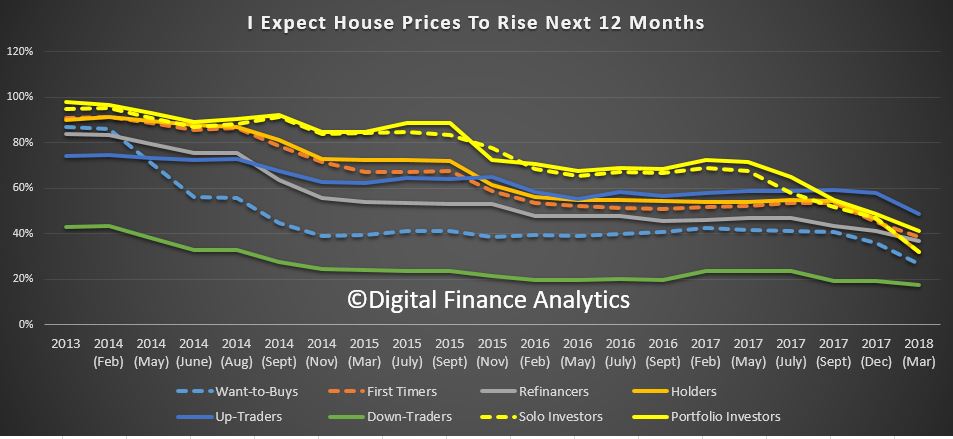
We find that ever fewer households are expecting home prices to rise, this registered across the board – but the trajectory down is strongest among investors. No segment is more bullish on prices compared with last year. This falling trend is strongest in Sydney, but Melbourne appears to be following about 6 months later. Households in Perth and Hobart are more bullish, but only slightly, and this was not enough to prevent the general decline. Remember WA has seen prices slide in recent years.
Households use of mortgage brokers appears pretty consistent (even if the volume of transactions is falling). Those seeking to refinance are most likely to approach a broker, followed by first time buyers.
Next time we will look in more detail at the underlying drivers by segments. But current home prices appear to have no visible means of support – they are going to fall further.
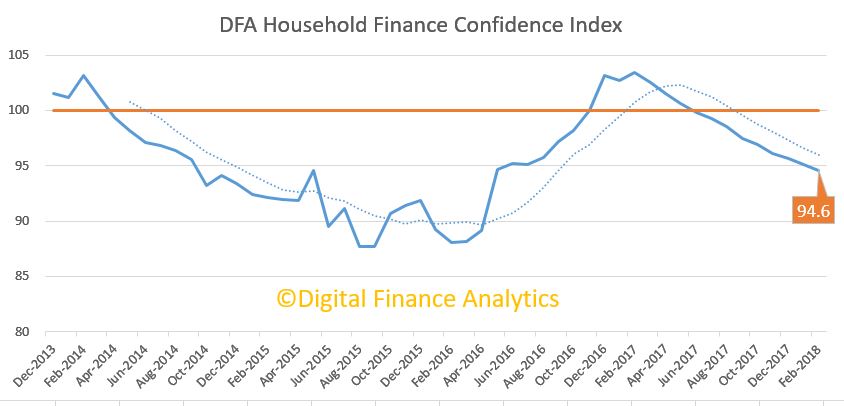
The latest edition of the Digital Finance Analytics Household Finance Confidence Index shows a further drift lower, remaining below the 100 neutral benchmark. It fell to 94.6 in February, down from 95.1 the previous month. This is in stark contrast to improved levels of business confidence as some have reported. Our latest video blog covered the results.
The slide was more significant among those households with investment properties, thanks to higher mortgage rates, concerns about interest only loan resets and lower home prices. In additional net rentals are lower. Owner occupied households also fell just a small amount, mainly because of rising living costs against flat incomes. Those renting, or otherwise excluded from property are the least confident. This continues the long term trend, indicating that property ownership still bolsters confidence to some extent.
The slide was pretty consistent across the states, other than a small lift in WA. Compared with a year ago, confidence levels in NSW and VIC are significantly lower.
We also see a similar story across all the age bands, suggesting the decline in confidence is similarly widely spread.
To understand the reasons for the falls we can look to the index scorecard. Overall, there was a rise of 1.2% in households feeling less secure about their jobs, compared with this time last year, and a small reduction in those feeling more secure.
Those with savings were less comfortable, thanks to continued falls in deposit rates, and recent discussions about deposit bail-in following passage of the recent APRA Act. More significantly, more are dipping into their savings, to maintain lifestyle, and so balances are reducing. Many realise this is not a sustainable position.
Just under half of households remain uncomfortable with the amount of debt they hold, around half saw no change over the past year. Concerns related to rising interest charges which are working through, and also ability to maintain mortgage repayments. Some households have resorted to obtain additional credit, either on a card, or separate loan, to maintain their finances. Again many realise this is not a sustainable position.
Costs of living concerns rose, with 76.7%, up 3.84% on last month, households saying that costs of electricity, fuel, rates, child care and school fees all impacting. Only 2.5% of households said their costs had fallen.
Finally, we saw a fall of 3.7% of households who said their net worth had improved, down to 54.6%, mainly explained by changes in the value of property on one hand, and of share prices on the other. 16% said their net worth had fallen. 28.9% said there had been no change.
Based on our research, we see little on the horizon to suggest that household financial confidence will improve. We expect wages growth to remain contained, and home prices to slide, while costs of living pressures continue to grow. There will also be more pressure on mortgage interest rates as funding costs rise, and lower rates on deposits as banks trim these rates to protect their net margins.
By way of background, these results are derived from our household surveys, averaged across Australia. We have 52,000 households in our sample at any one time. We include detailed questions covering various aspects of a household’s financial footprint. The index measures how households are feeling about their financial health. To calculate the index we ask questions which cover a number of different dimensions. We start by asking households how confident they are feeling about their job security, whether their real income has risen or fallen in the past year, their view on their costs of living over the same period, whether they have increased their loans and other outstanding debts including credit cards and whether they are saving more than last year. Finally we ask about their overall change in net worth over the past 12 months – by net worth we mean net assets less outstanding debts.
Well, according to new research from Roy Morgan, home loan customer satisfaction with banks when using a mortgage broker was only 77.3%. This compares to 80.3% when home loans were obtained in person at a branch. So Banker is best….
Even among more recent home loans (held for under six years) satisfaction with going directly into branch was 81.7% compared to 78.7% for mortgage brokers. This is an important finding because it illustrates the potential impact that a third party can have on the satisfaction level of customers with their banks.
These results cover the six months to January 2018 and are from the Roy Morgan Single Source survey of over 50,000 consumers per annum, including over 12,000 mortgage holders.
Nearly all of the largest banks home loan customers have higher satisfaction with their bank when they obtained their loan in person at a branch, rather than through a mortgage broker. Home loan customers of Bendigo Bank who obtained their loan in person at a branch had the highest satisfaction with 92.6%, followed by Bankwest (87.3%) and St George (86.8%). The best of the big four was NAB with 82.4%, followed by ANZ (79.7%). All of the largest banks, with the exception of Westpac, had higher satisfaction when going direct rather than using mortgage brokers.
Home Loan Consumer Satisfaction: Obtained through Branch vs Mortgage Broker2 – Largest Home Loan Banks1
Source: Roy Morgan Single Source (Australia). 6 months to January 2018, n= 6,052 Base: Australians 14+ with home loan. 1. Based on largest number of home loans purchased at a branch. 2. Excludes other methods of obtaining home loans. 3. Includes brands not shown.
Satisfaction when using mortgage brokers was highest for St George with 85.6%, Bankwest (82.1%) and Suncorp Bank (82.0%). Each of the big four were below the market average (77.3%) for home loan customer satisfaction when using a mortgage broker, with the best of them being NAB (76.4%) and Westpac (75.7%).
Home loan customers go in person to branch
Despite many channels available to obtain home loans, over half (52.4%) of all current loans were sourced from going in person to a bank branch. This is well ahead of the 34.3% who purchased their loan through a mortgage broker. With these two channels accounting for 86.7% of the current market, it is important for banks to know how they perform in each in terms of customer satisfaction.
Method Used To Obtain Home Loan
Source: Roy Morgan Single Source (Australia). 6 months to January 2018, n= 6,052. Base: Australians 14+ with home loan
Other channels used to obtain home loans were, ‘in person with a mobile bank representative’ (8.7%, satisfaction 78.9%) and ‘over the phone’ (4.0%, satisfaction 80.3%).
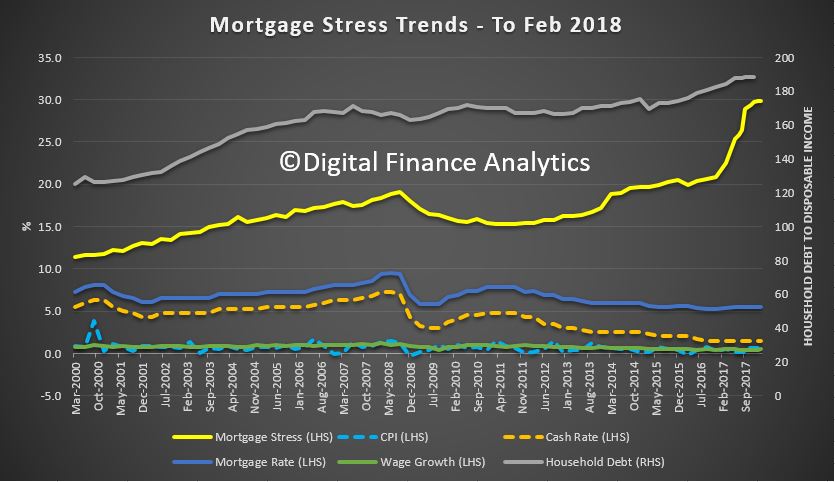
Digital Finance Analytics (DFA) has released the February 2018 mortgage stress and default analysis update. We analyse household cash flow based on real incomes, outgoings and mortgage repayments, rather than using an arbitrary 30% of income.
Across Australia, more than 924,500 households are estimated to be now in mortgage stress (last month 924,000). This equates to 29.8% of households. In addition, more than 21,000 of these are in severe stress, up 1,000 from last month. We estimate that more than 55,000 households risk 30-day default in the next 12 months, up 5,000 from last month.
We expect bank portfolio losses to be around 2.8 basis points, though with losses in WA are higher at 4.9 basis points. Some households continue to benefit from refinancing to cheaper owner occupied loans, giving them a little more wriggle room in terms of cash flow. The typical transaction has saved up to 45 basis points or $187 each month on a $500,000 repayment mortgage. Enough to make a real difference.
Martin North, Principal of Digital Finance Analytics said “the number of households impacted are economically significant, especially as household debt continues to climb to new record levels. Mortgage lending is still growing at two to three times income. This is not sustainable and we are expecting lending growth to continue to moderate in the months ahead”. The latest household debt to income ratio is now at a record, if revised 188.4.[1]
In our report last month, Gill North, a professor of law at Deakin University and a DFA Principal, indicated that “when external conditions in Australia deteriorate and or levels of financial stress and loan defaults rise acutely, a wave of responsible lending actions seems inevitable.”
Last week, the findings of an important case imitated by the Australian Securities and Investments Commission (ASIC) against the ANZ banking group were published: Australian Securities and Investments Commission v Australia and New Zealand Banking Group Limited [2018] FCA 155. ANZ was found to have breached its responsible lending obligations when providing car loans through its former car finance business, Esanda, and was ordered to pay a civil penalty of $5 million. The legal principles established in this case are broadly relevant, as all credit assistance providers (including brokers) and credit providers are subject to responsible lending obligations.
The Court found that in respect of 12 car loan applications from three brokers, ANZ failed to take reasonable steps to verify the income of the consumer because it relied solely on consumer payslips provided by the loan broker in circumstances where ANZ:
knew that payslips were a type of document that was easily falsified;
received the document from a broker who sent the loan application to Esanda; and
had reason to doubt the reliability of information received from that broker;
income is one of the most important parts of information about the consumer’s financial situation in the assessment of unsuitability, as it will govern the consumer’s ability to repay the loan;
while ANZ did not completely fail to take steps to verify the consumers’ financial situation, it inappropriately relied entirely on payslips received from these brokers; and
ANZ management did not ensure that relevant policies were complied with and, in the case of the contraventions involving one broker, no action was taken despite management personnel having become aware of the issues about the broker.
ANZ will be remediating approximately 320 car loan customers for loans taken out through the three broker businesses from 2013 to 2015 which are likely to have been affected by fraud. ASIC has separately taken action against the broker businesses that were involved in submitting false documents to ANZ.
Gill and a co-author (Associate Professor Therese Wilson from the law school at Griffiths University) have just had a paper entitled “Supervision of the Responsible Lending Regimes: Theory, Evidence, Analysis & Reforms” accepted for publication by the prestigious and highly ranked journal of the ANU University, the Federal Law Review. This co-authored paper includes an empirical study and analysis on the responsible lending actions taken by ASIC between 2014 and mid-2017.
Finally, Gill commends the Financial Services Royal Commission for its initial focus on consumer credit related misconduct and “predicts that consumer credit will be at the heart of the next significant banking scandal or financial crisis in Australia.”
Standing back, risks in the system continue to rise, and while recent strengthening of lending standards will help protect new borrowers, there are many households currently holding loans which would not now be approved. This is a significant sleeping problem and the risks in the system are higher than many recognise.
Our analysis uses the DFA core market model which combines information from our 52,000 household surveys, public data from the RBA, ABS and APRA; and private data from lenders and aggregators. The data is current to end February 2018. We analyse household cash flow based on real incomes, outgoings and mortgage repayments, rather than using an arbitrary 30% of income.
Households are defined as “stressed” when net income (or cash flow) does not cover ongoing costs. They may or may not have access to other available assets, and some have paid ahead, but households in mild stress have little leeway in their cash flows, whereas those in severe stress are unable to meet repayments from current income. In both cases, households manage this deficit by cutting back on spending, putting more on credit cards and seeking to refinance, restructure or sell their home. Those in severe stress are more likely to be seeking hardship assistance and are often forced to sell.
The forces which are lifting mortgage stress levels remain largely the same. In cash flow terms, we see households having to cope with rising living costs – notably child care, school fees and fuel – whilst real incomes continue to fall and underemployment remains high. Households have larger mortgages, thanks to the strong rise in home prices, especially in the main eastern state centres, but now prices are slipping. While mortgage rates remain quite low for owner occupied borrowers, those with interest only loans or investment loans have seen significant rises. We expect some upward pressure on real mortgage rates in the next year as international funding pressures mount, a potential for local rate rises and margin pressure on the banks.
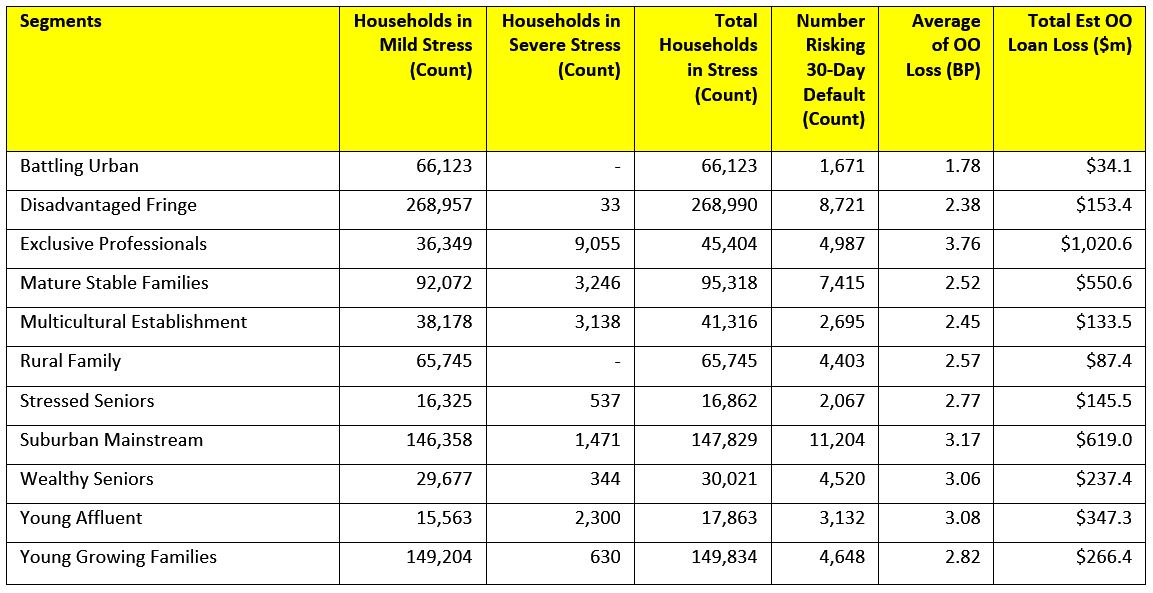
Probability of default extends our mortgage stress analysis by overlaying economic indicators such as employment, future wage growth and cpi changes. Our Core Market Model also examines the potential of portfolio risk of loss in basis point and value terms. Losses are likely to be higher among more affluent households, contrary to the popular belief that affluent households are well protected.
Stress by The Numbers.
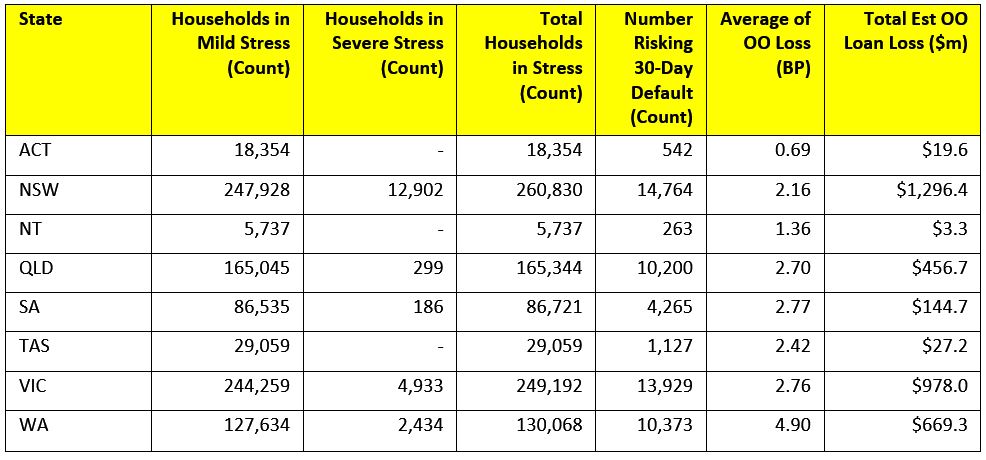
Regional analysis shows that NSW has 260,830 households in stress (254,343 last month), VIC 249,192 (254,028 last month), QLD 165,344 (158,534 last month) and WA has 130,068 (125,994 last month). The probability of default over the next 12 months rose, with around 10,373 in WA, around 10,200 in QLD, 13,929 in VIC and 14,764 in NSW.
The largest financial losses relating to bank write-offs reside in NSW ($1.3 billion) from Owner Occupied borrowers) and VIC ($978 million) from Owner Occupied Borrowers, which equates to 2.16 and 2.76 basis points respectively. Losses are likely to be highest in WA at 4.9 basis points, which equates to $669 million from Owner Occupied borrowers.
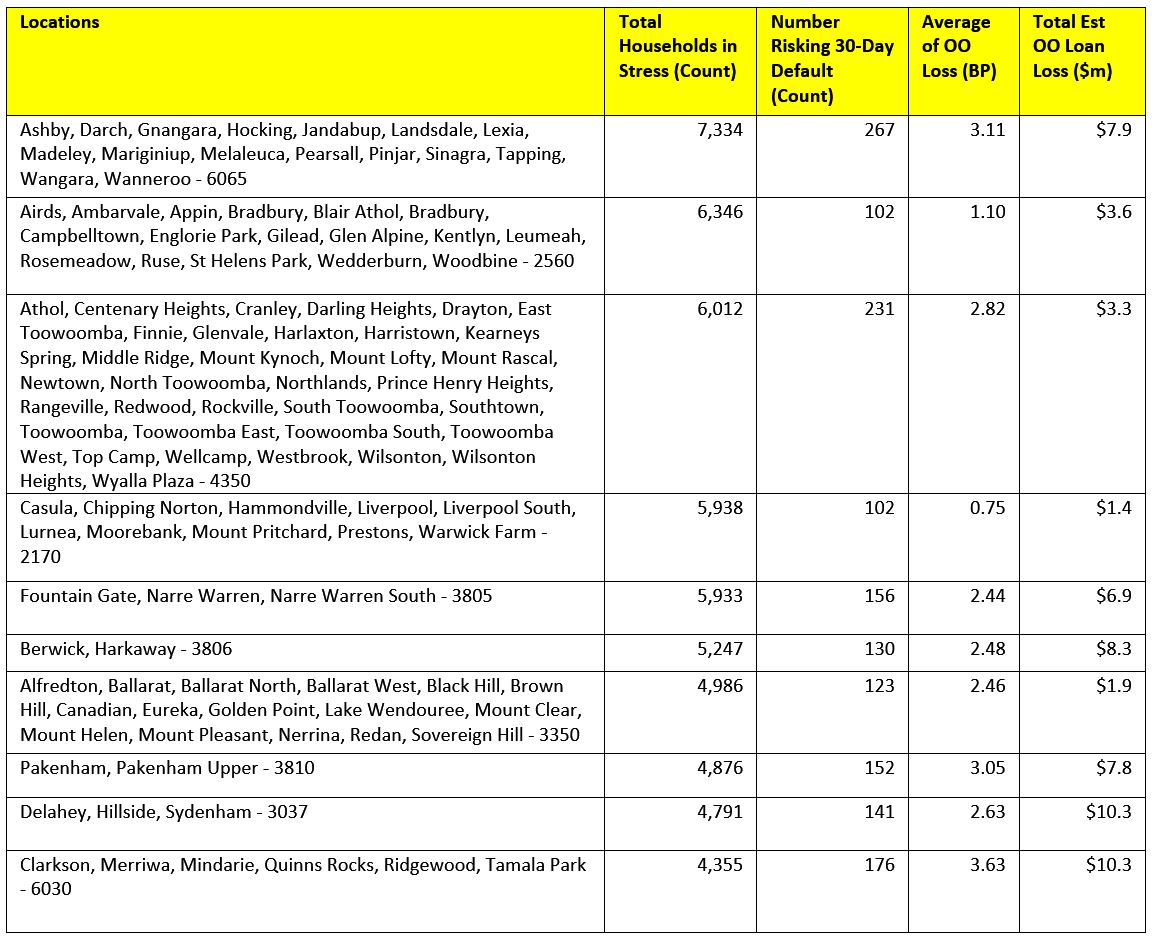
Here are the top post codes sorted by the highest number of households in mortgage stress.
[1] RBA E2 Household Finances – Selected Ratios September 2017 (Revised 2nd Feb 2018). The Bank has recently restated these ratios, taking them on average 10 points lower.
You can request our media release. Note this will NOT automatically send you our research updates, for that register here.
[contact-form to=’mnorth@digitalfinanceanalytics.com’ subject=’Request The February 2018 Stress Release’][contact-field label=’Name’ type=’name’ required=’1’/][contact-field label=’Email’ type=’email’ required=’1’/][contact-field label=’Email Me The February 2018 Media Release’ type=’radio’ required=’1′ options=’Yes Please’/][contact-field label=”Comment If You Like” type=”textarea”/][/contact-form]
Note that the detailed results from our surveys and analysis are made available to our paying clients.
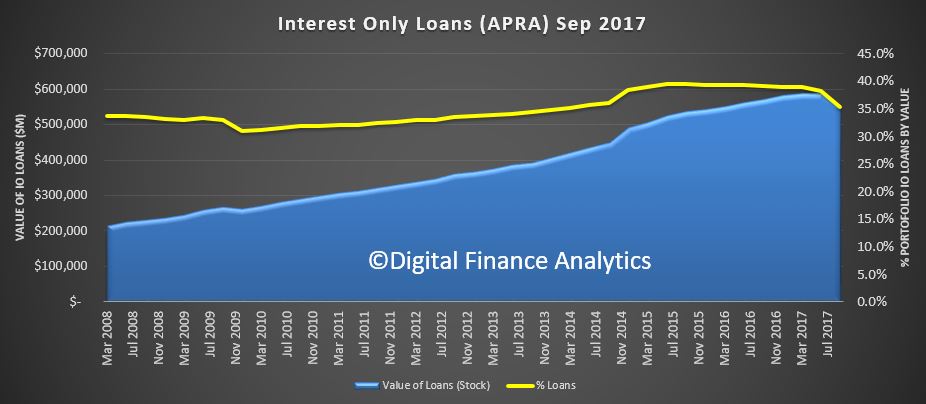
Today we discuss which post codes will be most impacted by the interest only mortgage loan reset issue, and update our estimates of the number and value of loans likely to be impacted. This received media coverage in the AFR and the Australian over the weekend.
The value of IO loans in Sept 2017 was $549 billion, down from a peak of $587 billion in March 2017. The number of loans outstanding was 1.56 million loans, down from a peak of 1.69 million loans in December 2016.
Lenders are now required to make a more detailed assessment of a borrower when the loan comes up for periodic review, typically after 5, or in some cases 10 years. Some of the changes we are seeing are:
rental income cut to 80% of flows, to allow for vacancy periods
borrowers must have a stated concrete plan to repay the capital element of the loan (vague “from property sale”, probably wont be sufficient, especially given current home price movements).
overall borrower income and serviceability to be assessed
loans to be assessed as if they were a principal and interest loan
In addition, loans must be “suitable” taking into account the overall financial footprint and objectives of the borrowers (and this must be documented in case of later action). Otherwise the loan could be voided.
If an interest only loan comes up for review, and it fails to be renewed because it falls outside current assessments, borrowers have limited choices.
They may shop around for an alternative lender. Most banks are following the same regulatory guidelines (though there are some differences as to how the rules are being applied). Non-banks are less restricted at the moment (but watch this space..).
They may move to a principal and interest loan, which could double the monthly repayments. Bearing in mind half of investment properties are under water on a net rental basis, this means finding funds from other sources. If multiple properties and loans are involved, this could be a cascading problem
Arrange to sell the property. We are already seeing some forced sales, especially in Sydney and Melbourne. More will follow.
Recent UBS research suggested that some borrowers are not aware they have an IO loan, so might get a very nasty surprise when then bank contacts them!
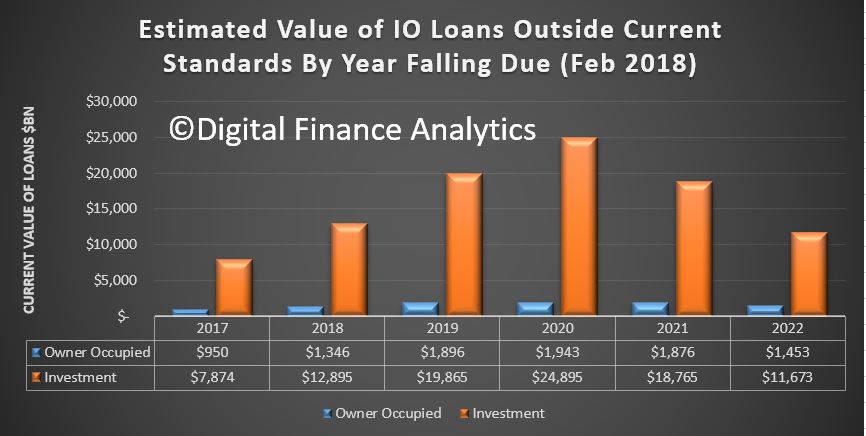
Using data from our household surveys to end February we re-ran our analysis of IO loans which will fall outside serviceability currently. We had previously estimated $60 billion were exposed, but this has now risen, first because we extended the analysis by a year, and second because we updated the lending standards which have become tighter in recent weeks. It is now a $100 billion problem on a $550 billion loan book. More than 220,000 households will be caught over the next few years.
Here is the state breakout.
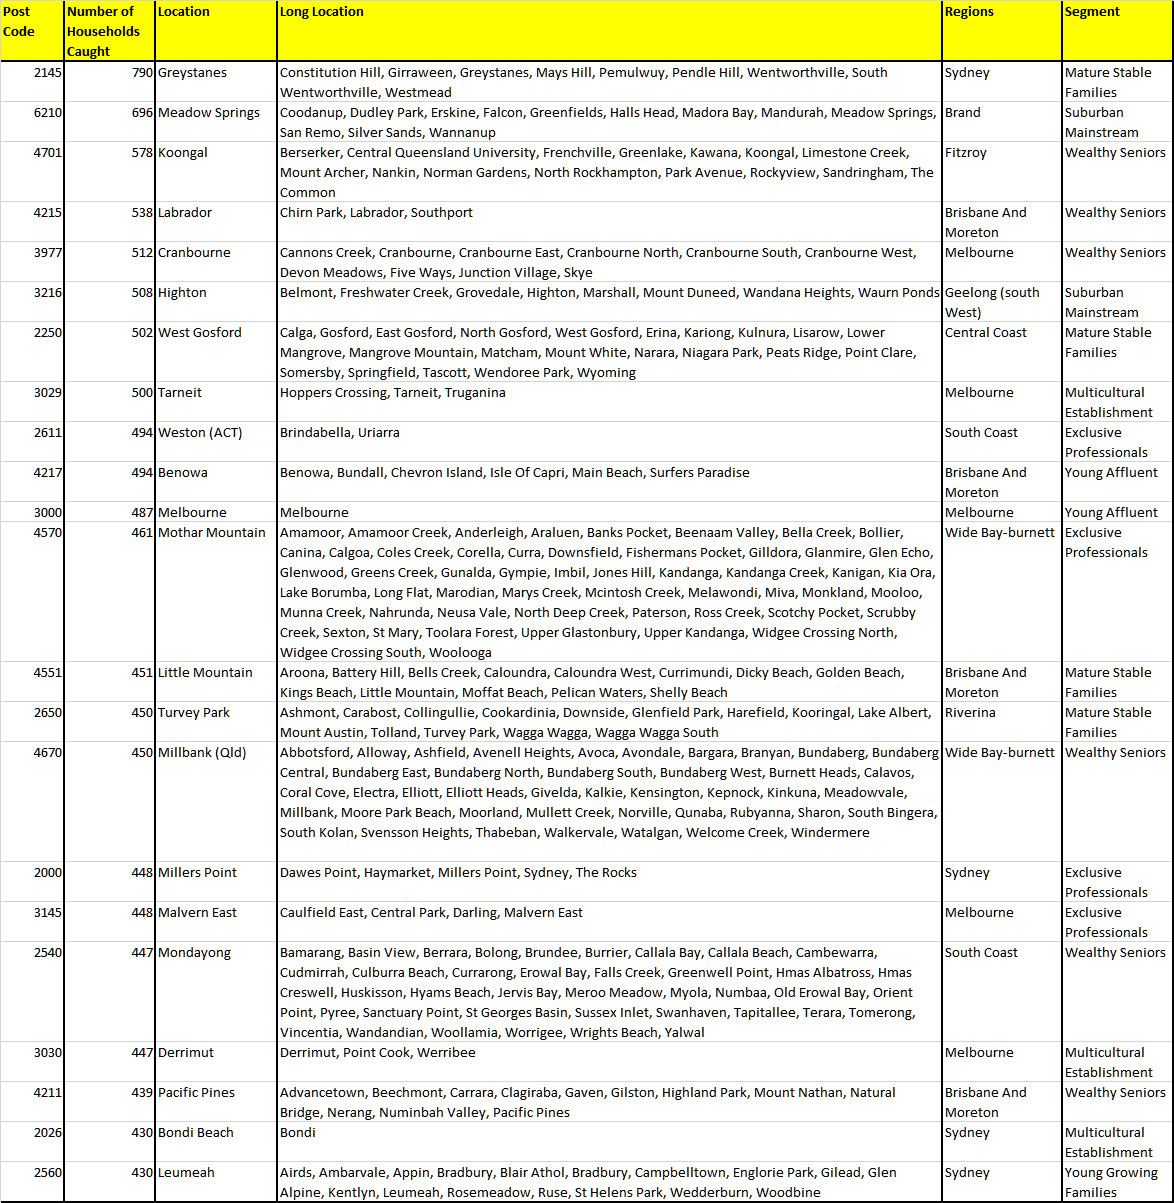
We can then identify the post code where the borrowers are residing. This may of course be different from where the investment properties are located. Here is the list of top post codes impacted. Click to view the larger version. Note the household segments which are impacted are predominately more affluent ones!
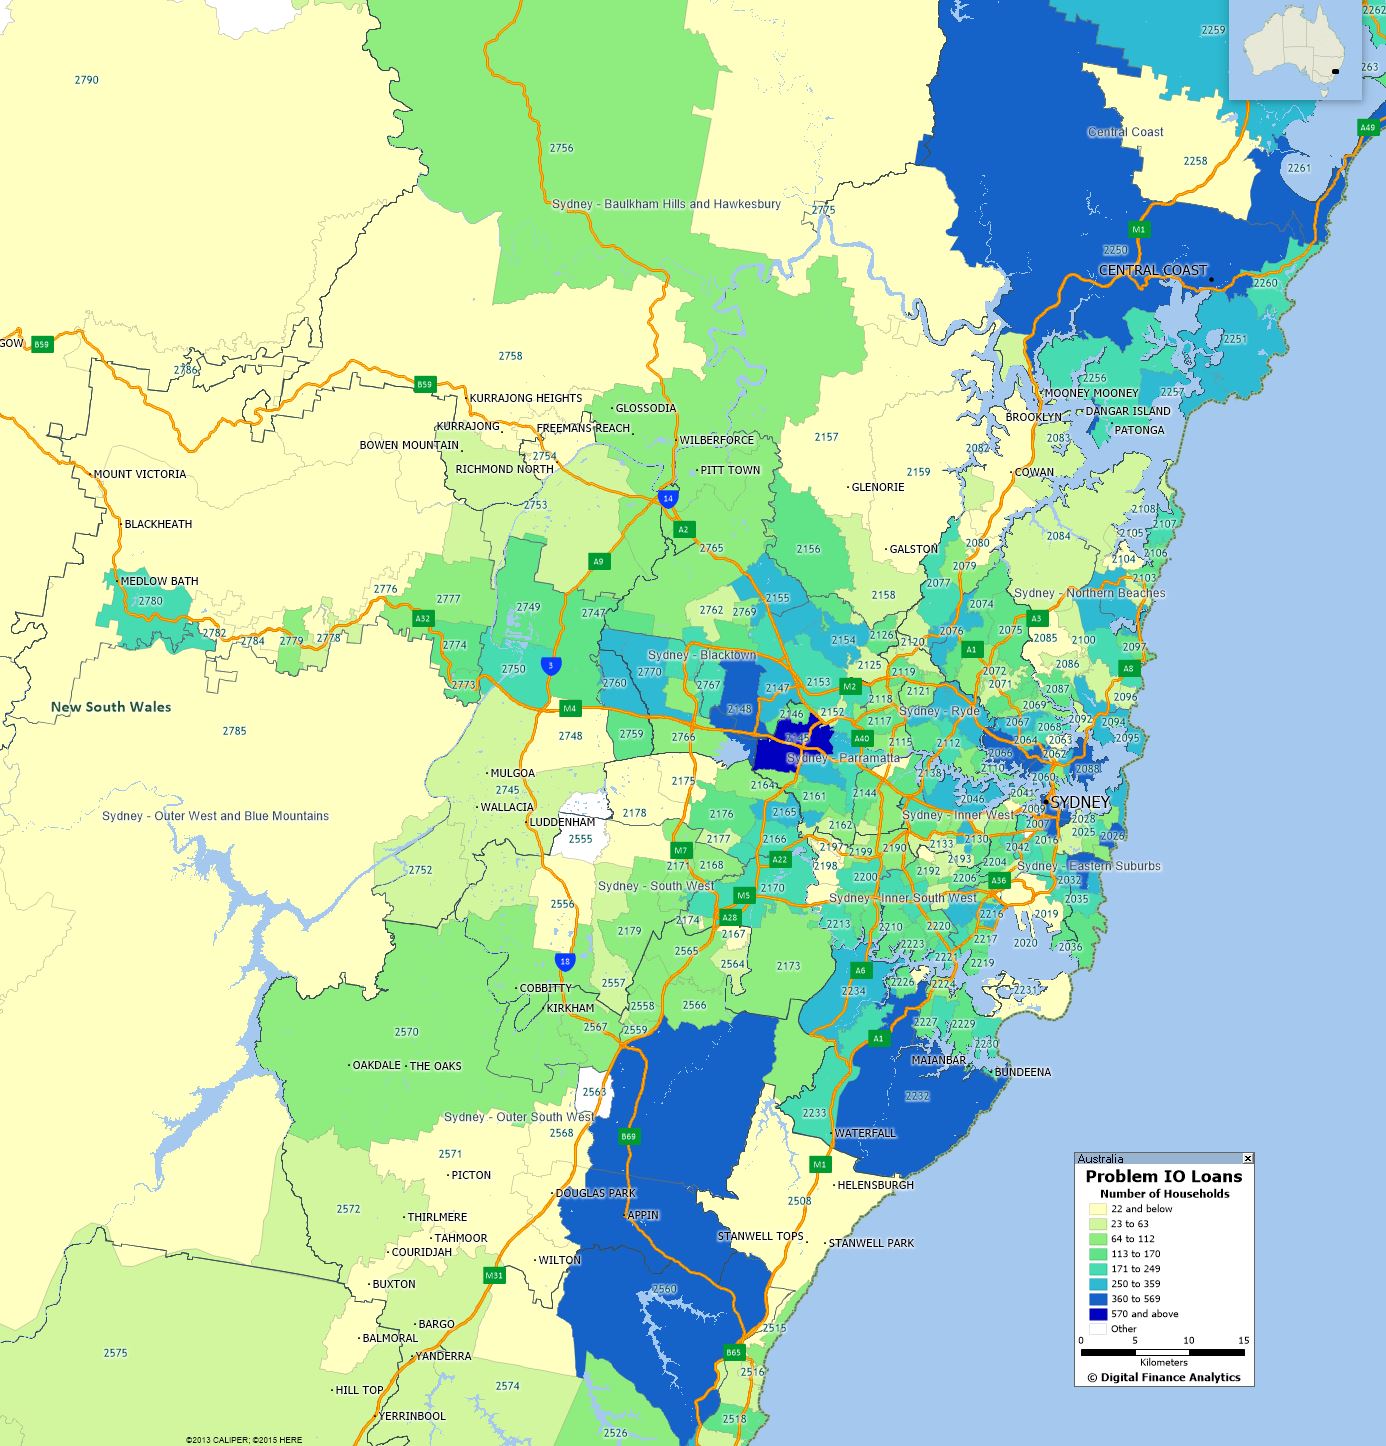
Finally, to get the juices flowing here is the geo-mapping for Greater Sydney. We will share other locations in subsequent posts. Again you can click on the map to view a larger version.
This is a significant issue, and mirrors the US in 2005 onwards as loans were reset to higher rates, lifting repayments. But the difference in Australia is that the households most impacted appear to be more affluent. In theory, therefore they may be able to rearrange their finances, but investors of course have the freedom to exit the market. Expect more forced sales in the months ahead, with consequential downward pressure on home prices as a result.
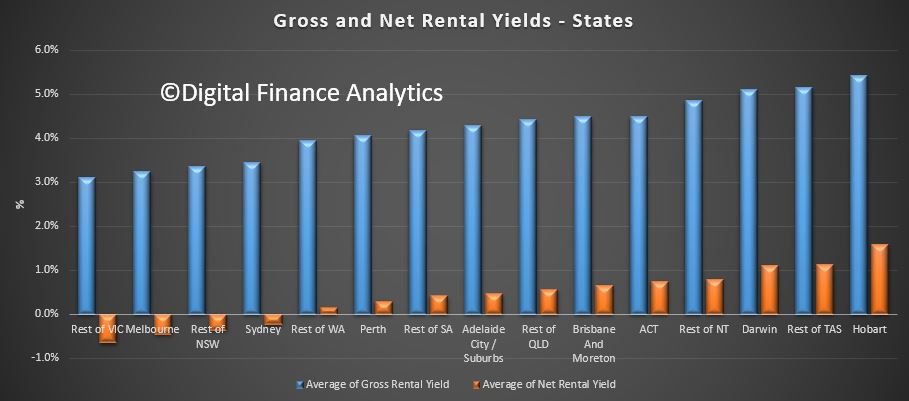
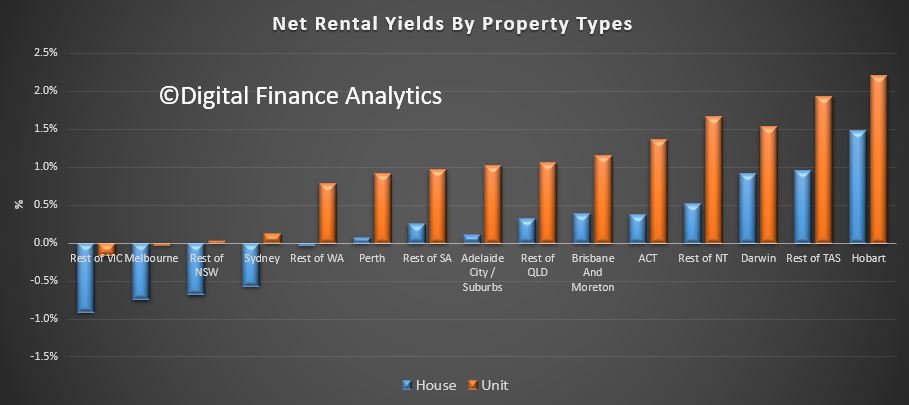
We track gross and net rental yields on investment properties via our household surveys. Gross yield is the actual rental stream to property value, net rental is rental payments less the costs of funding the mortgage, management fees and other expenses. This is calculated before any tax offsets or rebates. The latest results were featured in an AFR article today.
The results are pretty stark, and shows that many property investors are underwater in cash flow terms – not good when capital values are also sliding in some places.
This shows the gross and net rental returns by states – Hobart and Darwin are the winners, Melbourne, and the rest of Victoria, then Sydney and the rest of NSW the loosers.
The returns vary between units and houses, with units doing somewhat better.
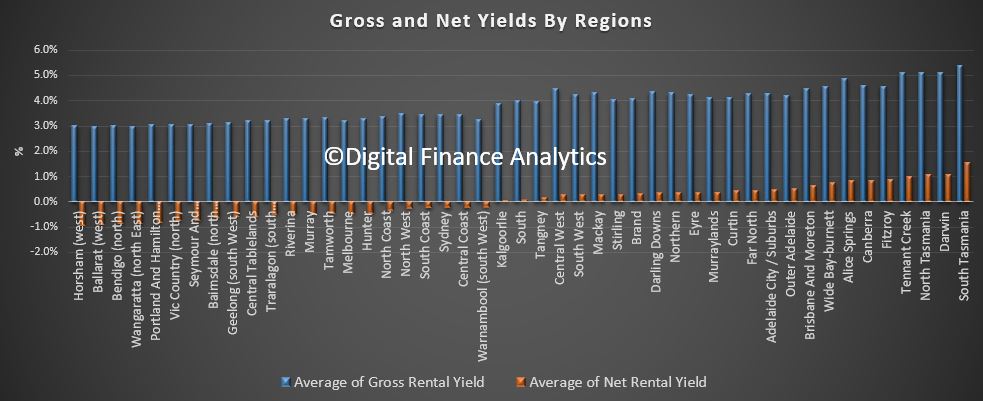
Here is a view by regions.
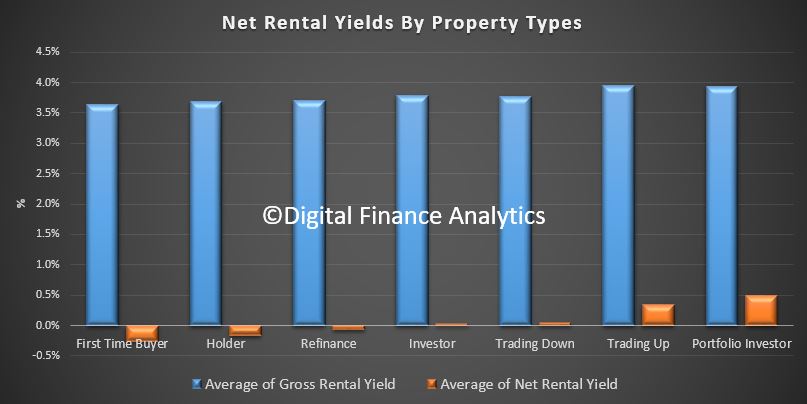
We find that portfolio property investors (those with multiple investment properties) are doing the best, whilst new investor buyers are doing the worse, not least because they have larger mortgages to service, and interest rates are higher, and no capital growth.
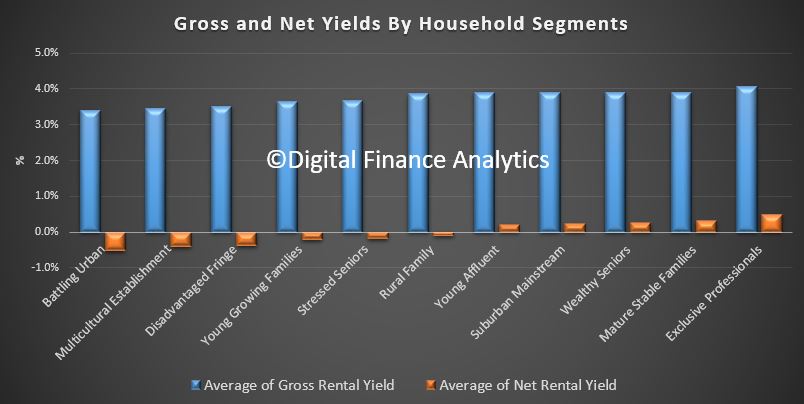
Finally, here is the killer slide. More affluent households are doing significantly better in terms of net rental returns, compared with those in more financially pressured household groups. Batting Urban households, those who live in the urban fringe on the edge of our cities are doing the worst. This is explained by the types of properties people are buying, and their ability to select the right proposition. Running an investment property well takes skill and experience, especially in the current rising interest rate and low capital growth environment. Another reason why prospective property investors need to be careful just now.
After the ME Bank Survey, and our Household Finance Confidence Index both showed the financial pain many households are in; now National Australia Bank’s (NAB) latest Consumer Behaviour Survey, shows the degree of anxiety being caused by not only cost of living pressures but also health, job security, retirement funding as well as Australian politics.
Of all the things bothering Australian households in early 2018, nothing surpasses cost of living pressures.
Source: NAB
From the National Australia Bank’s (NAB) latest Consumer Behaviour Survey, it shows the degree of anxiety being caused by not only cost of living pressures but also health, job security, retirement funding as well as Australian politics.
The higher the reading, the more anxious it is making Australians.
Somewhat surprisingly, it was not the gaggle in Canberra that caused the most anxiety for households in the latest survey, but rather persistent concerns surrounding living expenses.
“[The index] was basically unchanged in Q4 2017 at near survey lows with job security causing Australians the least stress, consistent with a strongly improving labour market,” said Alan Oster, NAB Group Chief Economist.
“That said, the cost of living is still weighing most heavily on them, highlighting the disconnect between low levels of economy-wide inflation and consumer focused costs.”
That was reflected in the detail of the latest survey, revealing some alarming statistics as to just how many Australians are struggling at present.
It found around two in five Australians suffered some form of financial hardship over the survey period, especially among lower-income earners.
Over 50% of low income earners reported some form of hardship, with almost one in two 18 to 49-year-olds being effected.
As seen in the chart below, after a steady improvement in late 2016 and early 2017, those reporting financial hardship have increased in recent quarters, coinciding with steep increases in gas and electricity charges for many Australian households.
Source: NAB
“Being unable to pay a bill was the most common cause,” the NAB said, adding this came in at over 20%.
“Not having enough for food and basic necessities was next, impacting one in three low income earners.”
Some 18% of respondents reported not having enough for food and basic necessities in the latest survey.
Source: NAB
Nearly half of those consumers also reported they were “extremely” concerned about their current financial position, nominating paying their utility bills as the biggest impact on their financial position.
Source: NAB
“While consumers told us they were a little less concerned about their household’s current financial position in Q4, being unable to pay a bill — particularly utilities — continues to have by far the biggest impact on those households most concerned about their finances,” Oster said.
With cost of living pressures still creating anxiety among households, the NAB asked respondents how much extra income they would need to alleviate those concerns.
In short, a lot, especially for those in the big capital cities and households with children.
“On average, consumers told us they need an extra $207 a week – or $10,764 per year,” Oster said, adding that “this varied according to where we live, our income, gender and family status”.
“It ranged from $221 in New South Wales and the ACT to $132 in Tasmania, and from $214 in capital cities to $186 in rural areas.
“Consumers with children need $258 and those without $191”.
Source: NAB
While Oster admits that how consumers “feel” doesn’t necessarily correlate with how they really spend, it underlines the point that many Australians think they’re getting squeezed financially.
If it wasn’t already apparent, this likely ensure the next federal election campaign will be centred around alleviating the perceived cost of living pressures facing many Australian households.


 Source: Roy Morgan Single Source (Australia). 6 months to January 2018, n= 6,052 Base: Australians 14+ with home loan. 1. Based on largest number of home loans purchased at a branch. 2. Excludes other methods of obtaining home loans. 3. Includes brands not shown.