Bendigo Changes Homesafe Income Accounting

Bendigo Bank announced they have made a change to the treatment of Homesafe for cash earnings purposes to exclude any unrealised income or losses and associated funding costs. This will not change the statutory earnings report, when the full year results on released on 14th August.

Realised earnings from completed contracts will still be included, but the mark-to-market element will now be excluded. Interesting timing given the fact that home price growth looks to be stalling! This will probably reduce the volatility of earning going forward. But Bendigo had a 6% long run home price growth assumption.

The net effect will be a reduction in cash earnings.  This change will remove any unrealised income or losses from cash earnings for the years ended 30 June 2016 and 30 June 2017 and future years’ results.


Suncorp 3Q17 Update – Tough Times

Suncorp Bank today provided its quarterly update on Bank assets, credit quality and capital as at 31 March 2017, as required under Australian Prudential Standard 330.

The home lending portfolio grew modestly over the quarter, reflecting challenging market conditions.

Suncorp Banking and Wealth CEO David Carter said the Bank continued to focus on targeted segments of the market, prioritising risk selection and quality, and was well positioned in its standing relative to regulatory changes.

“We responded early to signals by the regulators to improve our position in relation to changes to macro-prudential settings, particularly APRA’s interest-only and investor lending,” Mr Carter said.

“We have been deliberate in shaping the portfolio through our focus on risk selection and expect modest growth in home and business lending as our competitors align to more conservative positions.”

Business lending growth was flat, with strong new business volumes offset by repayments from successfully completed property developments and favourable conditions for agribusiness customers leading to repayment of loans.

Credit quality across Suncorp Bank’s business loan portfolio remains sound, with very little exposure to the higher risk lending segments of inner-city apartments and businesses affected by the resources industry slowdown.

The benefits of prudent risk management are reflected in the continued strong credit quality performance over the quarter, with impairment losses of $7 million, or 5 basis points of gross loans and advances (annualised).

The Bank’s funding strength was demonstrated during the quarter through the successful pricing of a $1.25 billion Residential Mortgage-Backed Security (RMBS) and an increase in the Net Stable Funding Ratio (NSFR) position, closing at 109%.

Following the payment of the interim FY17 dividend to Suncorp Group Limited, the Bank’s Common Equity Tier 1 (CET 1) ratio continues to be strong at 9.19% and remains above the target range of 8.5% to 9.0%.
Suncorp is also in the process of determining the impacts on the business, following several announcements in the Federal Budget impacting the financial services sector.

“Australia has a strong banking system and Suncorp supports the principles of the Financial Services Inquiry to achieve competitive neutrality,” Mr Carter said.

“The Treasurer announced two measures that have the potential to support competitive neutrality – the Bank levy and the harmonisation of supervision of the ADI and non-ADI sector.

“These measures have the potential to further improve the effectiveness of the macro prudential settings that have recently been introduced and will go some way to realising a more level playing field.”

Mortgage Choice delivers continued record growth throughout Q3

Following record interim financial results, Mortgage Choice has continued its positive momentum throughout Q3.

In the six months to 31 December 2016, Net Profit After Tax, home loan settlements, loan book and financial planning revenue all grew to record levels.

Throughout Q3 the momentum has continued, with strong growth in mortgage broking and very impressive growth in financial planning.

“Over the third quarter we saw an 8% lift in group office home loan enquiries, setting a new record for the company,” Mortgage Choice chief executive officer John Flavell said.

“This lift in home loan enquiries has resulted in a 6% increase in home loan applications and a 4% increase in home loan approvals, compared to Q3 FY16. Mortgage Choice’s home loan approval result in March was a new record.

“Throughout Q3 FY17, the financial planning division has gone from strength to strength, with the value of Funds Under Advice and Premiums Inforce surging 59% and 30% respectively in comparison to Q3 FY16.

“Our network of mortgage brokers understands the value of providing their customers with access to professional financial advice. As a result, a larger proportion of our customers’ wealth needs are now being met.”

Mr Flavell attributed the continued growth in financial planning revenue and the ongoing strength of the underlying core broking business to two main factors.

“As a group we have delivered continuous productivity gains as well as network growth,” he said.

“To the end of Q3, franchise numbers have grown by 5%, while loan writer and adviser numbers have also continued to increase.

“These strong outcomes have come off the back of the effective execution of a very solid strategy.”

AMP Q1 17 Update

AMP Limited today reported cashflows and assets under management (AUM) for the first quarter to 31 March 2017 and provided an update on its Australian wealth protection business.

  • Q1 17 Australian wealth management inflows increased 11 per cent from Q1 16 to A$6.4 billion. This was offset by a 19 per cent increase in outflows resulting in net cash outflows of A$199 million.
  • Outflows primarily driven by increased consolidation activity across the superannuation sector and as customers transitioned to MySuper.
  • Net cashflows on AMP retail platforms were A$188 million in Q1 17. North continues to perform well, with net cashflows up 27 per cent from Q1 16.
  • AMP Capital net external cashflows of A$228 million driven by strong cashflows from China Life AMP Asset Management.
  • AMP Bank’s mortgage book grew by 5 per cent over the quarter.
  • Positive Q1 17 Australian wealth protection claims and lapse experience, with the business performing in line with revised assumptions.
  • Cashflows strong since beginning of Q2 with wealth management net cashflows now positive year to date.

AMP Chief Executive Craig Meller said:

“Q1 17 cashflows reflect an extraordinarily high level of activity across Australia’s superannuation industry as customers transitioned to MySuper prior to 1 July 2017, consolidate their funds and allocate more investments to SMSFs, amid a changing regulatory environment. As a result, both Australian wealth management cash inflows and outflows were higher.

“Cashflows into North increased, reflecting our continued investment in the market leading platform. AMP’s SMSF business, SuperConcepts, also increased its assets under administration as it builds on its market-leading position.

“Wealth management cashflows have been strong since the beginning of Q2 as we near the 1 July 2017 effective date for superannuation contribution changes and from the transition of a large corporate super mandate to AMP. Final MySuper transitions were completed in April and net cashflows in wealth management are positive for the year to date.
“Q1 claims and lapse experience in Australian wealth protection indicate that the measures we’ve taken to stabilise the performance of the business are working.”

CBA Q317 Trading Update

CBA released their unaudited trading update. Cash earnings were $2.4 billion in the quarter, and statutory net profit was $2.6 billion.

They say net interest income grew (pcp) supported by volume growth in key markets, offsetting margin pressures, but Group Net Interest Margin fell slightly in the quarter due to higher average liquids and competition effects. All the majors have therefore reported a NIM squeeze in this reporting round.

In home lending, growth continued to be underpinned by strong proprietary channel performance but defaults were higher, especially in WA.

Business lending growth overall remained subdued, with strongest growth in Business and Private Banking.

In Wealth Management, Average Assets Under Management and Funds Under Administration rose by 6% and 7% respectively, reflecting stronger investment markets, partly offset by exchange rate movements.

In ASB, volume growth remained strong, with lending up 10% and deposits up 8% (12 months to Mar 17).

Other Banking Income was stable with higher commissions and lending fees offset by lower trading income.

Insurance income was impacted by weather events during the quarter, including Cyclone Debbie.

They continue cost discipline enabling ongoing investment.

Loan Impairment Expense (LIE) was $202 million in the quarter and equated to 11 basis points of Gross Loans and Acceptances, compared to 17 basis points in 1H17.

Corporate LIE was substantially lower in the quarter. Troublesome and impaired assets were slightly lower at$6.7 billion, with broadly stable outcomes across most sectors. Apartment development exposures (Domestic residential apartment developments >$20m) reduced in the quarter.

Consumer arrears increased in line with seasonal expectations and continued to be elevated in Western Australia. In the home lending portfolio, investment lending reduced as a proportion of total new lending in the quarter and they say new interest only lending is being closely managed, consistent with regulatory guidance.

Prudent levels of provisioning were maintained, with Total Provisions at $3.7 billion and no change to overlays for economic conditions.

Funding and liquidity positions remained strong, with customer deposit funding at 67% and the average tenor of the wholesale funding portfolio at 4.2 years.

Liquid assets totalled $143 billion with the Liquidity Coverage Ratio (LCR) standing at 124%. The Group issued $14.6 billion of long term funding in the quarter, and $37 billion year to date.

The Group’s Basel III Common Equity Tier 1 (CET1) APRA ratio was 9.6% as at 31 March 2017. After allowing for the impact of the 2017 interim dividend (which included the issuance of shares in respect of the Dividend Reinvestment Plan), the CET1 (APRA) ratio increased by 37 basis points in the quarter. This was primarily driven by capital generated from earnings, and lower risk weighted assets, partially offset by the maturity of a further $1 billion of Colonial debt8. The Group’s Basel III Internationally Comparable CET1 ratio as at 31 March 2017 was 15.2%.

The Group’s Leverage Ratio was 4.9% on an APRA basis (unchanged from Dec 16) and 5.6% on an internationally comparable basis.

Westpac 1H17 Result Good, In Parts

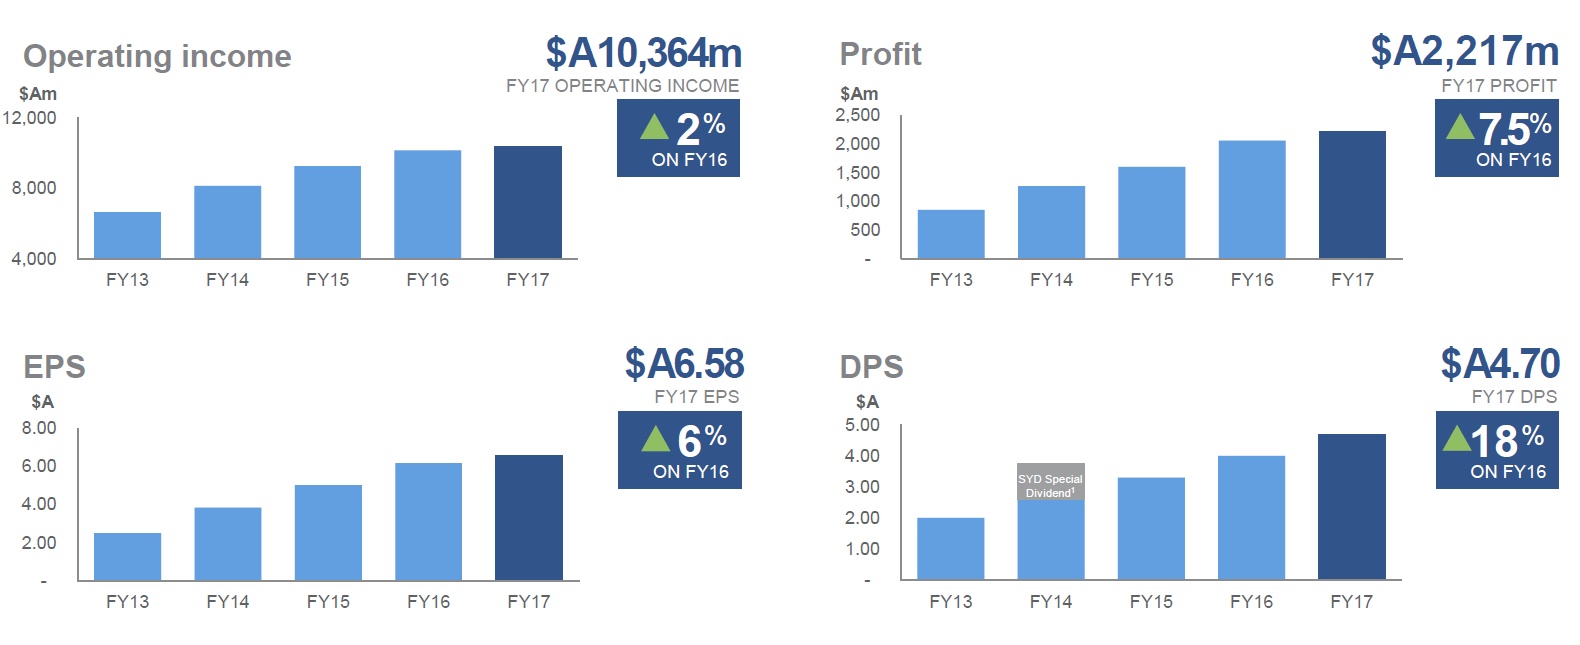
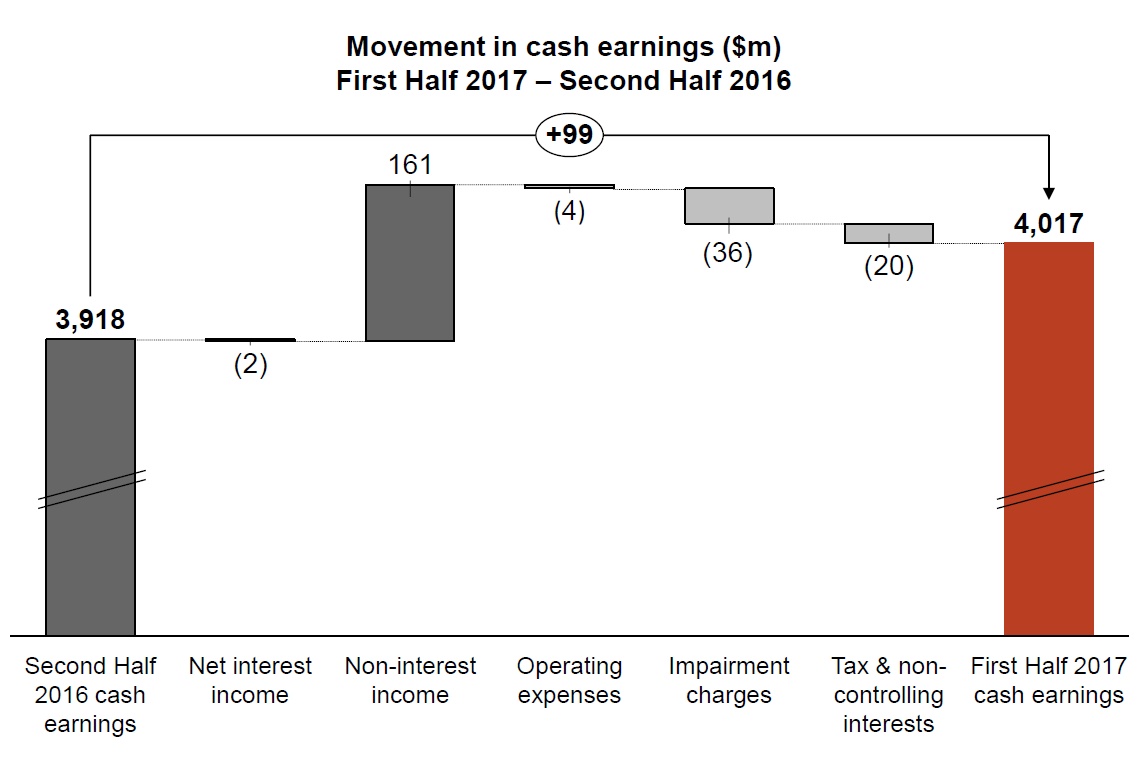
Westpac has declared a 1H17 Statutory net profit of $3,907 million, up 6% compared with 1H16, with Cash earnings $4,017 million, up 3%.

Most of the increase in net operating income was due to a higher Institutional Bank contribution from participation in a number of significant customer transactions and from stronger markets income.   This strong markets result relies on non-customer trading, and may be hard to replicate. They were impacted by higher insurance claims mostly associated with Cyclone Debbie, and higher delinquencies with a $44 million rise in impairment charges in the consumer book.

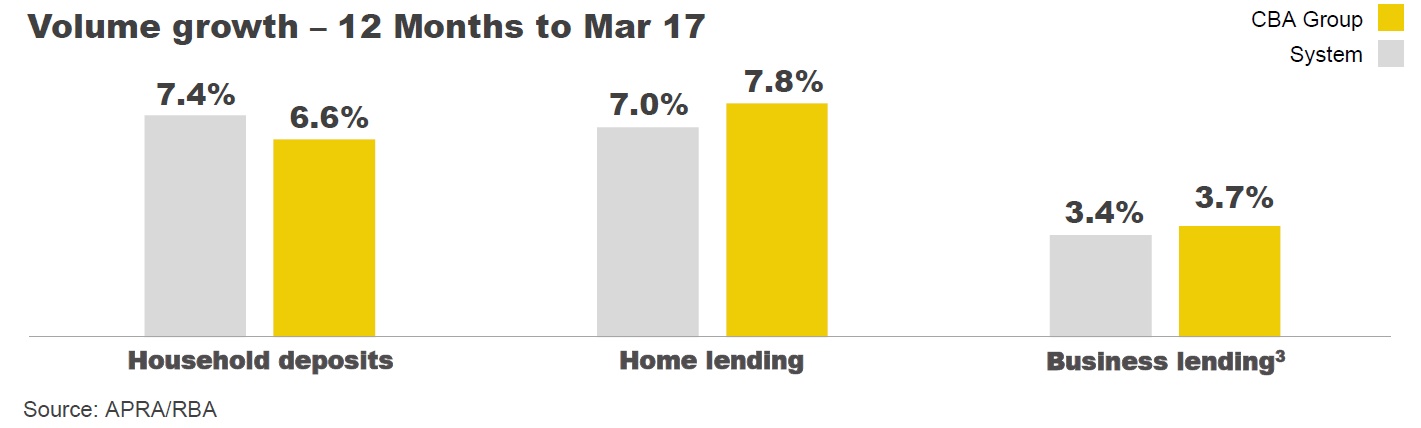
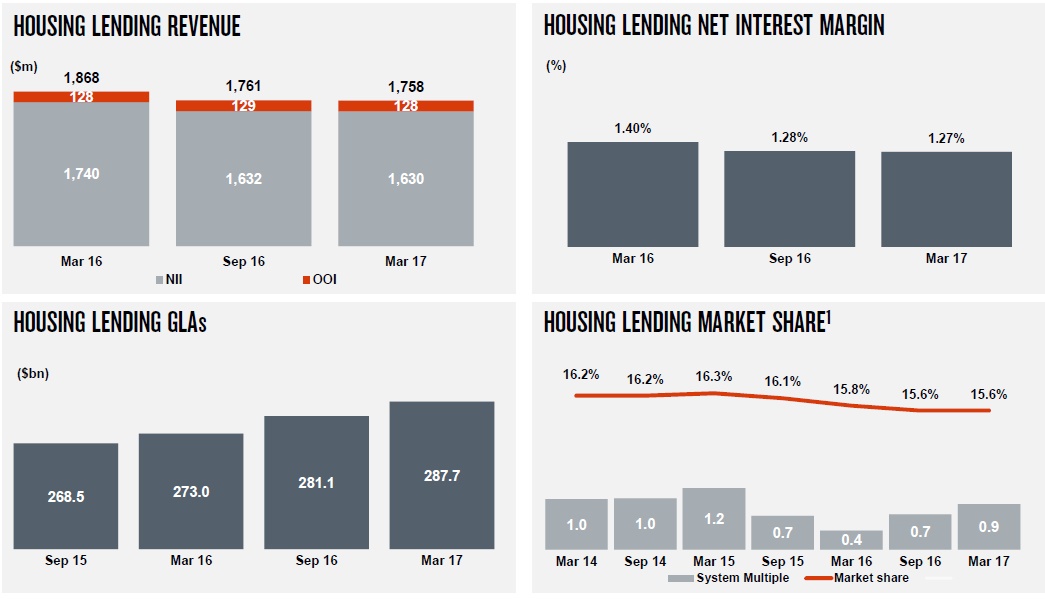
Net interest income increased $136 million or 2% compared to First Half 2016, with total loan growth of 4%, primarily from Australian housing which grew 6%.

However net interest margin is under pressure, and has declined 7 basis points over the past 12 months, of which 4 basis points was in 1H17. The consumer bank fell 6 basis points.  Loan repricing may help in the 2H17.

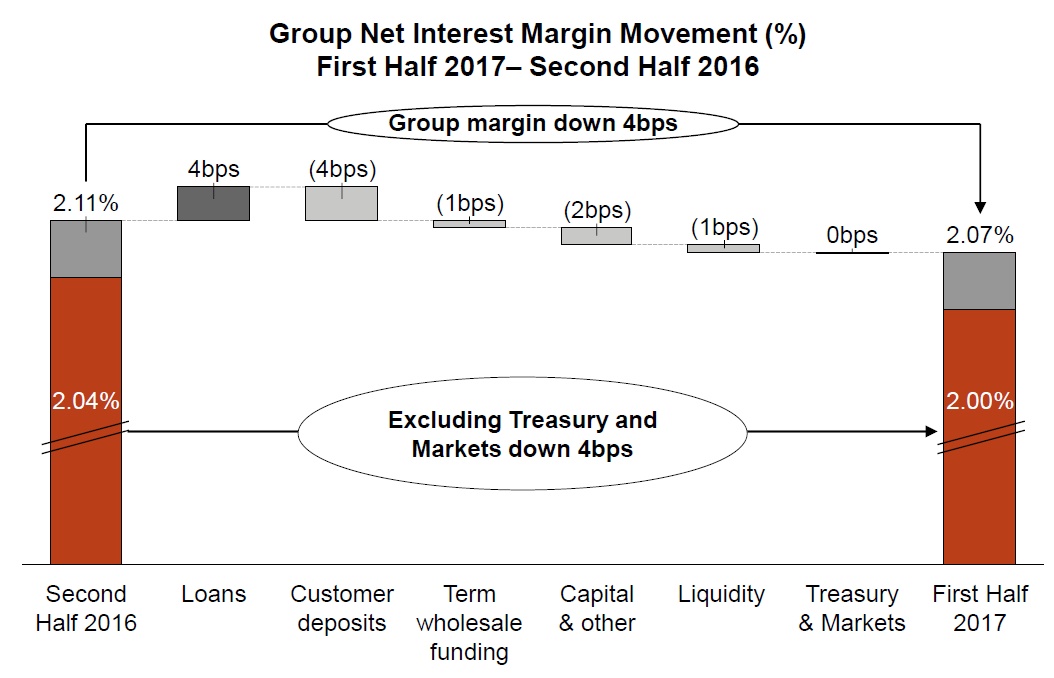
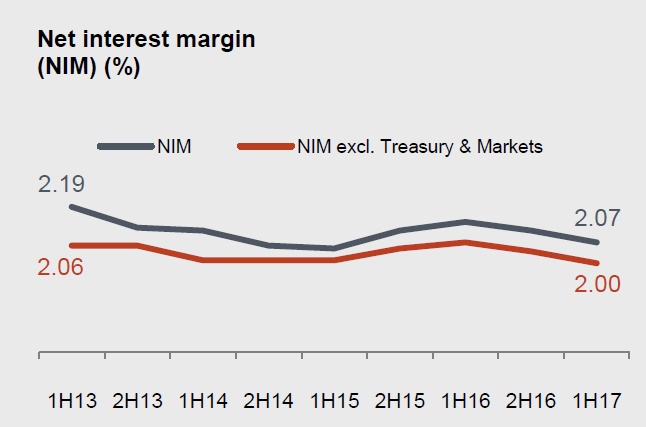
Group net interest margin was 2.07%, a decrease of 4 basis points from Second Half 2016. Key features included:

  • 4 basis point increase from loan spreads. This reflected loan repricing mostly in Australian mortgages, including repricing of interest-only and investor loans. These increases were partly offset by competition;
  • 4 basis point decrease from customer deposit spreads, driven by the full period impact of increased competition for term deposits in 2016 (3 basis points) and the continuing impact of lower interest rates on the hedging of transaction deposits;
  • 1 basis point decrease from term wholesale funding costs reflecting an increase in Additional Tier 1 and Tier 2 capital balances and the higher costs of these instruments;
  • Capital and other decreased 2 basis points primarily from the impact of lower interest rates; and
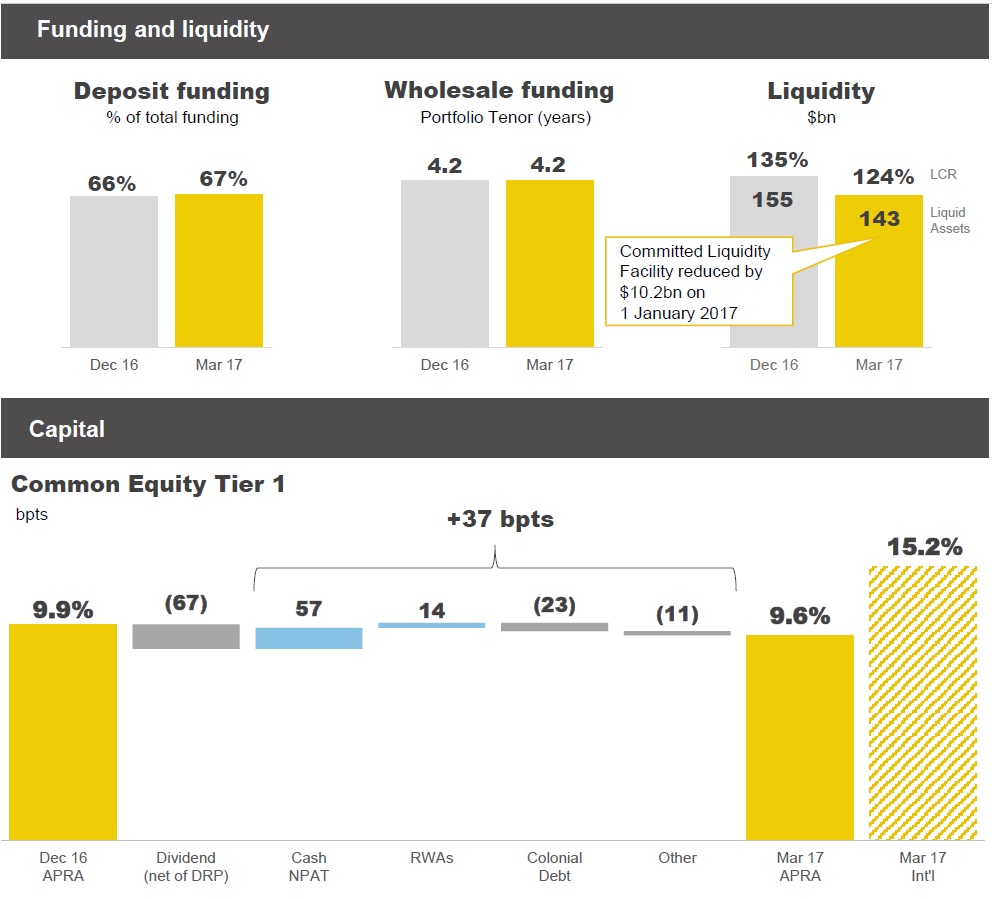
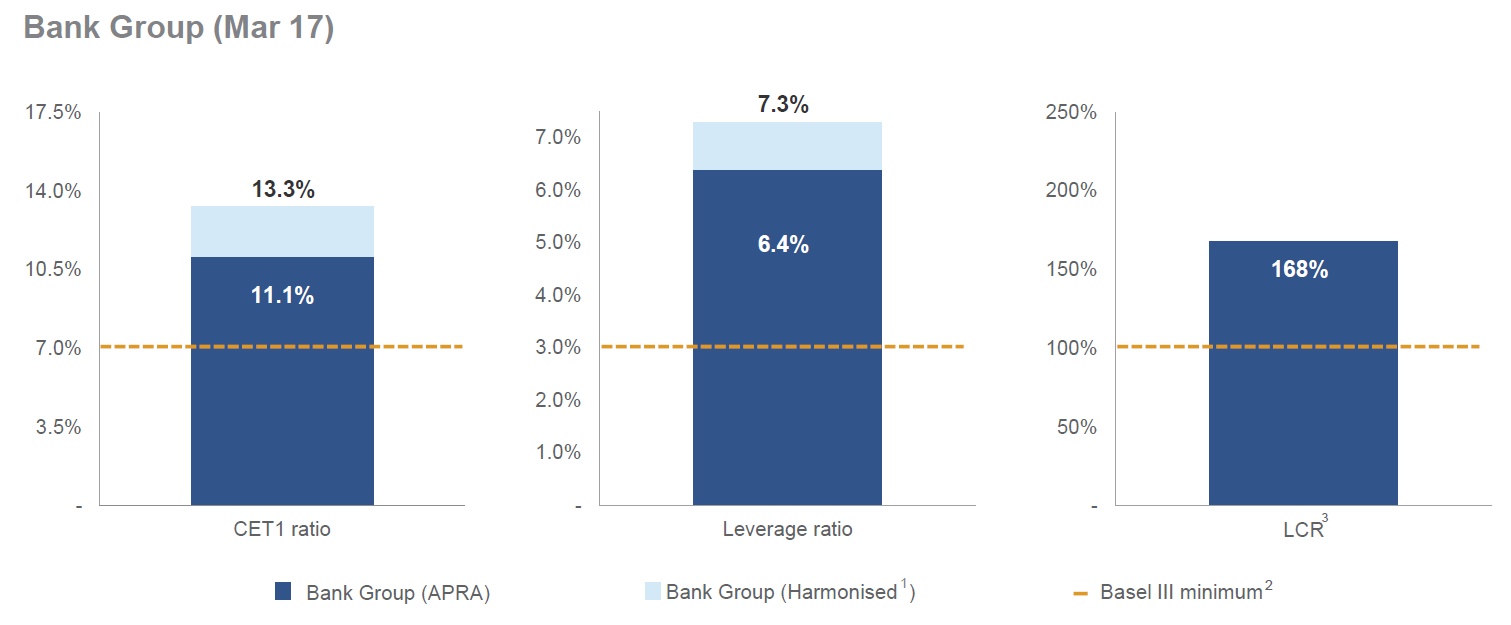
  • 1 basis point decrease from liquidity, reflecting the increased holdings of third party liquid assets to meet the LCR requirement. This was partly offset by a lower CLF fee following a $9.5 billion reduction to the CLF from 1 January 2017.

Cash earnings was per share 119.8 cents, up 1% and the cash return on equity (ROE) was 14%, at the upper end of 13-14% range.

Expenses are well controlled (up 1% over the year) and included a productivity saving of $118m with an expense ratio of 41.7%.

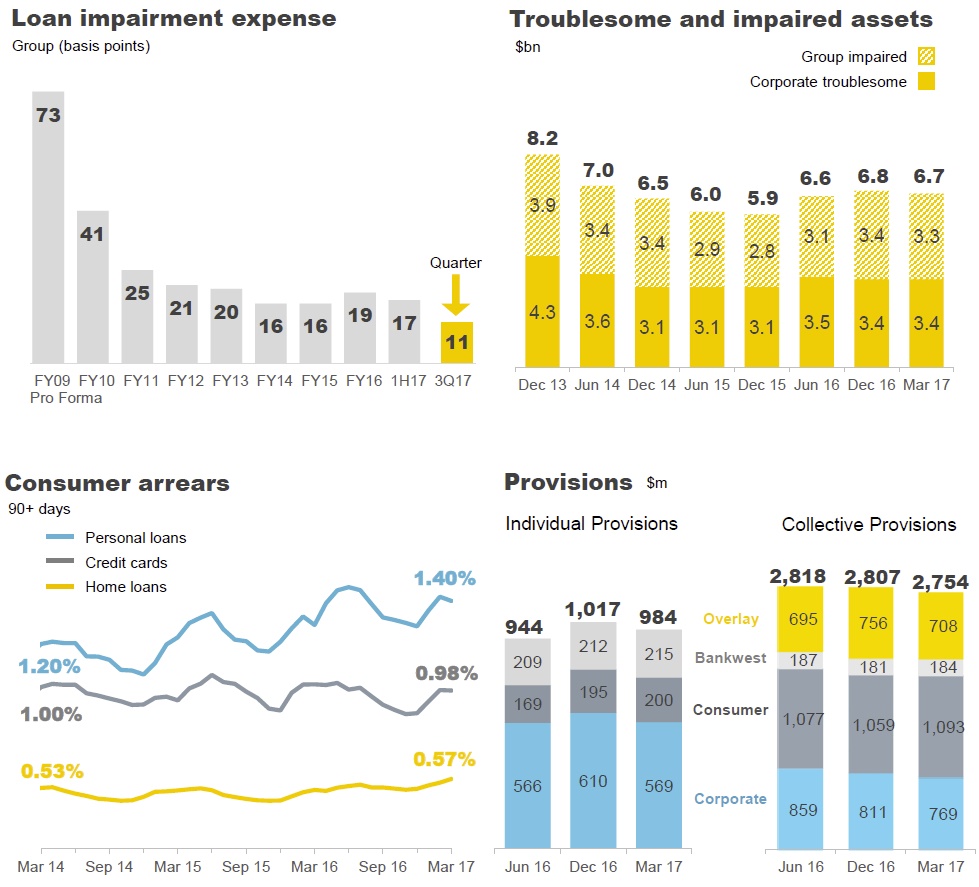
Impairments were down (15bps of loans) down 26% over year to $493 million as 1H16 included additional provisions for a small number of larger names. There were workouts of some larger facilities in the Institutional Bank and NZ.

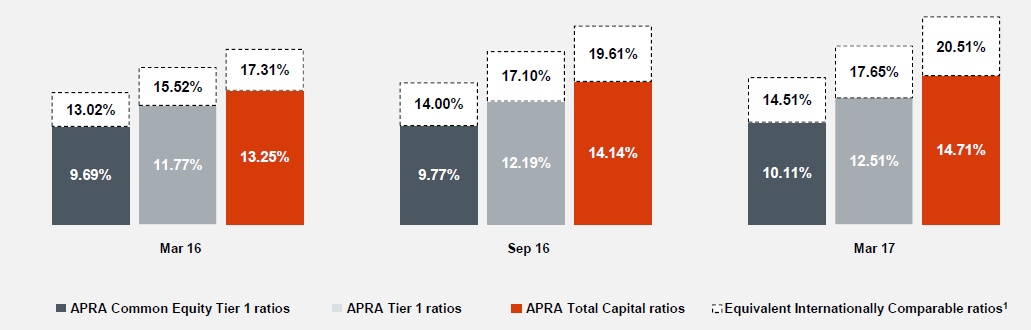
They further strengthened their Common equity Tier 1 capital ratio of 10.0%

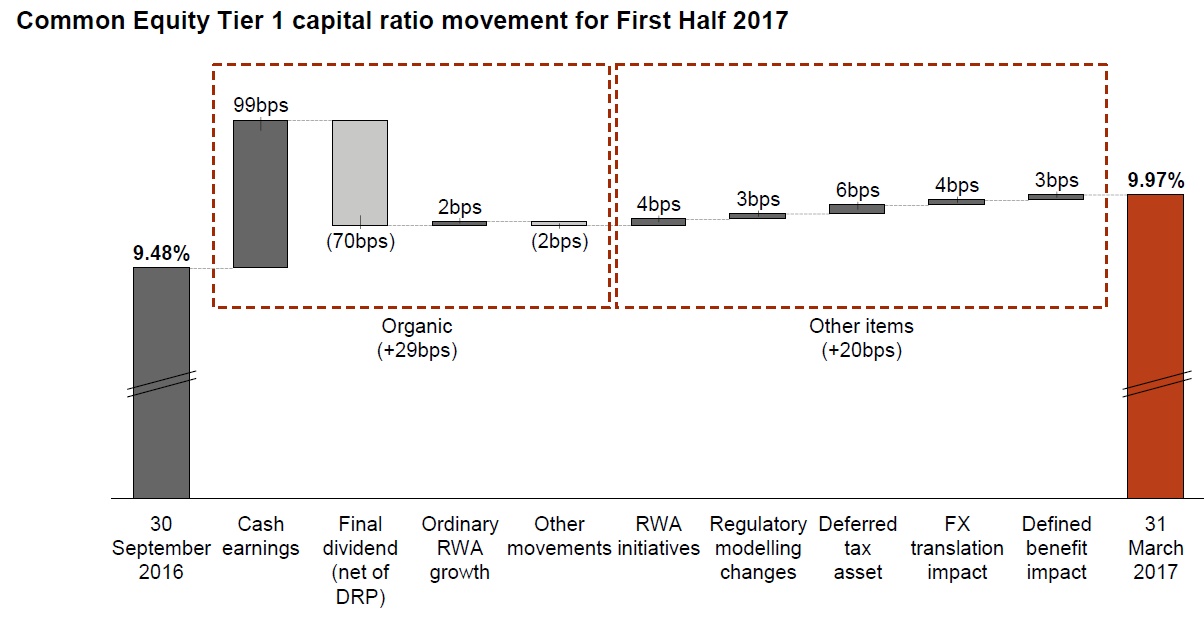
Organic capital generation of 29 basis points included:

  • First Half 2017 cash earnings of $4.0 billion (99 basis points increase);
  • The 2016 final dividend payment, net of DRP share issuance (70 basis points decrease);
  • Ordinary RWA was modestly lower (excluding FX movements, RWA initiatives and modelling changes), a 2 basis point increase; and
  • Other movements, decreased the CET1 capital ratio by 2 basis points.

Other items increased the CET1 capital ratio by 20 basis points:

  • RWA initiatives including management of unutilised limits reduced RWA by $1.6 billion (4 basis points increase);
  • Regulatory modelling changes (discussed further below) reduced RWA by $1.0 billion (3 basis points increase);
  • Reduction in the deferred tax asset (6 basis points increase);
  • The impact of foreign currency translation (4 basis points increase), mostly related to NZ$ lending; and
  • A decrease in the accounting obligation for the defined benefit pension plan primarily reflecting higher discount rates used to value defined benefit liabilities (3 basis points increase).

They announced a 94 cents per share interim, fully franked dividend, which is unchanged from last period.

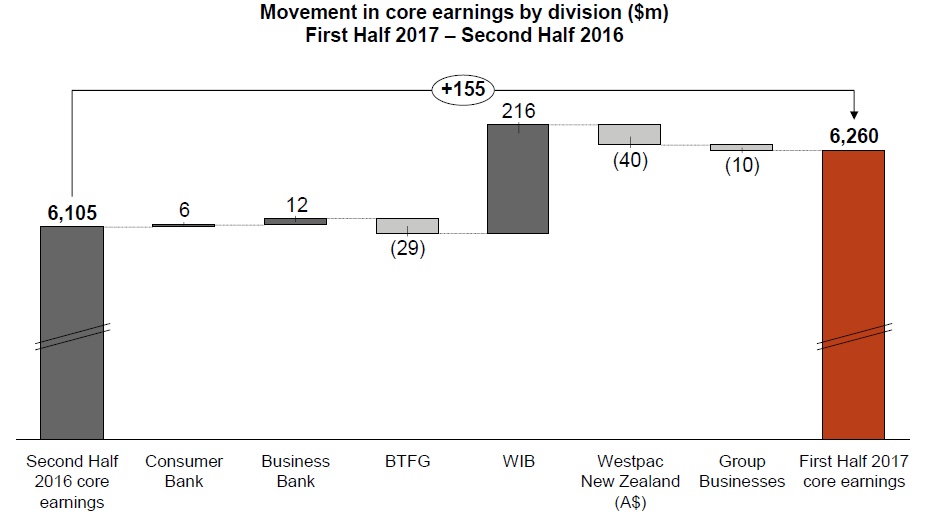
Looking at the divisional splits

Consumer Bank

Cash earnings of $1,511 million was 2% lower than Second Half 2016 with the decline primarily due to a $44 million rise in impairment charges. While asset quality remains sound, higher delinquencies – including from
changes in the reporting of facilities in hardship – led to the increase in impairment charges. Core earnings were relatively flat over the period (up $6 million) as were most of its components, with operating income up $2 million and expenses declining $4 million. The division recorded disciplined growth with mortgages rising 2% and other lending slightly lower.

Customer deposit growth was solid, up 3% supported by a 2% rise in customers and a focus on deepening relationships by growing transaction accounts. Balance sheet growth, however, was largely offset by a 6 basis point decline in net interest margin. The margin decline was mostly due to competition for lending and higher funding costs, particularly across term deposits. As a result of these movements, net interest income was up $12 million. Non-interest income was $10 million lower mostly from reduced cards related income.

Productivity continues to be a significant focus with costs broadly unchanged over the half and the expense to income ratio continuing to fall. A range of initiatives contributed to the improved efficiency including the further digitisation of manual processes such as: changing PINs online, enhancing the origination of personal loans, and improving access to key mobile banking transactions. Improving customers’ digital access contributed to a net reduction of 26 branches over the half.

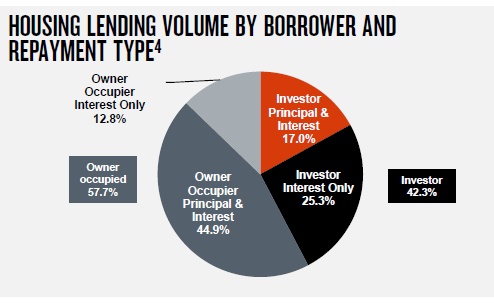
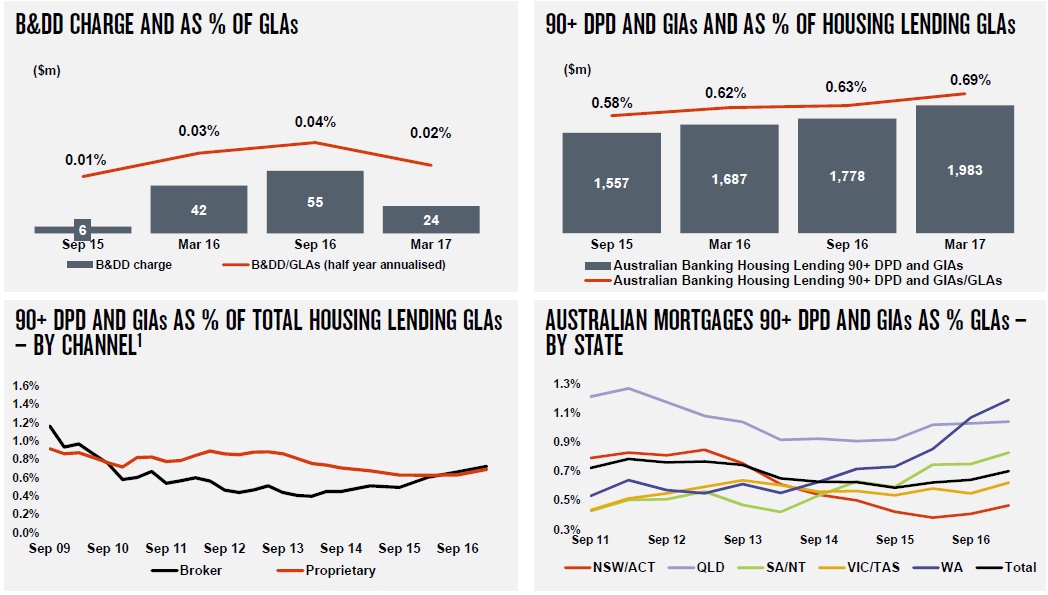
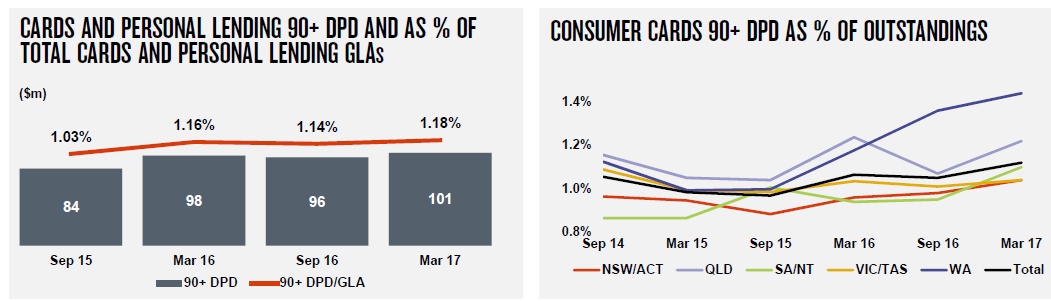
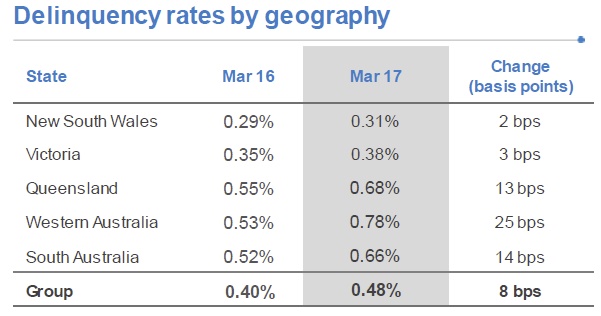
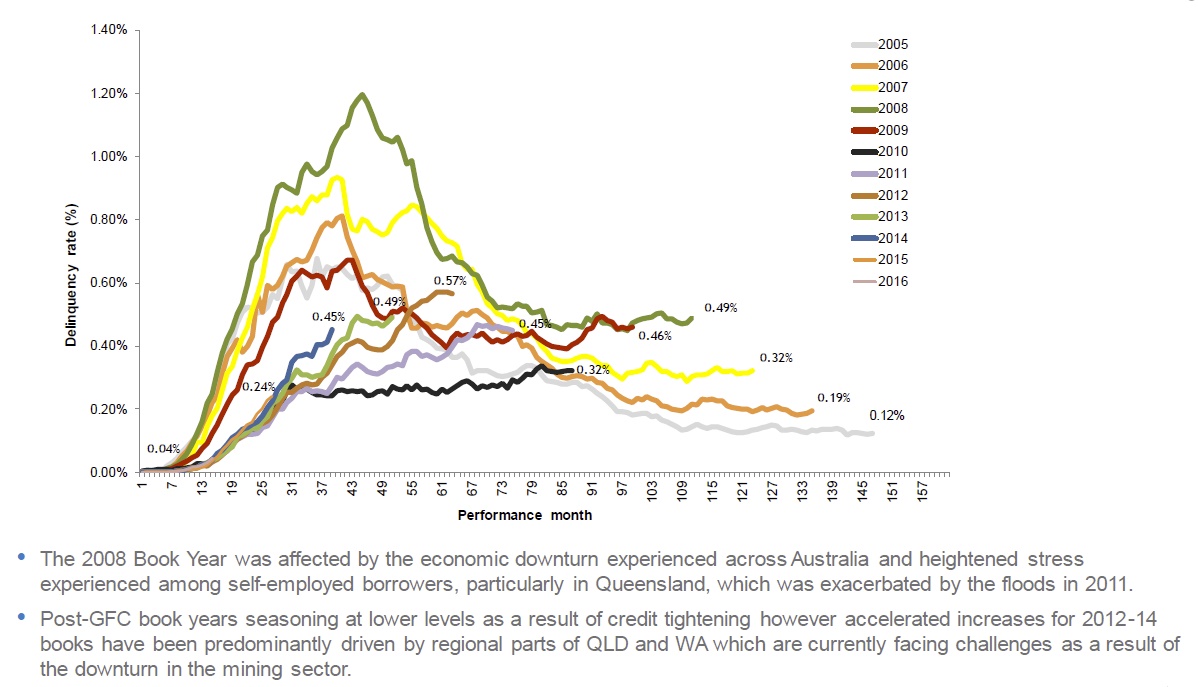
Australian mortgages accounts for 62% of group loans. They showed a 2 basis point rise in delinquencies, with a rise in WA. The number of consumer properties in possession rose from 261 in Sept 16 to 382 in Mar 17. Investment property 90+ day delinquencies rose from 38 basis points in Mar 16, to 47 basis points in Mar 17.  Loss rates remain at 2 basis points.

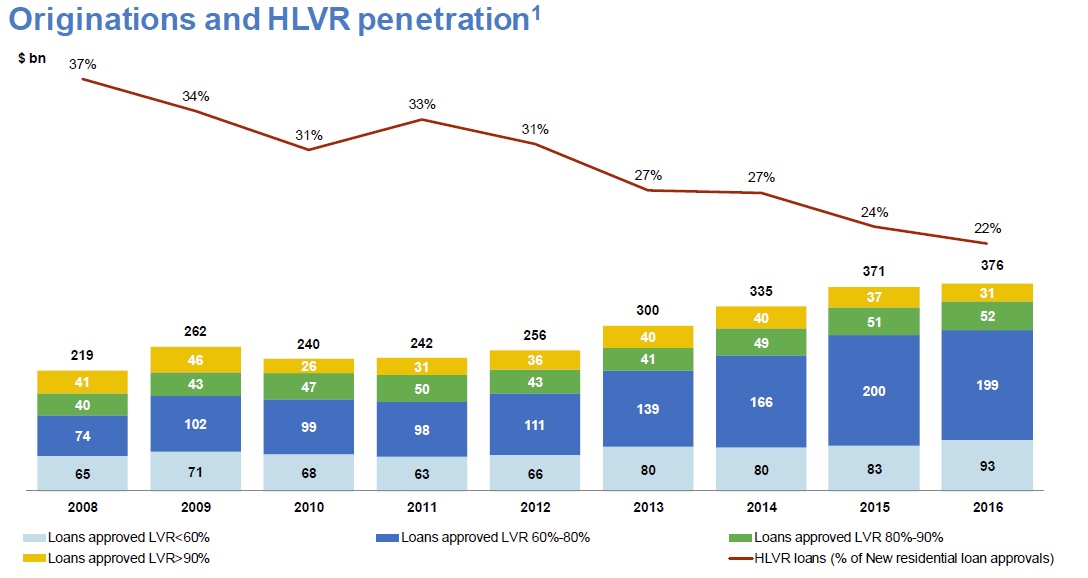
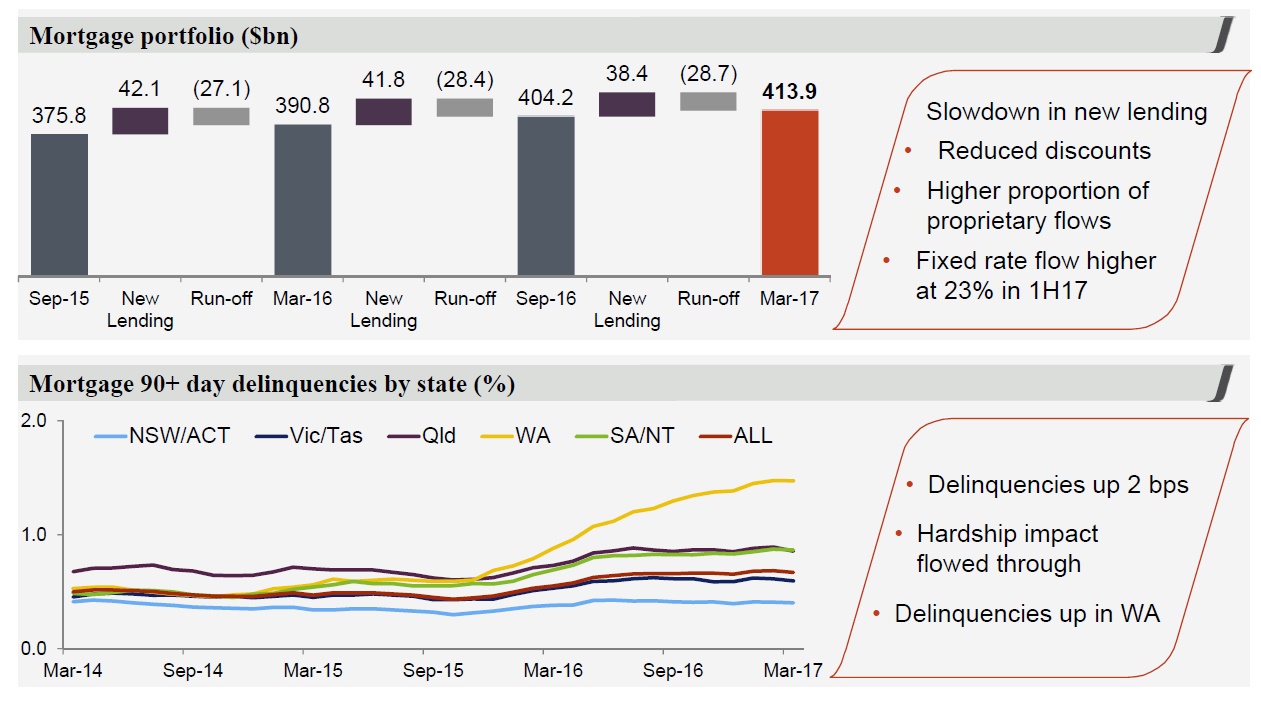
They said that interest-only represented 46% of flow in 1H17 and 50% of the total mortgage book. That said, the proportion of current drawdowns that are interest-only has already fallen into the mid-30s of total flow, remembering the APRA target of no more than 30% by September.

They also reported higher delinquency rates in their unsecured consumer books, with 90+ day up from 1.17% in Sept 16 to 1.63% in Mar 17.  28 basis points reflect an adoption of APRA hardship policy adopted across Westpac’s Australian unsecured portfolios.

Business Bank

Cash earnings of $1,008 million was $9 million, or 1% higher than Second Half 2016. The result was supported by higher fee income, targeted loan growth, and efficiency gains from digitisation and simplification initiatives. The division took a disciplined approach to growth in the half choosing to grow in sectors such as services and in SME and reducing exposure to some lower returning sectors including asset finance and commercial property. As a result, lending was up less than $1 billion (1%). Deposits grew 1%, mostly from working capital balances (up 4%) as the division focused on broadening relationships. Fee income was also higher mostly from a rise in line fees.

Expenses were up 1%, mostly from increased technology and investment including expanding the use of the division’s online origination platform and the continued roll out of new payment technologies. These increases
were partially offset by improved efficiencies including from the greater use of digital and refining the banker to customer ratio across segments. Impairment charges were flat, reflecting higher provisions in the auto loan portfolio, mostly related to a rise in delinquencies from changes in hardship reporting, offset by a lower impairment provisions for other business lending.

BT Financial Group

BTFG delivered a sound performance in a challenging environment, with good increases in funds, strong volume growth in lending and deposits and disciplined expense management. FUM and FUA balances were up 14% and 4% respectively while Life in-force premiums were up 6%.

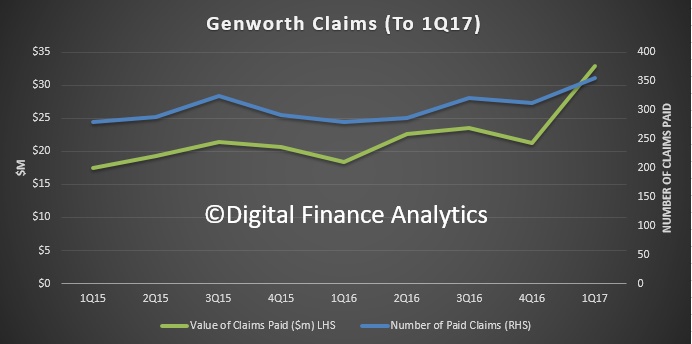
Despite these benefits, the division was impacted by higher insurance claims mostly associated with Cyclone Debbie, and reduced fund margins from product mix changes, including from customers being transitioned from legacy products to lower fee MySuper products. As a result, cash earnings were 5% lower to $397 million for First Half 2017. Expenses were $17 million lower over the half (down 3%) with productivity more than offsetting higher compliance costs and an increase in investment related expenses. The division reached a major milestone over the half with the release of a number of modules on the Panorama platform. The key elements of the platform are now complete resulting in increased activity and flows onto the platform.

Westpac Institutional Bank

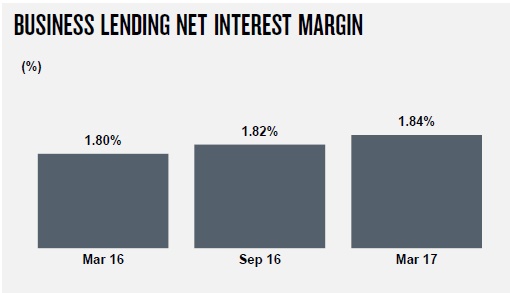
WIB delivered a strong result, with a 26% increase in core earnings from a rise in customer transactions, improved markets income and disciplined expense management. Cash earnings increased 20%, supported by the higher core earnings and partially offset by a $65 million rise in impairment charges. WIB has managed the business in a disciplined way over recent periods, including changing its business model in 2016 helping to keep costs flat and reducing exposures with low returns. This active management of the balance sheet contributed to a 3% decline in
lending over the half with margins up 1 basis point. A focus on relationships has supported a 6% increase in deposits and contributed to a rise in non-interest income as the division has been well placed to support customers involved in significant transactions. This was reflected in higher markets income and an improved contribution from foreign exchange and commodities. Impairment charges were $64 million from an increase in IAPs from new impairments which are partially offset by a reduction in CAPs due to a decrease in stressed assets. Overall asset quality remains sound with stressed assets to TCE falling by one third to 0.59% and impaired assets also declining.

Westpac New Zealand

Westpac New Zealand delivered cash earnings of NZ$462 million, up 6% over the half, with most of the rise due to impairments which were a benefit of NZ$36 million in First Half 2017. Core earnings were 7% lower over the half reflecting a 4% decline in net interest income with growth in lending more than offset by a 17 basis point decline in margins. Most of the decline in margins was from higher funding costs, particularly customer deposits and from the ongoing effects of low interest rates.

Non-interest income was little changed over the prior half. Expenses
were 1% higher, as the business continued the investment in its transformation program. Productivity benefits, from this multi-year program partially offset inflationary increases. Asset quality improved over the half with stressed assets to TCE of 2.41% down 13 basis points. The improvement reflects the stronger outlook for the dairy sector and the work-out of one larger facility. These two elements led to the NZ$36 million impairment benefit. In 2016 a drop in the price of milk solids saw a large number of facilities become classified as stressed; with milk prices having significantly improved, the division is beginning to see customers use the higher prices to improve their financial position and migrate out of stress.

Macquarie FY17 Profit Up 7.5%

Macquarie Group has announced a net profit after tax attributable to ordinary shareholders of $A2,217 million for the full year ended 31 March 2017 (FY17), up 7.5 per cent on the full year ended 31 March 2016 (FY16).

Profit for the half-year ended 31 March 2017 (2H17) was $A1,167 million, up 11 per cent on the half-year ended 30 September 2016 (1H17) and up 18 per cent on the half-year ended 31 March 2016 (2H16).

There was a nine per cent decrease in combined net interest and trading income to $A3,954 million, an 11 per cent decrease in fee and commission income to $A4,331 million, a five per cent increase in net operating lease income to $A921 million, whilst other operating income and charges of $A1,107 million in FY17 increased significantly from $A66 million in FY16. The primary drivers were increased gains on the sale of investments and businesses; and lower charges for provisions and impairments across most operating groups.  Total operating expenses increased two per cent whilst staff numbers were down.

Macquarie Group Managing Director and Chief Executive Officer (CEO) Nicholas Moore said: “Macquarie’s annuity-style businesses (Macquarie Asset Management (MAM), Corporate and Asset Finance (CAF) and Banking and Financial Services (BFS)), which represent approximately 70 per cent of the Group’s performance5, continued to perform well, with combined net profit contribution of $A3,249 million, up four per cent on FY16.

“Macquarie’s capital markets facing businesses (Commodities and Global Markets (CGM) and Macquarie Capital) also performed well with a combined net profit contribution of $A1,454 million, up 12 per cent on FY16.”

Net operating income of $A10,364 million in FY17 was up two per cent on FY16, while operating expenses of $A7,260 million were also up two per cent on FY16.

While Macquarie continued to build on the strength of its Australian franchise, its international income accounted for 63 per cent of the Group’s total income for FY17. Total international income was $A6,433 million in FY17, a decrease of five per cent on FY16.

Macquarie’s assets under management (AUM) at 31 March 2017 were $A481.7 billion, broadly in line with $A478.6 billion at 31 March 2016, due to favourable market movements and additional fund investments in Macquarie Infrastructure and Real Assets (MIRA), partially offset by a decrease in insurance assets and unfavourable foreign exchange movements.

Macquarie announced a 2H17 final ordinary dividend of $A2.80 per share (45 per cent franked), up from the 1H17 interim ordinary dividend of $A1.90 per share (45 per cent franked) and up from the 2H16 final ordinary dividend of $A2.40 per share (40% franked). The total ordinary dividend payment for the year of $A4.70 per share, is up from $A4.00 in the prior year. This represents an annual ordinary dividend payout ratio of 72 per cent. The record date for the final ordinary dividend is 17 May 2017 and the payment date is 3 July 2017.

Macquarie currently expects the year ending 31 March 2018 (FY18) combined net profit contribution from operating groups to be broadly in line with the year ended 31 March 2017 (FY17). The FY18 tax rate is currently expected to be broadly in line with FY17. Accordingly, the Group’s result for FY18 is currently expected to be broadly in line with FY17.

Operating group performance

  • Macquarie Asset Management delivered a net profit contribution of $A1,538 million for FY17, down six per cent from $A1,644 million in FY16. FY17 base fees of $A1,574 million were broadly in line with FY16. Base fee income benefited from investments made by MIRA-managed funds, growth in the MSIS Infrastructure Debt business and positive market movements in MIM AUM, largely offset by asset realisations by MIRA-managed funds, net AUM outflows in the MIM business and foreign exchange impacts. Performance fee income of $A264 million, predominately from infrastructure assets, was down from a particularly strong $A693 million in FY16. Investment-related income included principal gains from the partial sale of MIRA’s holdings in MQA and MIC, the sale of the trustee-manager of APTT as well as the sale of unlisted real estate and infrastructure holdings. Assets under management of $A480.0 billion were broadly in line with 31 March 2016.
  • Corporate and Asset Finance delivered a net profit contribution of $A1,198 million for FY17, up six per cent from $A1,130 million in FY16. The increase reflected the full year contribution of the AWAS and Esanda acquisitions as well as lower provisions for impairment, partially offset by the impact of lower loan volumes in the Lending portfolio, unfavourable foreign exchange and the sale of nine aircraft in the aircraft leasing portfolio. The AWAS and Esanda acquisitions continue to perform in line with expectations. CAF’s asset and loan portfolio of $A36.5 billion decreased seven per cent on 31 March 2016 due to the impact of unfavourable foreign currency movements, net repayments and realisations in the Lending portfolio and asset depreciation.
  • Banking and Financial Services delivered a net profit contribution of $A513 million for FY17, up 47 per cent from $A350 million in FY16. The improved result reflects increased income from growth in Australian lending, deposit and platform average volumes, as well as a gain on sale of Macquarie Life’s risk insurance business. This was partially offset by a loss on the disposal of the US mortgages portfolio, increased impairment charges predominately on equity investments and intangible assets, increased costs mainly due to elevated project activity as well as a change in approach to the capitalisation of software expenses in relation to the Core Banking platform. BFS deposits of $A44.5 billion increased ten per cent on 31 March 2016 and funds on platform of $A72.2 billion increased 24 per cent on 31 March 2016. The Australian mortgage portfolio of $A28.7 billion increased one per cent on 31 March 2016, representing approximately two per cent of the Australian mortgage market. NIM up across Australian mortgages and business lending portfolios,
    partially offset by lower NIM across business banking deposits.
  • Commodities and Global Markets delivered a net profit contribution of $A971 million for FY17, up 15 per cent from $A844 million in FY16. The result reflects an increase in investment-related income generated from the sale of a number of investments and a reduction in provisions for impairment compared to the prior year. This was partially offset by reduced commodities-related net interest and trading income compared to FY16 due to mixed results in power markets and base metals partially offset by increased client activity in precious metals. CGM continued to experience strong results for the energy platform, particularly in Global Oil and North American Gas and increased customer activity in foreign exchange, interest rates and futures markets due to ongoing market volatility. Equities was down on a strong prior year which benefited from strong equity market activity, particularly in China. Macquarie was awarded the 2016 Commodity House of the Year for the third consecutive year.
  • Macquarie Capital delivered a net profit contribution of $A483 million for FY17, up seven per cent from $A451 million in FY16. The increase was largely due to improved M&A Advisory in the US and Europe and DCM in the US and a decline in impairment charges partially offset by a decline in ECM income due to subdued equity market conditions in Australia. During FY17, Macquarie Capital advised on 417 transactions valued at $A159 billion including being joint lead manager, joint bookrunner and joint underwriter to Boral Limited’s ~$A2.1 billion equity raising to partially fund its acquisition of Headwaters Incorporated; financial adviser for a consortium led by Maeda Corporation for the privatisation of eight toll roads in Aichi Prefecture, Japan; financial adviser and debt arranger to a group of North American infrastructure investors on the acquisition of Cleco Corporation; exclusive financial adviser on Laureate Education’s $US400 million of convertible securities; capital raising and acquisition in conjunction with CGM of a 50 per cent Principal Investment in the 299MW Tees Renewable Energy Plant; and acquisition of a 25 per cent stake in the £1.6 billion, 573MW Race Bank offshore wind farm, also advising MIRA on the acquisition of a 25 per cent stake in the project.

Full year result overview

Chief Financial Officer (CFO) Patrick Upfold said: “Net operating income of $A10,364 million for FY17 was up two per cent on FY16, while total operating expenses of $A7,260 million were also up two per cent on FY16.”

Key drivers of the change from the prior year were:

  • A nine per cent decrease in combined net interest and trading income to $A3,954 million, down from $A4,346 million in FY16. CGM was impacted by limited trading opportunities in equity markets compared to FY16 which benefited from strong activity, particularly in China, as well as lower levels of commodities-related client activity and trading opportunities in energy markets compared to a strong FY16. Additionally, CAF was impacted by lower loan volumes in the CAF Lending portfolio and the full year impact of funding costs of the AWAS portfolio. Partially offsetting these declines was growth in average volumes and improved margins across the Australian loan portfolios in BFS, a stronger performance in foreign exchange, interest rates and credit markets products in CGM and the full year contribution of the Esanda dealer finance portfolio.
  • An 11 per cent decrease in fee and commission income to $A4,331 million, down from $A4,862 million in FY16. Performance fees were $A264 million in FY17, down 63 per cent on a particularly strong FY16 which benefited from significant performance fees of $A714 million. Brokerage and commissions income of $A813 million was down eight per cent from $A888 million, mainly in equities due to reduced client trading activity. Mergers and acquisitions, advisory and underwriting fees of $A963 million in FY17 was broadly in line with $A962 million in FY16 with a strong performance in mergers and acquisitions and debt capital markets fees partially offset by reduced fee income from equity capital markets activities, particularly in Australia due to subdued equity market conditions.
  • A five per cent increase in net operating lease income to $A921 million, up from $A880 million in FY16, mainly driven by the full year contribution of the AWAS portfolio acquisition in CAF, partially offset by unfavourable foreign currency movements for GBP denominated energy assets.
  • Other operating income and charges of $A1,107 million in FY17 increased significantly from $A66 million in FY16. The primary drivers were increased gains on the sale of investments and businesses; and lower charges for provisions and impairments across most operating groups with the largest decrease in CGM as a result of reduced exposures to underperforming commodity-related loans. Gains on the sale of investments and businesses included the sale of the trustee-manager of Asian Pay Television Trust (APTT) and the partial sale of holdings in Macquarie Atlas Roads (MQA) and Macquarie Infrastructure Corporation (MIC) by MAM, a significant gain from BFS’ sale of Macquarie Life’s risk insurance business to Zurich Australia Limited, as well as the sale of a number of investments in the energy and related sectors in CGM.
  • Total operating expenses increased two per cent, mainly due to higher employment expenses driven by increased share-based payments expenses relating to increased retained equity awards granted in previous years, higher performance-related remuneration expense largely driven by the improved overall performance of the operating groups and increased fixed remuneration due to a small increase in average headcount, partially offset by favourable foreign currency movements.

Staff numbers were 13,597 at 31 March 2017, down from 14,372 at 31 March 2016.

The income tax expense for FY17 was $A868 million, a six per cent decrease from $A927 million in FY16. The decrease was mainly due to changes in the geographic composition of earnings, with increased income being generated in Australia and the UK, and lower income in the US, combined with reduced tax uncertainties. These were partially offset by an increase in operating profit before income tax and the write-off of certain tax assets. The effective tax rate of 28.1 per cent was down from 31.0 per cent in FY16.

Strong funding and balance sheet position

“Macquarie remains well funded with a solid and conservative balance sheet, while pursuing its strategy of diversifying funding sources by continuing to grow its deposit base and accessing a variety of funding markets.” Mr Upfold said.

Total customer deposits increased by 9.6 per cent to $A47.8 billion at 31 March 2017 from $A43.6 billion at 31 March 2016. During FY17, $A10.5 billion of new term funding was raised covering a range of tenors, currencies and product types.

Capital management

Macquarie’s financial position comfortably exceeds APRA’s Basel III regulatory requirements, with Group capital surplus of $A5.5 billion at 31 March 2017, which was up from $A3.9 billion at 31 March 2016. The Bank Group APRA Basel III Common Equity Tier 1 capital ratio was 11.1 per cent (Harmonised: 13.3 per cent) at 31 March 2017, up from 10.7 per cent (Harmonised: 12.5 per cent) at 31 March 2016. The Bank Group’s APRA leverage ratio was 6.4 per cent (Harmonised: 7.3 per cent) and LCR was 168 per cent.

Macquarie intends to purchase shares, to satisfy the MEREP requirements of approx. $A378 million. The buying period for the MEREP will commence on 16 May 2017 and is expected to be completed by 7 July 2017. No discount will apply for the 2H17 DRP and the shares are to be acquired on-market.

Exchangeable Capital Securities buyback

Macquarie today announced that following the issue of $US750 million Macquarie Additional Capital Securities (MACS) hybrid capital in March 2017, it intends to buyback $US250 million Exchangeable Capital Securities (ECS) hybrid capital in June 2017. The ECS are Basel III – transitional Additional Tier 1 securities listed in 2012. Under the proposed transaction, a Resale of ECS will take place, whereby all ECS Holders will sell to a third party financial institution for par value on 20 June 2017 after interest has been paid. Macquarie Bank Limited (London Branch) will buyback ECS immediately following the Resale such that no Exchange to Macquarie’s ordinary shares will occur. A Resale Notice will be required to be delivered to ECS Holders shortly in accordance with the ECS Terms.

Regulatory update

The Basel Committee has delayed the finalisation of proposals to amend the calculation of certain risk weighted assets under Basel III. Any impact on capital will depend upon the final form of the proposals and local implementation by APRA.

APRA has delayed until at least 1 January 2019 the implementation of a new standardised approach for measuring counterparty credit risk exposures on derivatives (SA-CCR); and capital requirements for bank exposures to central counterparties (CCPs). APRA will consult again on these requirements in 2017. APRA has also announced that it does not expect to finalise a new market risk standard until at least 2020, with implementation from 2021 at the earliest.

APRA will give more detail around the middle of the year on how it proposes to address the Financial Systems Inquiry recommendation that Australian Authorised Deposit-Taking Institutions (ADI’s) capital ratios should be unquestionably strong.

APRA released final Net Stable Funding Ratio (NSFR) requirements at the end of 2016, however the exact application of certain elements of the standard remains under discussion. The NSFR and associated changes to APRA ADI Prudential Standard APS 210 will be effective from 1 January 2018. Macquarie Bank’s NSFR was greater than 100 per cent at 31 March 2017.


NAB March 2017 Results, A Mixed Bag

NAB has released their 2017 Half results. They reported cash earnings (“cash earnings” is calculated by excluding discontinued operations and certain other items) of $3.29 billion, up 2.3% compared to March 2016 half year.

There are some positives, with stronger contributions from markets and treasury (but of course less easy to replicate next time), net interest margin higher in the business sector, but lower momentum and margins in the home lending sector, rising delinquencies and higher provisions for commercial real estate. Capital ratios are strong, and funding well managed. Benefits from technology investments are flowing.

On a statutory basis, net profit attributable to the owners of NAB was $2.55 billion compared to a loss of $1.74 billion for the March 2016 half year. The improved result primarily reflects reduced losses from discontinued operations. Excluding discontinued operations, statutory net profit decreased 11.4%. The main difference between statutory and cash earnings relates to the effects of fair value and hedge ineffectiveness, and discontinued operations.

Revenue increased 1.8% benefitting from growth in lending, improved fee collection and stronger trading income.

Group net interest margin (NIM) declined 11 basis points but excluding Markets and Treasury was down 4 basis points. Compared to the September 2016 half year NIM was stable at 1.82%.

Expenses rose 0.8% reflecting higher personnel costs including redundancy charges, and increased technology depreciation and amortisation charges, partly offset by productivity savings.

The total charge for Bad and Doubtful Debts (B&DDs) was $394 million, up $19 million or 5.1%. The charge this period includes an increase in collective provision (CP) overlays of $89 million mainly for potential risks relating to the commercial real estate (CRE) portfolio. The Group’s total CP overlays for CRE, agriculture, mining and mining related sectors now stand at $291 million.

The ratio of Group 90+ days past due and gross impaired assets to gross loans and acceptances of 0.85% at 31 March 2017 was stable compared to 30 September 2016.

The Group’s Common Equity Tier 1 (CET1) ratio was 10.1% as at 31 March 2017, an increase of 34 basis points from 30 September 2016. The Group’s CET1 target ratio remains between 8.75% – 9.25%. On an internationally comparable basis3 the CET1 ratio increased 51 basis points from 30 September 2016 to 14.5%.

The interim dividend is 99 cents per share fully franked, unchanged from the 2016 interim and final dividends.

The Group says it maintains a well diversified funding profile and raised $18.8 billion of term wholesale funding in the March 2017 half year across a range of markets. The weighted average term to maturity of the funds raised by the Group over the March 2017 half year was 5.4 years. The net stable funding ratio (NSFR) was 108% at 31 March 2017.

The Group’s leverage ratio as at 31 March 2017 was 5.5% on an APRA basis and 5.9% on an internationally comparable basis.

The Group’s quarterly average liquidity coverage ratio as at 31 March 2017 was 122%.

Business & Private Banking grew cash earnings 2.5% to $1,368 million reflecting sound revenue growth and tight cost management, partly offset by higher B&DD charges. NIM improved and lending growth in specialised businesses such as Health and Agribusiness was strong.

Consumer Banking & Wealth cash earnings were stable at $764 million impacted by higher funding costs, increased competition in home lending, and reduced Wealth income. NIM stabilised compared to the September 2016 half year and more recent home lending market share trends are improving.

Looking at home lending, 42.3% are investor loans, and more than half of these are interest only.

Drawdowns from brokers continued to rise, as did the number of brokers under NAB owned aggregators.

Housing net interest margin fell, as did home lending revenue. They are growing below system.

Delinquencies are rising across the portfolio. They have limited exposure to commercial real estate (but provisions are up), and to higher risk mining post codes.

Card and personal lending delinquencies are also rising.

Corporate & Institutional Banking (CIB) cash earnings rose 17.9% to $791 million. This was a strong result underpinned by a disciplined focus on returns. Over the year to March 2017 CIB delivered revenue growth, lower costs, lower B&DD charges and a $15 billion reduction in risk weighted assets.

NZ Banking local currency cash earnings increased 10.4% to NZ$455 million. Improved economic conditions, and in particular a better outlook for the dairy sector, (provisions down ~90% compared with prior half) have resulted in lower B&DD charges. Strong growth in business and home lending reflect successful expansion in priority segments. NZ net interest margin fell.

NAB Group CEO Andrew Thorburn said:

“The rollout of the Net Promoter Score (NPS) system to all our front line teams is an important tool that helps bankers take greater ownership of the customer experience. Every branch, contact centre and business banking centre now receives localised weekly scores and real time customer feedback resulting in improved customer outcomes on our front line.

“Technology underpins our ability to serve customers better by becoming easier and simpler to deal with. Over the half we have made further progress embedding the Personal Banking Origination Platform (PBOP) into our network. Approximately 55% of customers are now receiving unconditional home loan approval within 5 days compared to 7% at September 2016.

“Disciplines in place to reshape our business, including use of automation and meeting more of our customers’ needs digitally, are delivering efficiency benefits. In 1H17 we achieved $102 million of productivity savings against an annual target of greater than $200 million. We remain confident of achieving positive ‘jaws’ over the full year as a number of initiatives gain further traction during the second half of 2017”.


Genworth Under Pressure

Lender Mortgage Insurer Genworth reported today, and gives a good snapshot of what is happening in the mortgage market.  The volume of new higher LVR loans (HLVR) is falling.  Claims are rising.  But capital ratios remain strong, they have lifted premiums and are exploring new business opportunities.

They showed that claims volumes and value paid rose.

Within their book, delinquencies were at 0.78% in WA, whilst QLD had the largest number, and 0.68% of book.

They make the point that 2008 is a problem year.

Genworth Mortgage Insurance Australia Limited (Genworth) has reported statutory net profit after tax (NPAT) of $52.2 million down 22.4% on 1Q16, and underlying NPAT of $68.3 million for the quarter ended 31 March 2017, up 10.7% on 1Q16.

New business volume, as measured by New Insurance Written (NIW), increased 9.7 per cent to $6.8 billion in 1Q17 compared with $6.2 billion in 1Q16. The result included $1.3 billion in bulk portfolio transactions.

GWP increased 3.8 per cent to $88.2 million in 1Q17. This reflects a higher LVR mix of business compared with the same quarter in 2016 and the impact of the premium rate actions taken in 2016.

Reported NPAT includes after-tax mark-to-market loss of $16.1 million on the investment portfolio.

Net Earned Premium (NEP) of $107.9 million in 1Q17 decreased 4.9 per cent compared with $113.5 million in 1Q16 reflecting lower earned premium from recent book years.

The expense ratio in 1Q17 was 25.2 per cent compared with 23.4 per cent in 1Q16.

The loss ratio was 34.8 per cent in 1Q17, up from 27.0 per cent in 1Q16, due to lower NEP, an increase in the number of delinquent loans relative to a year ago and a higher average paid claim amount.

New South Wales and Victoria continue to perform strongly. However, the performance in Queensland and Western Australia remains challenging and delinquencies are elevated due to the slowdown in those regional and metropolitan areas that have been previously benefited from the growth in the resources sector.

As at 31 March 2017, the Company had invested $207 million in Australian equities in line with the previously stated strategy to improve investment returns on the portfolio within acceptable risk tolerances. After adjusting for the mark-to-market movements, the 1Q17 investment return was 3.14 per cent per annum, down from 3.55 per cent per annum in 1Q16.

Genworth previously announced that the exclusivity agreement for the provision of LMI with its second largest customer was terminated in April 2017. The Company has been successful in entering into new business with that customer that assists them in managing mortgage default risk through alternative insurance arrangements.

Genworth also advises that its customer, the National Australia Bank, has issued a Request For Proposal relating to its LMI requirements. The Company has submitted its proposal and will provide updates as to the outcome of its proposal.

Genworth continues to pursue other profitable opportunities in the market that meet its risk appetite and return on equity profile.

Overall, the Company expects GWP in 2017 to be below 2016 levels, down between 10 per cent and 15 per cent, subject to the timing and extent of any changes in the customer portfolio. Genworth expects 2017 NEP to decline by approximately 10 to 15 per cent and for the full year loss ratio to be between 40 and 50 per cent. The Board continues to target an ordinary dividend payout ratio range of 50 to 80 per cent of underlying NPAT.


Regulatory Pressure Squeezes Yellow Brick Road

Yellow Brick Road released their quarterly update to end March 2017.

Operating cash surpluses have improved despite tougher lending market conditions. Higher margins and the benefits of the Company’s rationalised operating structure have delivered improved operating cash surpluses.

This improvement has been achieved despite an 8% decline in settlement volumes, vs Prior Comparable Period (PCP:Q3 FY2016).

The net operating cash result for the quarter was a $0.5m surplus, an improvement of 340% ($0.4m) from Q3FY2016 ($0.1m). Underlying cash trends are positive. Compared with Q3 FY2016, on an underlying basis these trends are:

  • Receipts from customers improved 8%.
  • Surplus of receipts over direct costs improved by 10%
  • Underlying cash outflows increased by 4% due to increased marketing outflows.

Underlying, revenue generating, assets of the business are continuing to grow, for example:

  • The Company’s wealth operations continue to gain scale FUM are up by 87% to $1.3b (vs PCP).
  • The group book of loans under management grew 19% vs PCP to $42.5b

Recent initiatives by regulators seeking to limit the volume of certain types of lending, including investment loans and interest only loans, have affected the lending market.

The Company has seen lower than expected lending volumes as a result of the changes. To date the reduction has not been sufficient to materially affect the Company’s ability to continue to meet market expectations (a FY2017 full year profit). The medium-term impact of the changes on lending volume is unable to be quantified at this time.