AFG Reports 33% 2017 Profit Uplift

Australian Finance Group (AFG) reported a net profit after tax (NPAT) of $30.2 million for the 2017 financial year (FY2017). This excludes the impact of the recognition of AFG Home Loans (AFGHL) white label settlements relating to prior years (normalised NPAT). This is slightly ahead of the result forecast and an increase of 33% on FY2016.

They now have around 2,900 mortgage brokers, and process on average around 10,000s loan each month with 45 lenders on their panel.

AFG Chief Executive Officer David Bailey said the strong result has been driven by AFG’s core business of residential mortgages, commercial lending, and the continued strong growth in the own-branded AFGHL business.

“Today’s results are a testament to AFG’s strategy of continuing to focus on our core business and growth through earnings diversification. We are very pleased with our progression down this path.”

These results have been achieved in an environment of flat credit growth and significant regulatory changes impacting foreign investment and credit appetites of Australia’s lenders.”

Highlights include:

  • Reported NPAT of $39.1 million, normalised NPAT of $30.2 million
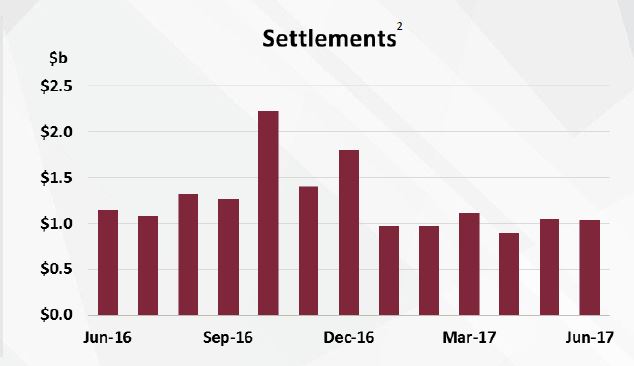
  • White label AFG Home Loans settlements of $2.7 billion
  • Combined residential and commercial loan book of $133 billion, growth of 11% over FY2016
  • Residential settlements of $34.3 billion
  • Commercial settlements of $2.8 billion
  • Final dividend 5.5 cents per share
  • Earnings Per Share (EPS) for FY2017 is 14 cents per share based on normalised NPAT
  • ROE of 31%

Company Outlook

The AFGHL business finished the full year 2017 with settlements of $2.7 billion. This result represents a 38% increase on FY2016 and evidences the success of our ongoing strategy to deliver competitive choice to Australian borrowers. The AFGHL loan book is now $5.5 billion, an increase of 44% from $3.8 billion in FY2016.

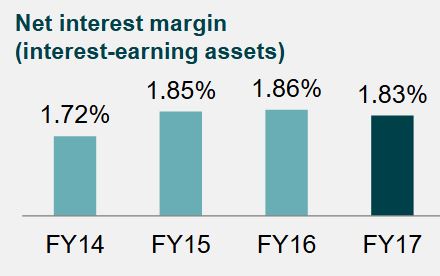
Overall, the company has a residential loan book of $126 billion that will generate ongoing trail commission. The AFG Home Loans securitised book has seen a 10% increase in settlements for FY2017 to finish the financial year at $1.15 billion, whilst maintaining a strong net interest margin.

Mr Bailey noted the company has achieved another strong year in the recruitment of brokers. From 2,650 active brokers in FY2016, numbers have increased by 8.5% to 2,875.

“In a clear sign of the health of the commercial lending market AFG Commercial asset financing settlements rose 20% to finish the year at $445 million,” he said.

“AFG Commercial mortgage settlements for the year were $2.84 billion, which represents just 0.7% of the overall $410 billion commercial lending market in Australia. The potential for growth is tangible.”

The small to medium enterprise (SME) segment of the market in particular is also one where AFG is optimistic. AFG is poised to harness this growth with the impending rollout of an Australian-first SME lending platform. The new platform, AFG Business, will enable our network of brokers to provide small business borrowers access to a broad range of options and deliver faster access to capital.”

Market conditions

The complexity of the Australian lending market has increased significantly in the past 12 months. “AFG began its listed life with around 1,450 products on its lending platform,” explained Mr Bailey. “That number has now increased to more than 3,400 at FY2107.

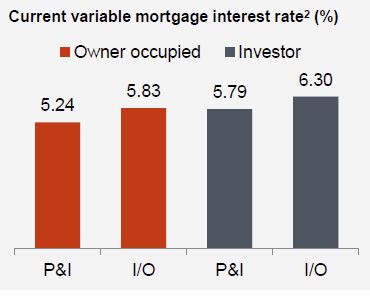
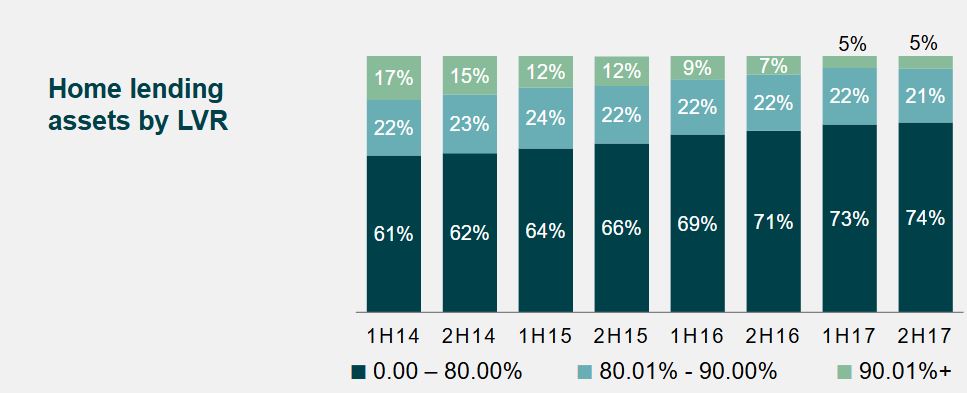
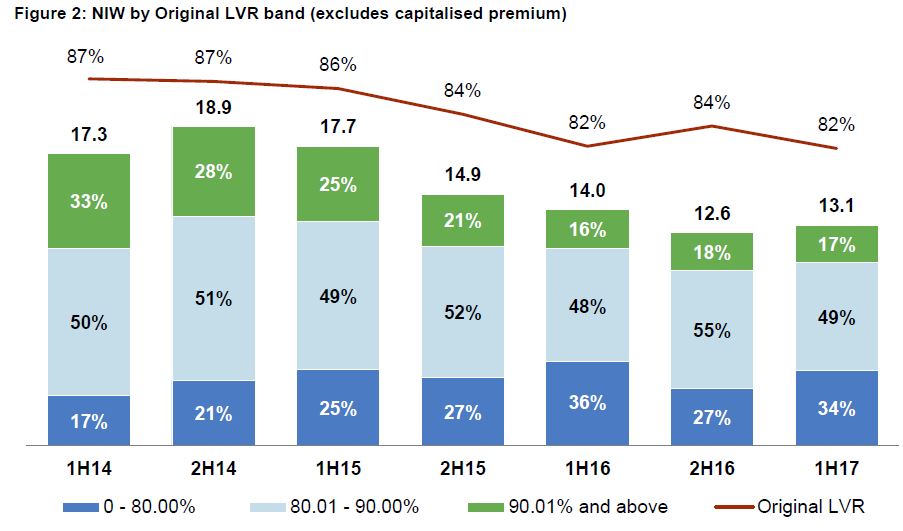
“The growth is a reflection of multiple changes by lenders to their Australian product suites. The introduction of new products, changes to LVR bands, numerous product splits with differing rates, repayment options according to loan type, and significant changes to investor and owner occupier pricing have been rolled out across our platform in the past 12 months. These ongoing changes have been delivered at an unprecedented pace and reaffirms the importance to a consumer of having an informed broker.

With more than 10,000 customers seeking the assistance of an AFG broker every month, the value consumers place on the mortgage broking channel continues to be clear. “The mortgage broking channel accounts for 53% of the Australian lending market and more than 20% of those mortgage brokers work with AFG,” said Mr Bailey.

2017 has also been marked by significant regulatory scrutiny of the Australian lending market. “AFG has been at the forefront of consultation with industry, government and regulators. The message we have had for all stakeholders has been clear – AFG has 45 lenders on its panel with more than 35% of borrowings going to lenders other than the four major banks, and we remain committed to ensuring choice and competition remains for Australian consumers.

“This competitive tension ensures consumers continue to have choice and most importantly benefit in terms of home loan price and service because of what brokers deliver on a daily basis across the Australian lending market,” he concluded.

Westpac Q3 Update – Capital Strong, But Mortgage Risks Higher

Westpac released their Q3 Capital update today. The CET1 ratio was 10% at 30 June 2017, and equivalent to 15.3% on a comparable international basis.  This is higher than expected helped by strong dividend reinvestment.  They said they would provide further guidance on their preferred CET1 range (8.75%-9.25%) once APRA finalises its capital adequacy framework review.

The Net table funding ratio was 108% and the liquidity coverage ratio was 128%. The bank is well placed on these key ratios.

Stressed exposures TCE decreased by 4 basis points to 1.10%. Most sectors, including commercial property, mining and New Zealand dairy improved.

Unsecured delinquencies rose in the quarter, up 12 basis points to 1.75% mostly due to APRA hardship reporting changes. Changes in the reporting of hardship have had an impact on the level of reported delinquencies, with mortgage 90+ day up 16 basis points and unsecured consumer lending the change lifted 90+ day by 49 basis points. Cyclone Debbie caused a further rise.

30+ day delinquencies were at 138 basis points, compared with 139 in March, and 130 in Sept 16. 90+ delinquencies were 69 basis points, compared with 67 in March. The number of properties in possession rose from 382 to 422, mainly due to a rise in WA and QLD.  The WA trend is visible, thanks to weaker economic conditions.  Actual losses for the 9 months was a low $57 million.

Westpac provided further details of the changes in their mortgage book, thanks to the regulatory intervention on IO loans. IO loans are at least 50 basis points higher than the equivalent P&I loan. Investment loans are at least 47 basis points higher than the equivalent OO loan.

They have imposed a maximum LVR of 80% for all new IO loans (including limit increases, term extensions and switches. They are no longer accepting external refinances from other financial institutions for OO IO.  There are no fees to switch from IO to P&I.

The say the flow of IO lending was 44% in 3Q17, with applications 36% of flows (down from 52% and 47% in 2Q17). Despite seeing settlements above 30% IO, currently, they say they should be below 30% by 4Q17 – September 17.

The 30% IO cap incorporates all new IO loans, including bridging finance, construction loans, lines of credit as well as limit increases on existing loans. The IO cap excludes flows from switching between repayment types, such as IO to P&I or from P&I to IO and also excludes term extensions of IO terms within product maximums (5 years for IO OO and 10 years for investor loans).

They also described their mortgage warehouse, with Westpac providing funding for over 20 Australian mortgage originators (both ADI and non-ADI). The bank’s warehouse limits have been stable at around $10bn, but asset balances have been more variable.


ANZ Q3 FY17 Trading Update

ANZ released their unaudited Statutory Profit for the Third Quarter to 30 June 2017 was $1.67 billion. Provisions were $243 million. Cash Profit of $1.79 billion up 5.3%. Profit before Provisions increased 0.3%.

Customer deposit growth of 2.3% with net lending asset growth of 2.0% during the quarter.

Revenue decreased 0.3% which in part reflected a normalisation of the Markets business performance after an unusually strong first half along with the sale of 100 Queen Street.

Expenses reduced 1% and continue to be well managed. As flagged the proceeds of the sale of 100 Queen Street are being reinvested in the business with approximately two thirds occurring in the second half, largely in the final quarter.

The Group Net Interest Margin (NIM) was stable, up several basis points excluding Markets. Australia Division NIM improved offsetting a decline in Institutional NIM. The Australian Bank Levy will impact the NIM in the fourth quarter being reflected within the cost of funds.

The reshaping of the Institutional Division asset base continued with Risk Weighted Assets (RWA) reducing a further $3 billion to $156 billion, with a cumulative reduction of $12 billion (-7%) during the Financial Year to date. The changing profile of the book has resulted in a decline in the Division’s provision charge and an improvement in the risk adjusted return (NII/Average Credit Risk Weighted Assets (CRWA)).

Above system growth in residential mortgages in Australia has been primarily driven by the Owner Occupier segment. The Division is tracking well in respect of meeting various macro prudential requirements regarding mortgage growth.

The total provision charge of $243 million was comprised of an Individual Provision (IP) charge of $308 million and a Collective Provision (CP) release. The release of CP was largely driven by continued reshaping of the Institutional portfolio along with some transfers to IP.

The Australian Prudential Regulation Authority Common Equity Tier 1 (CET1) ratio was 9.8% at 30 June, which incorporates 51 basis points of net organic capital generation offset by the Interim Dividend (59 bps) and adoption of the new RWA models for Australian Residential Mortgages. Proforma CET 1 was 10.5%.

Post the end of the third quarter ANZ completed the sale of the Retail and Wealth businesses in China and Singapore to DBS with Hong Kong expected to complete prior to the end of the second-half. All other transactions remain subject to regulatory approvals and completion.

1 Excludes Markets income
2 Source: ANZ analysis of APRA monthly banking statistics

Bendigo and Adelaide Bank FY17 Results

Bendigo and Adelaide Bank released their FY17 results today. It was perhaps stronger than expected and they have a good retail franchise. But they benefited from on-off mortgage loans repricing which helped margin and are now seeing lower mortgage volumes following the APRA guidance, so there remains much to do.

They reported an after tax statutory profit of $429.6m for the 12 months to 30 June 2017. The full year dividend was maintained at 68 cents fully franked.

Underlying cash earnings was $418.3 million, up 4.2% on the prior year.

They reported mortgage growth of 7.7%, with a strong NIM improvement of 8 basis points in the second half despite a 1 basis point fall across the year, achieving 2.26% half on half. They gave away deposit margin to grow their funding base.

Their exit margin was 2.34%. Keystart’s NII contribution was $11.3m.

Funding includes 80. 2 percent from deposits, with retail deposits up 4.7 per cent. The mix of call to term deposits swung a little to call (term down 1.1% and call up 2%).

Home lending showed a fall in approvals IH17 $8,711m approved compared with $5,419m in the 2H17.

They were impacted by APRA’s lending caps as shown by interest only flows

… and investor credit growth.

Settlements are sitting at ~$1bn per month. They say 45% of customers are ahead of minimum repayments, and 29% three or more repayments ahead.

Home loan 90+ days past due shows a persistent rise in WA (Keystart included from Jun-17 and is below the WA average). QLD was also higher.

Homesafe contributed $90.4m

Homesafe overlay reflects an assumed 3% increase in property prices for the next 18 months, before returning to a long term growth rate of 6%

Retail mortgage provisions are 0.02% in FY17, down from 0.03% at Jun-16.  Business arrears were lower, and there was a small rise in credit card arrears, to above 1.5% in Jun-17.  The specific provisions balance was $89.5m, reflecting 0.15% of gross loans compared with 0.22% a year ago.

The cost income ratio fell 2% to 56.1 per cent, on nearly flat expenses. They had 118 less FTE in FY17 and included redundancies of $4.2m.

They continued to invest in, and capitalise software.

The CET1 ratio is 8.27%, up 30 basis points from December 2016, and they say the “unquestionably strong” target will be achieved – but no details.

They continue progress towards advanced accreditation, and the investment has improved their risk management capability, whether or not they decide to switch (given APRA’s moving target!). Again, no details. Our own view is that the benefit of advanced has been significantly eroded by APRA.


NAB 2017 Third Quarter Trading Update

NAB gave their June 17 quarter update today.  There were no surprises, with an unaudited statutory net profit of $1.6 billion and unaudited cash earnings of $1.7 billion, up 2% versus March 2017 Half Year quarterly average and 5% versus prior corresponding period.

Andrew Thorburn, Group CEO said:

The major bank levy became effective from 1 July 2017 and is estimated to cost NAB approximately $375 million annually, or $265 million post tax, based on our 30 June 2017 liabilities.

Separately, in July, the Australian Prudential Regulation Authority (APRA) announced a CET1 ratio target of at least 10.5% by January 2020 for major banks to be viewed as ‘unquestionably strong’, with finalisation of international capital reforms not expected to require any further increases to Australian requirements. NAB expects to meet APRA’s new capital requirements in an orderly fashion given the existing capital position and the timelines involved.

Revenue was up 2%, with growth in lending and improved Group net interest margin (NIM) partly offset by lower Markets and Treasury income. They reported a higher Group NIM largely reflects loan repricing and more favourable funding conditions. Expenses were up 2%, or 1% excluding redundancies, due to increased investment spend.

The biggest impact was a reduction in the bad debt charges. Bad and doubtful debt charges (B&DDs) fell 12% to $173 million, reflecting improved asset quality trends and non-repeat of the collective provision overlay for commercial real estate raised in the March 2017 Half Year.

The ratio of 90+ days past due (DPD) and gross impaired assets (GIAs) to gross loans and advances (GLAs) of 0.80% declined 5 basis points (bps) from March 2017 mainly reflecting improved conditions for New Zealand dairy customers.

The Group Common Equity Tier 1 (CET1) ratio of 9.7%, compared to 10.1% at March 2017 mainly reflecting the impact of the interim 2017 dividend declaration and 17 bps for higher risk weights due to previously advised mortgage model changes.

The Leverage ratio was 5.3% (APRA basis), the Liquidity coverage ratio (LCR) quarterly average was 127% and the Net Stable Funding Ratio (NSFR) was 108%.

For this full year they remain confident of achieving more than $200 million in productivity savings and, excluding the impact of the bank levy, expect to deliver positive ‘jaws’.


AMP reports 1H 17 results

AMP reported their 1H17 results today. Underlying profit was A$533 million in 1H 17, up 4 per cent (1H 16: A$513 million), and net profit of A$445 million (1H 16: A$523 million).

The results reflect strong operating earnings growth from AMP Capital (+11%), AMP Bank (+10%) and New Zealand financial services (+5%).

Australian wealth protection earnings increased by 11% on 1H 16, reflective of the steps taken to stabilise the business in 2H 16. Australian wealth management earnings declined 1% from 1H 16, largely due to margin compression from MySuper transitions and a reset of the investment management agreement with AMP Capital.

Underlying investment income decreased A$11m to A$50m from 1H 16, due to lower shareholder capital resources and a 50 bp reduction in the assumed underlying after-tax rate of return.

Australian wealth management 1H 17 net cashflows were A$1,023m, up 76% from 1H 16. AMP’s retail and corporate super platform net cashflows were positively impacted by recent changes to superannuation contribution limits and large mandate wins.

AMP Capital external net cash inflows were A$2,439m, up from net outflows of A$153m in 1H 16. Inflows were driven by strong flows into fixed income and real asset (infrastructure and real estate) capabilities.

Underlying return on equity rose 2.6 percentage points to 14.5% in 1H 17 from 1H 16, largely reflecting the impact of capital management programs.

Completion of reinsurance program delivers on strategy, with new arrangements to release approximately A$500 million of capital from AMP Life (subject to regulatory approval) further reducing the capital intensity of the wealth protection business.

Sustained cost management on track to deliver 3 per cent reduction in controllable costs (ex AMP Capital) by FY 17.

Strong capital position with A$1.9 billion over minimum regulatory requirements. Interim dividend increased to 14.5 cents a share, franked to 90 per cent.

Wealth protection: reinsurance update

AMP today announced a series of new reinsurance agreements, delivering on its strategy to release capital from the Australian wealth protection business and reduce future earnings volatility. Releasing approximately A$500 million in capital from AMP Life (subject to regulatory approval), the new reinsurance agreements include:

A new quota share agreement with General Reinsurance Life Australia Limited (Gen Re) to cover 60 per cent of the NMLA retail portfolio, which was merged with AMP Life on 1 January 2017.

An extension to the existing agreement with Munich Reinsurance Company of Australasia Limited (Munich Re) to cover 60 per cent (up from 50 per cent) of the AMP Life retail portfolio.

A new surplus cover agreement with Gen Re to assist in managing risk and volatility in individual retail claims.

Recapture of 35 existing reinsurance treaties, simplifying AMP’s overall reinsurance arrangements.

The new reinsurance agreements will commence on 1 November 2017 and, when combined with the first tranche of reinsurance completed in 2016, effectively means 65 per cent of AMP’s retail life insurance portfolio will be reinsured for claims incurred from 1 November 2017.

Australian wealth management

Australian wealth management operating earnings, down 1 per cent to A$193 million, were resilient. The result demonstrates effective margin management during the final transitions to low-cost MySuper funds and amid significant activity across the superannuation industry. MySuper transitions completed in 1H 17 with margin compression expected to continue to be around 5 per cent this year.

Net cashflows were significantly higher in 1H 17, with stronger inflows from discretionary super contributions ahead of 1 July changes to non-concessional caps. The transition of corporate super mandates also supported inflows, with one mandate bringing more than 3,700 new customers to AMP. During the period, AMP paid A$1.3 billion in pensions to help customers through their retirement.

AMP’s flagship North platform performed well in 1H 17, with flows up 8 per cent and AUM up 13 per cent on FY 16. North now has more than A$30 billion in assets under management.

To offset the impact of margin compression, AMP is targeting additional revenue growth from its Advice and SMSF businesses, which is reported in the Other revenue line. AMP expects Other revenue to increase by 10 per cent in FY 17, with growth in Advice and SMSF revenues emerging in 2H 17 and accelerating into 2018. This will support the delivery of AMP’s target of 5 per cent overall revenue growth in Australian wealth management through the cycle.

AMP Capital

AMP Capital delivered strong growth in operating earnings, up 11 per cent to A$92 million, benefiting from good growth in fee income. External assets under management fees rose by 6 per cent to A$132 million and non-AUM based management fees also increased, benefiting from growth in real estate development fee revenue.

External net cashflows increased to A$2.4 billion, with significant cash inflows into fixed income and higher-margin real assets. Real assets proved popular with investors wanting exposure to leading infrastructure and real estate investments.

Delivering on its strategy to expand internationally, AMP Capital grew its number of direct international institutional clients from 199 at FY 16 to 252 in 1H 17 and now manages A$10 billion in assets on their behalf. In China, AMP Capital’s asset management joint venture, China Life AMP Asset Management (CLAMP), continues to grow rapidly with AUM increasing 22 per cent to RMB 141 billion (A$27.1 billion) in 1H 17. Total AUM for China Life Pension Company, the pensions joint venture in which AMP owns a 19.99 per cent stake, grew 8 per cent to RMB 408.2 billion (A$78.5 billion) in 1H 17.

At 30 June 2017, AMP Capital had A$3.5 billion of committed funds available for investment including funds raised in its Infrastructure Debt Fund III (IDFIII), which has attracted strong international interest.

AMP Bank

Strong growth momentum continued in AMP Bank, with operating earnings up 10 per cent to A$65 million, driven by 17 per cent growth in lending to A$18.8 billion.

AMP Bank delivered residential mortgage book growth of A$1.7b in 1H 17 to A$18.2b (an increase of 18% from 1H 16 and 10% from 2H 16), driven by strong growth in owner occupied lending. Growth in AMP Bank’s investment property and interest only lending segments was constrained, in response to regulatory requirements. They expect this trend to continue in 2H 17.

Above system loan growth was delivered through both the broker and AMP aligned adviser channels. Sales through the AMP aligned channel in 1H 17 were up 49% on 1H 16.

The cost to income ratio rose slightly to 29 per cent, with controllable costs increasing by A$4 million reflecting ongoing investment to support growth. Lending growth in the bank is expected to moderate in the second half as the market adjusts to new regulatory requirements.

Net interest margin declined 4 basis points from 1H 16 but improved 4 basis points on 2H 16.

Asset quality remains strong, with mortgages in arrears (90+ days) at 0.48% as at June 2017. Loan impairment expense to average gross loans and advances was 0.02% in 1H 17, reflecting the conservative underwriting standards

Australian wealth protection

Actions undertaken in 2016 to stabilise and reset the business are working and have delivered an improved result. Operating earnings rose 11 per cent, with improved experience offsetting lower profit margins.

The announcement of further reinsurance agreements, completing the strategic reinsurance program, lessens exposure to retail claims volatility and will further stabilise wealth protection earnings. AMP continued to support customers during their time of need, paying A$575 million in claims during the six months to 30 June.

New Zealand financial services

Operating earnings, up 5 per cent to A$65 million, reflect higher experience profits. AUM increased 6.9 per cent to A$15.5 billion on positive markets.

A strong focus on cost management supported a reduction in controllable costs by 3 per cent to A$38 million and improved the cost to income ratio by 1.4 percentage points to 27.2 per cent.

Australian mature

Operating earnings are up A$6 million from 1H 16 to A$75 million due to strong markets, lower controllable costs and improved experience.

Capital and dividend

AMP’s capital position remains strong, with level 3 eligible capital resources A$1,887 million above minimum regulatory requirements at 30 June 2017, down from A$2,195 million at 31 December 2016.

The reduction largely reflects capital returned to shareholders through an on-market share buy back and investment in business growth during the period. The new reinsurance agreements are expected to release up to an additional A$500 million from AMP Life (subject to regulatory approval).

The interim dividend has been increased to 14.5 cents per share, franked at 90 per cent. The 1H 17 dividend payout is within AMP’s stated target range of 70 to 90 per cent of underlying profit

CBA FY17 Profit Up 7.6%

CBA just released their FY17 results, with statutory NPAT $9,928m, up 7.6% on FY16. The cash NPAT was up 4.6% to $9,881m. Much of the lift is explained by a fall in loan impairment expense, down 12.8% to $1,095m, plus a one off from the Visa transaction.

However their net interest margin fell 3 basis points to 2.11%, despite recent mortgage book repricing. The underlying cost income ratio fell 60 basis points to 41.8%.

As a result, return on equity overall fell 0.5% to 16%, earnings per share was $5.74 (compared with $5.55 in FY16) and the dividend per share was $4.29, compared with $4.20 last year.

Operating income increased by 3.8%, ahead of operating expense growth of 2.4%, delivering positive jaws on an underlying basis.

Banking income grew 4.3% due to volume growth in home lending, business lending and deposits. Insurance income fell 1.1% due to loss recognition of $143 million.

CBA Invested almost $1.3 billion whilst maintaining underlying expense growth to 2.4%.

Higher wholesale funding costs and increased competition in home and business lending more than offset asset repricing, resulting in a 3 basis point decline in the net interest margin to 2.11%. In calculating the Group’s NIM, mortgage offset balances are now being deducted from average interest earning assets to reflect their non-interest earning nature, and to align with peers and industry practice. This results in changes to Group’s NIM for current and prior periods.

It was flat second half thanks to home loan repricing.

Looking across the divisions, the Retail Bank again contributed the lions share of the result, but with positive growth at the NPAT level in all divisions, other that IFS; all on a cash basis.

In the Retail bank, consumer arrears were controlled, though losses in WA climbed again, with 90+ days at 1.23%.

Some interesting mortgage related information was contained in the announcement.

The FY17 losses on their home loan book is 3 bpts. The portfolio dynamic LVR is 50%. Investment loans make up 33%, with new investment loans falling from 37% in Dec 16 to 32% in Jun 17. 77% of customers are paying in advance – this includes any amount ahead of monthly minimum repayment and includes offset facilities. They have a loan serviceability buffer of 2.25% above the customer rate, with a minimum floor rate (RBS: 7.25% pa, Bankwest: 7.35%). They have a maximum LVR of 80% for IO loans now. Interest Only loans have lower arrears.

John Symond exercised his put option which will require CBA to acquire the remaining 20% interest in Aussie Home Loans (AHL). The purchase price will be determined in accordance with the terms agreed in 2012 and the purchase consideration will be paid in the issue of CBA shares. They will consolidate AHL from completion of the acquisition which is currently expected to be in late August 2017.

Their focus on propitiatory loan origination has led to a fall in the proportion of loans via brokers.

More broadly, CommBank research on financial wellbeing shows one in three Australian households would struggle to access $500 in an emergency, and more than a third of Australians are spending more than they earn each month.

The Group’s Common Equity Tier 1 (CET1) ratio was 10.1% on an APRA basis, and 15.6% on an internationally comparable basis, maintaining CBA’s position in the top quartile of international peer banks for CET1.

CBA are confident they will meet APRA’s‘unquestionably strong’ CET1 ratio average benchmark of 10.5% or more by 1 January 2020.

Customer deposits contributed 67% of total funding and the Net Stable Funding Ratio (NSFR) was 107%.

The average tenor of the wholesale funding portfolio was 4.1 years and the average tenor of new issuance was 5.2 years.

Liquid assets increased from $134 billion in 2016 to $142 billion, and the Liquidity Coverage Ratio was 129%.

The Leverage Ratio was 5.1% on an APRA basis and 5.8% on an internationally comparable basis.

The banking levy is estimated at $258m (post tax), first payment due March 2018. The Group effective tax rate will be 30.3% after the levy.


Suncorp FY17 Results – Margin Still Under Pressure

Suncorp Group Limited today reported NPAT of $1,075 million (FY16: $1,038 million) for the 12 months to 30 June 2017, an increase of 3.6%. They announced a a final dividend of 40 cents per share fully franked, bringing the total dividend to 73 cents per share (FY16: 68 cents) which represents a payout ratio of 81.9% of cash earnings. The results were helped by overall lower provisions. The repricing of mortgages helped also, but despite this bank NIM fell and home lending past due rose a little. So, its still a tough gig!

Suncorp is a complex portfolio of businesses, with a significant concentration in Queensland, so you have to look at each element. Given our focus on retail banking we will dive a little deeper there.

The Insurance business delivered NPAT of $723 million, up 30%, due to strong top-line growth and lower claims costs. The General Insurance business continued to see strong progress in remediating claims cost issues in the Home and Motor portfolios. GWP increased by 3.9% following strong growth in New South Wales CTP, premium increases in Home and Motor products and the successful entry into the South Australian CTP scheme. Commercial insurance GWP reduced 2.2% as pricing increases and strong retention in the SME segment was offset by lower retention in the Corporate segment. Reserve releases of $301 million (FY16: $348 million) remain well above long-term expectations of 1.5% of Group net earned premium (NEP). Life Insurance planned margins and underlying profits remained stable.

Suncorp’s additional reinsurance aggregate cover purchased for FY17 created significant shareholder value and increased resilience to natural hazards. Given the success in FY17, a similar cover has been purchased for FY18. The new cover provides $300 million of cover once the retained portion of natural hazard events greater than $10 million exceeds a total of $475 million. The retained natural hazards allowance has increased to reflect the higher natural hazards costs experienced in recent years.
The upper limit on Suncorp’s main catastrophe program, which covers the Group’s Home, Motor and Commercial Property portfolios for major events, will remain unchanged at $6.9 billion for the 2018 financial year.

The Banking & Wealth business delivered NPAT of $400 million, impacted by investment in the Core Banking and Wealth platforms to support Suncorp’s strategy.

The Banking business achieved NPAT of $396 million with a focus on sustainable profitable growth while adapting to changing economic and regulatory dynamics.

Lending growth of 1.9% reflected improved momentum in the second half of the financial year. They have throttled back on higher LVR loans.

Home lending remains a large part of the business, with about three quarters of loans principal and interest, and with a concentration in Queensland.

The past due has risen this past year.

NIM of 1.83% reflects targeted repricing of mortgage rates, but is still down on FY16.


The cost to income ratio of 52.7% was a result of stable operating expenses and the subdued growth environment.

Impairment losses reduced to $7 million, representing 1 basis point of gross loans and advances.

The Wealth business NPAT of $4 million reflects the cost of completing the Super Simplification Program and lower investment returns. Funds under management and administration increased by 0.8%.

They continue to drive “Project Ignite” (migration of core banking to its new Oracle platform), but said they would halt the migration of deposits and transaction banking products while it waits on upgrades from the vendor.

New Zealand achieved NPAT of A$82 million, impacted by claims costs associated with the Kaikoura earthquake and the associated reinsurance reinstatement expense. New Zealand General Insurance profit reduced to A$45 million, however underlying ITR was above the Group’s target of 12%. GWP growth of 6.3% was primarily driven by the Motor and Home portfolios. New Zealand Life Insurance delivered NPAT of A$37 million with a stable underlying profit of A$39 million, offset by negative market adjustments. During the financial year, the New Zealand business disposed of its Autosure motor insurance business. The sale resulted in a release of capital of A$30 million and will be accretive to the New Zealand long-term return on equity. A goodwill write-off of A$25 million has been included as a non-cash item in the Group result.

Capital and Dividend
The Board has determined a fully franked final dividend of 40 cents per share. This brings total ordinary dividends for the 2017 financial year to 73 cents per share, up 7.4%. This represents a dividend payout ratio of 81.9% of cash earnings, slightly above the top end of the 60% to 80% dividend payout range and reflects the Board’s confidence in the outlook for the Group.

After accounting for the final dividend, the Suncorp Group’s Common Equity Tier 1 (CET1) is $377 million above its operating targets.

The General Insurance CET1 is 1.32 times the Prescribed Capital Amount and Bank CET1 is 9.23% are above the top end of their target ranges.
The Group has $235 million of franking credits available after the payment of the final dividend. It has a strong capital position.


More Evidence of Mortgage Distress

Genworth, the listed Lenders Mortgage Insurer (LMI) released their 1H17 results today, and as a bellwether for the mortgage industry, they make interesting reading.  We see continued pressure on mortgage defaults in WA (0.86%) and QLD (0.72%), and a fall in higher LVR lending leading to lower volumes of new premiums being written, but at higher prices.  The average original LVR of new flow business written in 1H17 was 82%.

They reported a statutory net profit after tax (NPAT) of $88.7 million for 1H17. After adjusting for the after-tax mark-to-market move in the investment portfolio of $24.8 million, underlying NPAT was $113.5 million. Compared with IH16, net written premiums were down 7.5%, reported NPAT was down 34.7%, the loss ratio was up 1.8% and the delinquency rate was up 8 basis points. The ROE was down 3.4%. They also suffered a decline in investment returns, from 3.53% (IH16) to 2.88% this time.

Net claims incurred decreased 2.4% which included the $8.2 million favourable impact of a periodic review of its non-reinsurance recoveries on paid claims. This benefit was partially offset by an increase in delinquencies from Queensland and Western Australia, particularly in regions exposed to the slowdown in the resources sector.

5,997 new delinquencies were added in 1H17 with a total of 7,285 on book, reflecting a delinquency rate of 0.51%, up from 0.46% in 2H16. Cures were higher, reflecting ongoing borrower sales activity.

Genworth has commercial relationships with over 100 lender customers across Australia and has Supply and Service Contracts with 8 of its key customers. The top three customers accounted for approximately 66 % of Genworth’s total New Insurance Written (NIW) and 71 % of GWP in 1H17. The largest customer accounted for 37 % of total NIW and 51 % of GWP in 1H17. The Group estimates that it had approximately 30 % of the Australian LMI market by NIW for the six months ended 30 June 2017.

On 10 March 2017, Genworth announced that the exclusivity agreement for the provision of LMI with its second largest customer was terminated in April 2017. The LMI business underwritten under this contract represented 14% of Gross Written Premium (GWP) in 2016. The Company has been successful in entering into new business with that customer that assists them in managing mortgage default risk through alternative insurance arrangements.

Genworth also previously advised that its customer, the National Australia Bank, has issued a Request For Proposal relating to its LMI requirements. The Company has submitted its proposal and will provide updates as to the outcome of its proposal.

Genworth continues to pursue other profitable opportunities in the market that meet its risk appetite and return on equity profile.

They showed their delinquency by year of acquisition.

Each line illustrates the level of 3 month+ delinquencies relative to the number of months an LMI policy has been in-force for policies issued within a specific year.

2008 Book Year was affected by the economic downturn in Australia and heightened stress experienced among self-employed borrowers, particularly in Queensland, which was exacerbated by the floods in 2011.

Post-GFC book years seasoning at lower levels as a result of credit tightening, however ongoing deterioration for 2012-14 books have been predominantly driven by resource reliant states of QLD and WA that are continuing to face challenges following the mining sector downturn.

The above chart illustrates the delinquency population by months in arrears (MIA) aged bucket at the end of each reporting period. Over the past two years, the mortgagee in possession (MIP) percentage as a proportion of the total delinquency population has been trending down.

This reflects strong housing market conditions and the low interest rate environment in which a MIP generally progresses faster to a claim, or sold with no claim, which in turn leads to a relatively lower claims pipeline.

The 3-5 months MIA bucket shows a seasonal uptick in the second quarter of each year, consistent with historical observed experience.

The CET1 capital did not materially change in 1H17 reflecting the $88.7 million Reported NPAT being offset by the $71.3m dividends paid and a $17.0 million decrease in the excess technical provisions. The PCA coverage ratio increased from 1.57x to 1.81x, mainly through a $135.8 million reduction in the PML and a $50 million increase in Allowable Reinsurance.

The Board declared a fully franked interim ordinary dividend of 12.0 cents per share and a fully franked special dividend of 2.0 cents per share both payable on payable on 30 August 2017 to shareholders registered on 16 August 2017.

Macquarie 1Q18 Update – Tracking Well

The Macquarie Group 1Q 18 update shows the group is travelling well, with no significant on-off items in the quarter. The Bank Group APRA Basel III Common Equity Tier 1 capital ratio was 10.9 per cent at 30 June 2017, down from 11.1 per cent at 31 March 2017.

Macquarie currently expects the year ending 31 March 2018 (FY18) combined net profit contribution from operating groups to be broadly in line with the year ended 31 March 2017 (FY17).

APRA’s proposal to establish ‘unquestionably strong’ Australian banking sector capital ratios by 2020 would increase Macquarie Bank Limited’s minimum capital requirements by approximately $A1.4 billion.

The estimated annualised cost of the bank tax has the same effect as increasing Macquarie Bank’s Australian effective tax rate from 34 per cent to 41 per cent they said.

The Group’s short-term outlook remains subject to:

  • market conditions
  • the impact of foreign exchange; and
  • potential regulatory changes and tax uncertainties

The Australian mortgage portfolio of $A29.4 billion increased two per cent on 31 March 2017.

Macquarie Asset Management (MAM) had $A460.8 billion in assets under management at 30 June 2017, down four per cent on 31 March 2017, largely due to net asset realisations in Macquarie Infrastructure and Real Assets (MIRA), partially offset by favourable market and foreign exchange movements. MIRA’s equity under management of $A74.2 billion was down four per cent from $A77.2 billion at 31 March 2017. 1Q18 included performance fees from several funds including Macquarie Atlas Roads. During the quarter, MIRA invested equity of $A3.0 billion across four acquisitions and seven follow-on investments in infrastructure and real estate in five countries. Macquarie Investment Management was awarded over $A3.1 billion in new institutional mandates across nine strategies from clients in five countries and Macquarie Specialised Investment Solutions was awarded over $A800 million of new and additional infrastructure debt mandates.

Corporate and Asset Finance’s asset and loan portfolio of $A36.2 billion at 30 June 2017, was broadly in line with 31 March 2017. During the quarter, there were portfolio additions of $A0.9 billion in corporate and real estate lending across new primary financings and secondary market acquisitions. In addition, $A0.8 billion of motor vehicle and equipment leases and loans were securitised.

Banking and Financial Services had total BFS deposits6 of $A47.3 billion at 30 June 2017, up six per cent on 31 March 2017. The Australian mortgage portfolio of $A29.4 billion increased two per cent on 31 March 2017, funds on platform7 of $A79.1 billion increased ten per cent on 31 March 2017 largely due to the final migration of full service broking accounts to the Vision platform, and the business banking loan portfolio of $A6.7 billion increased three per cent on 31 March 2017. During the quarter, BFS entered into exclusive due diligence with Morgan Stanley to provide administration services and develop a new white labelled Wrap offering. BFS won Best Digital Banking Offering and Most Innovative Card Offering at the 2017 Australian Retail Banking Awards.

Commodities and Global Markets saw client hedging and trading opportunities remain steady across the commodities platform, and experienced continued strong customer activity in foreign exchange, interest rates and futures markets, which was driven by ongoing market volatility. CGM also experienced increased equity capital markets activity and market turnover in Cash Equities. During the quarter, CGM entered into an agreement to acquire Cargill’s North American Power and Gas business to expand the geographic and service coverage in key markets in the region. CGM also announced the merger of the Energy Markets and Metals, Mining and Agriculture divisions to form one commodities division called Commodity Markets and Finance.

Macquarie Capital experienced increased client activity in debt capital markets, while equity capital markets and M&A activity remained subdued compared to the prior corresponding period. In 1Q18, 97 deals were completed at $A45 billion, up on 1Q17 and broadly in line with 4Q17 (by value)8. The principal book performed in line with expectations. Macquarie Capital was ranked No.1 for global Infrastructure Finance financial advisory9. Macquarie Capital was also ranked No.1 for announced and completed M&A deals10 and No.1 for IPO and ECM deals in Australia10.